Races in Pella, Iowa (IA) Detailed Stats
Ancestries, Foreign-born residents, place of birth
Settings
X


Recent posts about races in Pella, Iowa on our local forum with over 2,400,000 registered users:
 | Ankeny vs. Pella (14 replies) |
| How would one define northern Iowa? (17 replies) |
| Relocating to Pella, IA need advice! (10 replies) |
| Best Des Moines suburban school districts? (30 replies) |
| Dream town in Iowa (34 replies) |
| Altoona vs. Pella (26 replies) |
Latest news about races in Pella, IA collected exclusively by city-data.com from local newspapers, TV, and radio stations
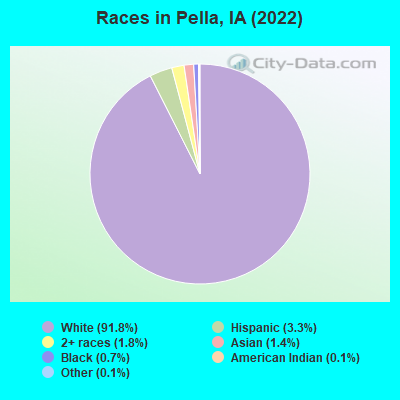
According to 2022 data, the most numerous races in Pella, IA are White alone (9,727 residents), Hispanic (346 residents), and Black alone (69 residents). 94.6% of Pella residents speak English at home. 3.3% of Pella, IA residents are foreign-born (1.3% born in Asia, 1.1% born in Europe, 0.6% born in Latin America), which is 52.2% less than the foreign-born rate of 5.0% across the entire state of Iowa.
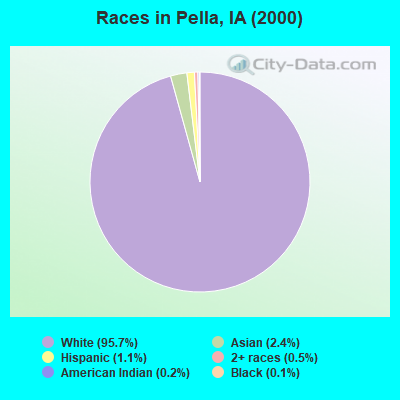
Race distribution in Pella
2000
2022

- 9,40595.7%White alone
- 2322.4%Asian alone
- 1061.1%Hispanic
- 500.5%Two or more races
- 200.2%American Indian alone
- 120.1%Black alone
- 60.06%Native Hawaiian and Other
Pacific Islander alone - 10.01%Other race alone
-
- 9,72791.8%White alone
- 3463.3%Hispanic
- 1941.8%Two or more races
- 1501.4%Asian alone
- 690.7%Black alone
- 130.1%Other race alone
- 150.1%American Indian alone
2000
2022
-
- 2,710,34492.6%White alone
- 82,4732.8%Hispanic
- 60,7442.1%Black alone
- 36,3451.2%Asian alone
- 25,4720.9%Two or more races
- 7,9550.3%American Indian alone
- 2,1030.07%Other race alone
- 8880.03%Native Hawaiian and Other
Pacific Islander alone

-
- 2,650,11082.8%White alone
- 218,0246.8%Hispanic
- 119,0043.7%Black alone
- 115,2863.6%Two or more races
- 74,8922.3%Asian alone
- 9,2600.3%Other race alone
- 8,5950.3%Native Hawaiian and Other
Pacific Islander alone - 5,3460.2%American Indian alone

Income and house value in Pella
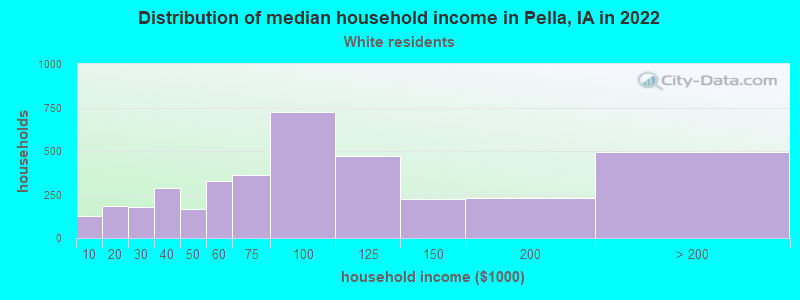
- Median household income in 2022
- $85,486White non-Hispanic householders
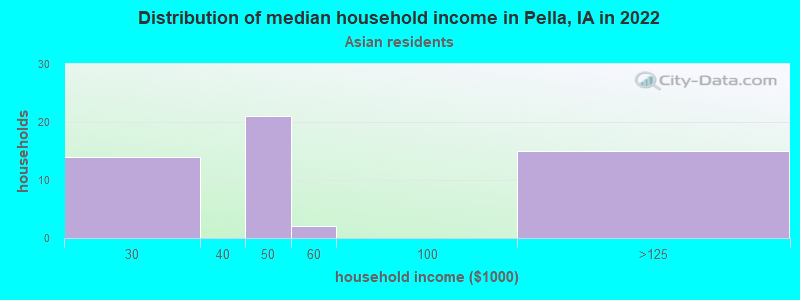
- $49,608Asian householders
- Median 2022 house value
- $261,480White Non-Hispanic householders
- $215,583Asian householders
- $165,493Two or more races householders
Household income for White non-Hispanic householders
Household income for Asian householders
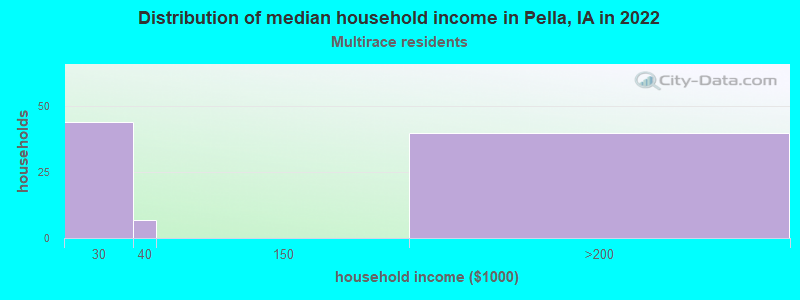
Household income for Two or more races householders
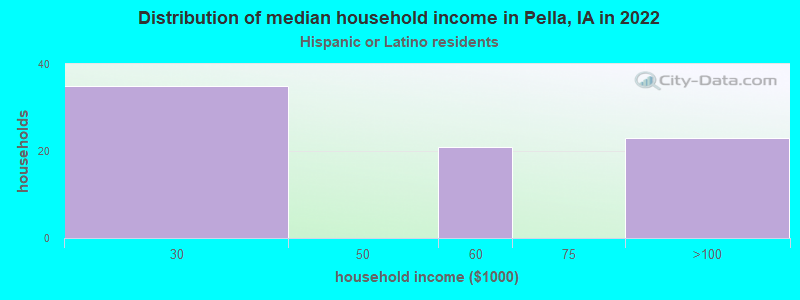
Household income for Hispanic or Latino race householders
Median age by race in Pella
- 36.5Median age for White residents
- 32.7Males
- 40.4Females
- 30.2Median age for Black or African American residents
- 29.7Males
- -698,646,985.8Females
- 32.4Median age for American Indian / Alaska Native residents
- -654,282,765.1Males
- -670,912,950.5Females
- 40.8Median age for Asian residents
- 41.3Males
- 49.6Females
- -580,729,166.1Median age for Native Hawaiian / Pacific Islander residents
- -776,978,416.5Males
- -504,347,825.6Females
- 19.8Median age for Other race residents
- 19.7Males
- 22.6Females
- 24.6Median age for Two or more races residents
- 23.6Males
- 38.1Females
- 36.2Median age for White alone residents
- 32.9Males
- 39.8Females
- 21.5Median age for Hispanic or Latino residents
- 19.7Males
- 44.7Females
Owner/renter occupied households by race in Pella
- House owners and renters - White residents
- 2,55667.7%Owner occupied
- 1,21732.3%Renter occupied
- House owners and renters - American Indian / Alaska Native residents
- 6100.0%Owner occupied
- House owners and renters - Asian residents
- 2039.7%Owner occupied
- 3060.3%Renter occupied
- House owners and renters - Other race residents
- 34100.0%Owner occupied
- House owners and renters - Two or more races residents
- 7791.0%Owner occupied
- 89.0%Renter occupied
- House owners and renters - White alone residents
- 2,55467.5%Owner occupied
- 1,23232.5%Renter occupied
- House owners and renters - Hispanic or Latino residents
- 8385.8%Owner occupied
- 1414.2%Renter occupied
Language usage in Pella
- English speakers - Total
- 94.6% of residents of Pella speak English at home.
- 2.5% of residents speak Spanish at home
- 15762.5%Speak English very well
- 9437.5%Speak English less than very well
- 2.8% of residents speak other language at home
- 18265.5%Speak English very well
- 9634.5%Speak English less than very well
- English speakers - Born in the United States
- 95.6% of residents of Pella speak English at home.
- 3.4% of residents speak Spanish at home
- 9490.4%Speak English very well
- 109.6%Speak English less than very well
- 1.0% of residents speak other language at home
- 26.9%Speak English very well
- 2793.1%Speak English less than very well
- English speakers - Native, born elsewhere
- 47.7% of residents of Pella speak English at home.
- 32.3% of residents speak Spanish at home
- 419.0%Speak English very well
- 1781.0%Speak English less than very well
- 9.2% of residents speak other language at home
- 6100.0%Speak English very well
- English speakers - Foreign-born
- 18.1% of residents of Pella speak English at home.
- 20.6% of residents speak Spanish at home
- 2432.0%Speak English very well
- 5168.0%Speak English less than very well
- 61.5% of residents speak other language at home
- 16071.4%Speak English very well
- 6428.6%Speak English less than very well
White (Caucasian) - Speak only English
| Native: | 99.4% (9,050) |
| Foreign-born: | 24.3% (31) |
White (Caucasian) - Speak another language
| Native: | 0.9% (83) |
| Foreign-born: | 75.1% (97) |
Asian - Speak only English
| Native: | 100.0% (15) |
| Foreign-born: | 23.5% (33) |
Other race - Speak another language
| Native: | 86.3% (94) |
| Foreign-born: | 100.0% (15) |
Two or more races - Speak another language
| Native: | 27.4% (68) |
| Foreign-born: | 97.8% (13) |
White alone - Speak only English
| Native: | 99.3% (9,040) |
| Foreign-born: | 27.8% (35) |
White alone - Speak another language
| Native: | 0.7% (65) |
| Foreign-born: | 72.3% (91) |
Hispanic or Latino - Speak another language
| Native: | 64.2% (158) |
| Foreign-born: | 100.0% (64) |
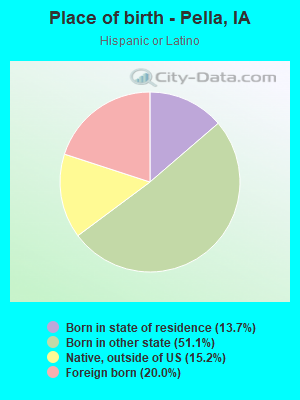
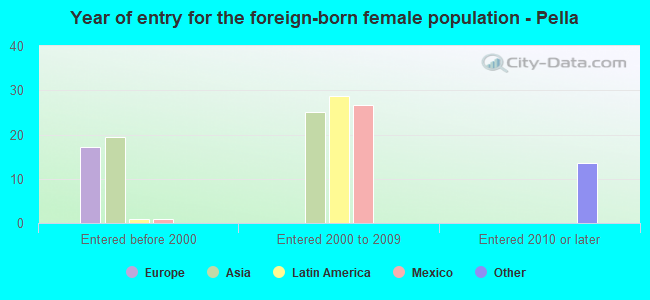
Foreign-born residents in Pella
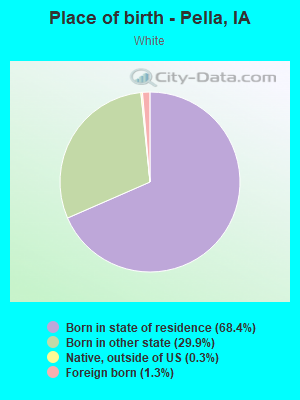
348 residents are foreign born (1.3% Asia, 1.1% Europe, 0.6% Latin America).
| This city: | 3.3% |
| Iowa: | 5.6% |

Marital status for residents in Pella
Marital status - White (Caucasian) population 15 years and over
- Males
- 33.6%Never married
- 58.7%Now married
- 0.2%Separated
- 1.6%Widowed
- 5.8%Divorced
- Females
- 29.5%Never married
- 51.1%Now married
- 0.9%Separated
- 11.7%Widowed
- 6.8%Divorced
Women who gave birth in the past 12 months
| Now married: | 84.3% (42) |
| Unmarried: | 15.7% (8) |
Women who did not give birth in the past 12 months
| Now married: | 45.0% (924) |
| Unmarried: | 55.0% (1,132) |
Marital status - Black or African American population 15 years and over
- Males
- 11.9%Never married
- 88.1%Now married
- 0.0%Separated
- 0.0%Widowed
- 0.0%Divorced
- Females
- 100.0%Never married
- 0.0%Now married
- 0.0%Separated
- 0.0%Widowed
- 0.0%Divorced
Women who did not give birth in the past 12 months
| Now married: | 0.0% (0) |
| Unmarried: | 100.0% (10) |
Marital status - American Indian / Alaska Native population 15 years and over
- Males
- 100.0%Never married
- 0.0%Now married
- 0.0%Separated
- 0.0%Widowed
- 0.0%Divorced
- Females
- 0.0%Never married
- 0.0%Now married
- 100.0%Separated
- 0.0%Widowed
- 0.0%Divorced
Women who did not give birth in the past 12 months
| Now married: | 100.0% (15) |
| Unmarried: | 0.0% (0) |
Marital status - Asian population 15 years and over
- Males
- 40.7%Never married
- 59.3%Now married
- 0.0%Separated
- 0.0%Widowed
- 0.0%Divorced
- Females
- 32.8%Never married
- 67.2%Now married
- 0.0%Separated
- 0.0%Widowed
- 0.0%Divorced
Women who did not give birth in the past 12 months
| Now married: | 67.2% (41) |
| Unmarried: | 32.8% (20) |
Marital status - Other race population 15 years and over
- Males
- 67.2%Never married
- 32.8%Now married
- 0.0%Separated
- 0.0%Widowed
- 0.0%Divorced
- Females
- 24.0%Never married
- 76.0%Now married
- 0.0%Separated
- 0.0%Widowed
- 0.0%Divorced
Women who did not give birth in the past 12 months
| Now married: | 76.0% (25) |
| Unmarried: | 24.0% (8) |
Marital status - Two or more races population 15 years and over
- Males
- 84.7%Never married
- 15.3%Now married
- 0.0%Separated
- 0.0%Widowed
- 0.0%Divorced
- Females
- 7.6%Never married
- 39.4%Now married
- 0.0%Separated
- 45.5%Widowed
- 7.6%Divorced
Women who did not give birth in the past 12 months
| Now married: | 64.3% (13) |
| Unmarried: | 35.7% (7) |
Marital status - White alone, not Hispanic / Latino population 15 years and over
- Males
- 32.7%Never married
- 59.5%Now married
- 0.2%Separated
- 1.6%Widowed
- 5.9%Divorced
- Females
- 28.9%Never married
- 51.8%Now married
- 0.9%Separated
- 11.5%Widowed
- 6.9%Divorced
Women who gave birth in the past 12 months
| Now married: | 84.3% (43) |
| Unmarried: | 15.7% (8) |
Women who did not give birth in the past 12 months
| Now married: | 45.8% (940) |
| Unmarried: | 54.2% (1,110) |
Marital status - Hispanic or Latino population 15 years and over
- Males
- 83.7%Never married
- 16.3%Now married
- 0.0%Separated
- 0.0%Widowed
- 0.0%Divorced
- Females
- 49.1%Never married
- 9.4%Now married
- 0.0%Separated
- 41.5%Widowed
- 0.0%Divorced
Women who did not give birth in the past 12 months
| Now married: | 14.8% (10) |
| Unmarried: | 85.2% (57) |
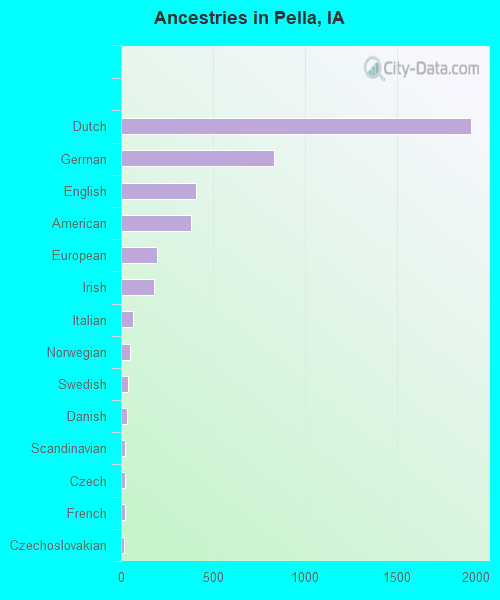
Ancestries in Pella

- 1,90537.9%Dutch
- 83316.6%German
- 4068.1%English
- 3827.6%American
- 1983.9%European
- 1813.6%Irish
- 631.3%Italian
- 491.0%Norwegian
- 360.7%Swedish
- 340.7%Danish
- 230.5%Scandinavian
- 210.4%Czech
- 210.4%French
- 190.4%Czechoslovakian
- 130.3%Welsh
- 110.2%Greek
- 100.2%Northern European
- 100.2%Swiss
- 90.2%Croatian
- 60.1%Brazilian
- 60.1%Scottish
- 10.02%Ukrainian
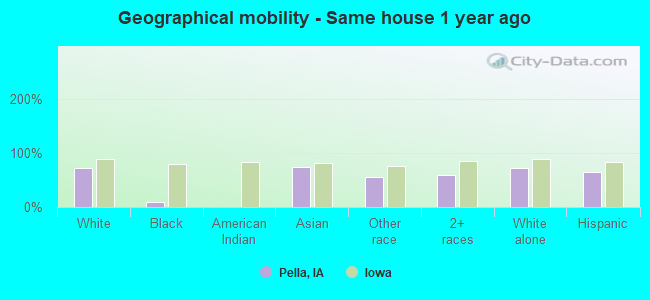
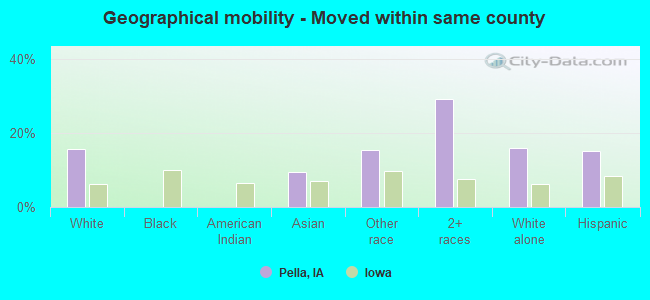
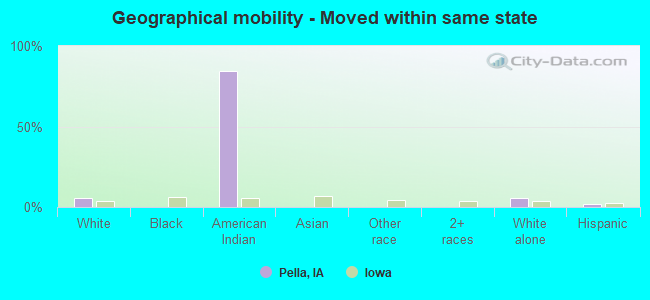
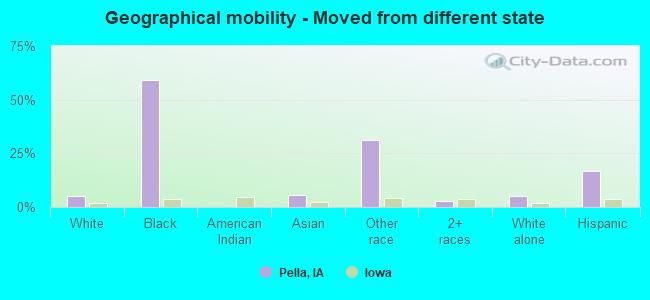
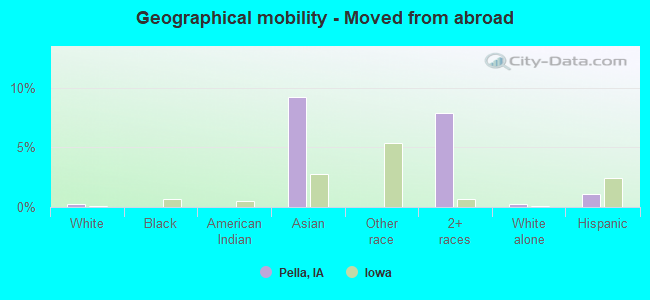
Geographical mobility in Pella

- Same house 1 year ago
- 6,91071.6%White (Caucasian)
- 69.1%Black or African American
- 11073.2%Asian
- 10255.9%Other race
- 18858.5%Two or more races
- 6,91671.5%White alone, not Hispanic / Latino
- 22765.5%Hispanic or Latino
-
- Moved within same county
- 1,52515.8%White / Caucasian
- 149.4%Asian
- 2815.5%Other race
- 9429.2%Two or more races
- 1,54316.0%White alone, not Hispanic / Latino
- 5315.1%Hispanic or Latino
-
- Moved within same state
- 5325.5%White / Caucasian
- 1884.3%American Indian / Alaska Native
- 5365.5%White alone, not Hispanic / Latino
- 61.6%Hispanic or Latino
-
- Moved from different state
- 5105.3%White / Caucasian
- 4159.0%Black or African American
- 85.5%Asian
- 5731.2%Other race
- 92.7%Two or more races
- 5075.2%White alone, not Hispanic / Latino
- 5917.0%Hispanic or Latino
-
- Moved from abroad
- 250.3%White
- 149.2%Asian
- 257.9%Two or more races
- 260.3%White alone, not Hispanic / Latino
- 41.1%Hispanic or Latino
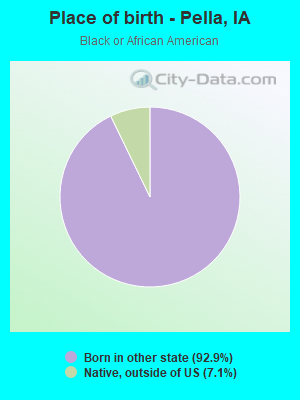
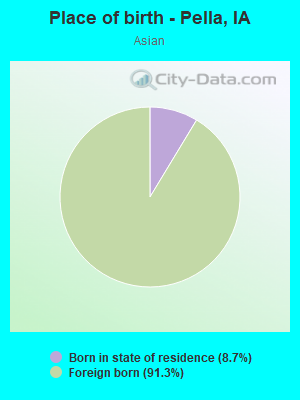
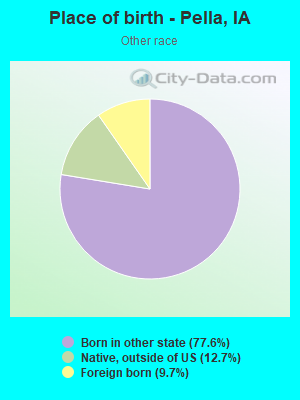
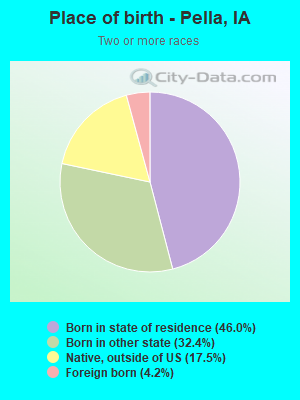
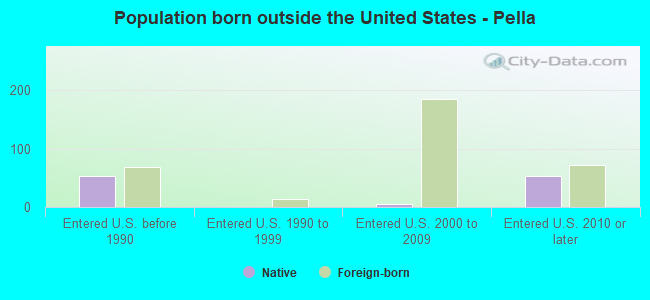
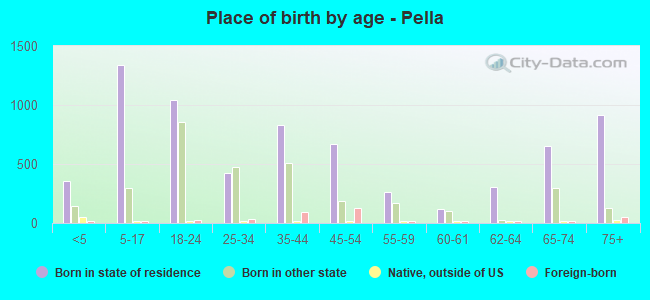
Children Nativity (place of birth) in Pella
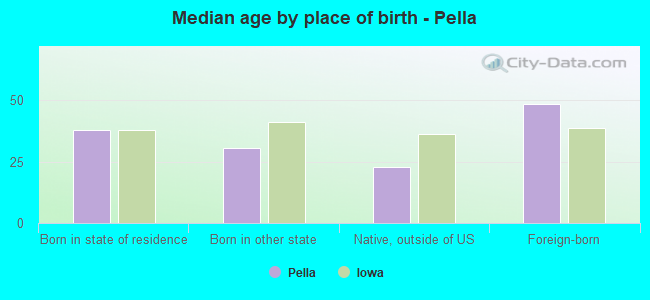
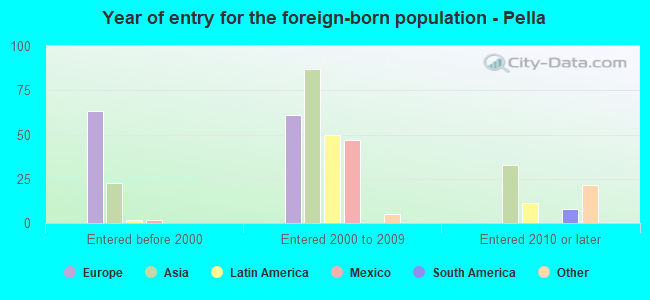
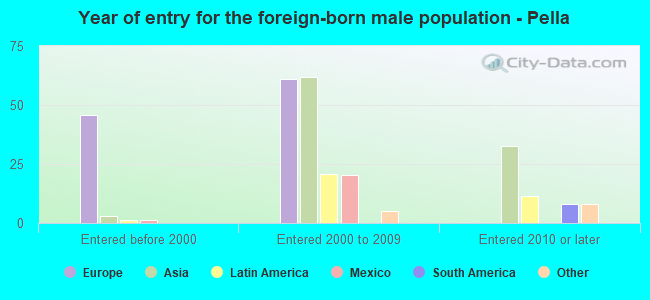
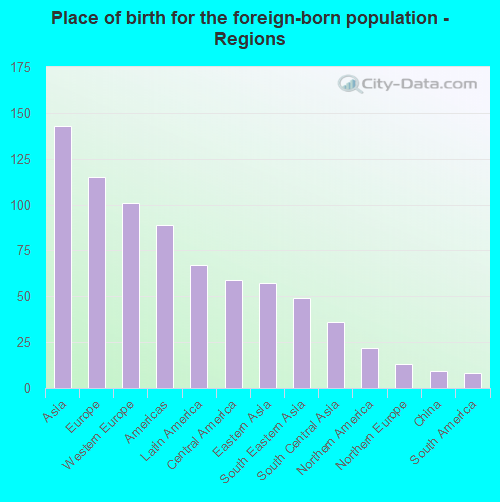
Place of birth for residents in Pella
![Place of birth for the foreign-born population - Regions]()
- 143Asia
- 115Europe
- 101Western Europe
- 89Americas
- 67Latin America
- 59Central America
- 57Eastern Asia
- 49South Eastern Asia
- 36South Central Asia
- 22Northern America
- 13Northern Europe
- 9China
- 8South America
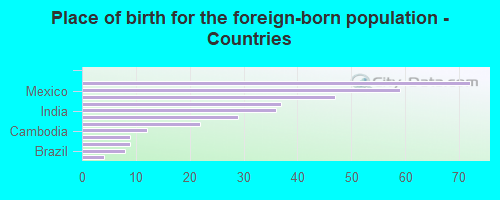
![Place of birth for the foreign-born population - Countries]()
- 72Netherlands
- 59Mexico
- 47Korea
- 37Philippines
- 36India
- 29Germany
- 22Canada
- 12Cambodia
- 9England
- 9China
- 8Brazil
- 4United Kingdom
Zip codes: 50219.