Races in Penfield, New York (NY) Detailed Stats
Ancestries, Foreign-born residents, place of birth

Recent posts about races in Penfield, New York on our local forum with over 2,400,000 registered users:
 | Rochester-Boom or Bust (743 replies) |
| Newcomers with various questions (94 replies) |
| Housing market - your opinions on specific listings (73 replies) |
| Why's everyone selling their house? (50 replies) |
| Possible New Chain Resturants Coming? (57 replies) |
| Moving there, need recommendations for doc, vet, etc. (9 replies) |
8.8% of Penfield, NY residents are foreign-born (4.8% born in Europe, 2.4% born in Asia), which is 150.5% less than the foreign-born rate of 22.0% across the entire state of New York.
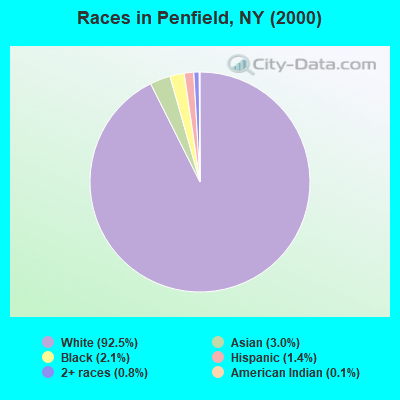
Race distribution in Penfield

- 32,03192.5%White alone
- 1,0533.0%Asian alone
- 7202.1%Black alone
- 4951.4%Hispanic
- 2800.8%Two or more races
- 370.1%American Indian alone
- 220.06%Other race alone
- 70.02%Native Hawaiian and Other
Pacific Islander alone
2000
2022
-
- 11,760,98162.0%White alone
- 2,867,58315.1%Hispanic
- 2,812,62314.8%Black alone
- 1,035,9265.5%Asian alone
- 366,1161.9%Two or more races
- 75,4990.4%Other race alone
- 52,4990.3%American Indian alone
- 5,2300.03%Native Hawaiian and Other
Pacific Islander alone

-
- 10,408,93352.9%White alone
- 3,867,29919.7%Hispanic
- 2,633,84013.4%Black alone
- 1,776,2869.0%Asian alone
- 732,6703.7%Two or more races
- 216,1101.1%Other race alone
- 35,0820.2%American Indian alone
- 6,9310.04%Native Hawaiian and Other
Pacific Islander alone

Income and house value in Penfield
- Median household income in 2022
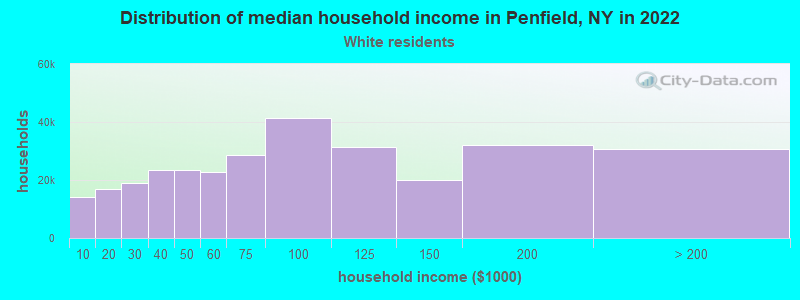
- $97,422White non-Hispanic householders
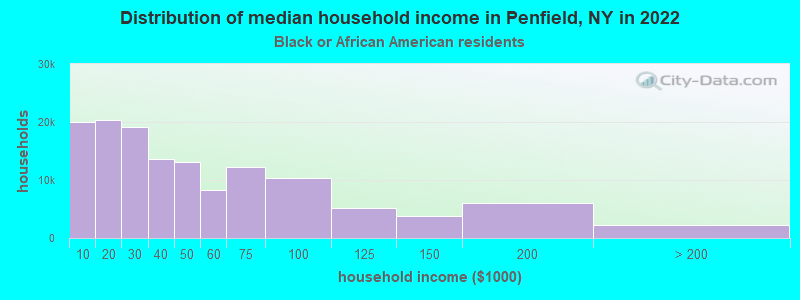
- $109,605Black householders
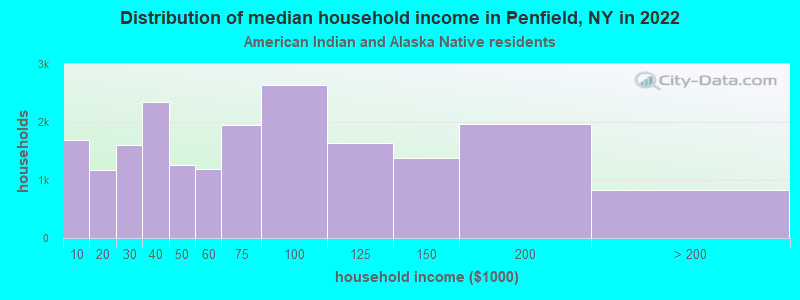
- $32,329American Indian and Alaska Native householders
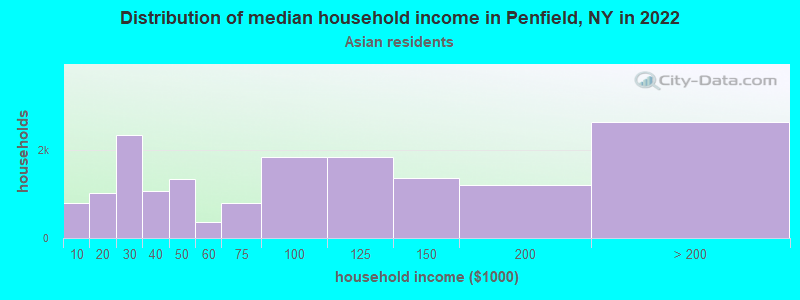
- $150,080Asian householders
- $174,668Some other race householders
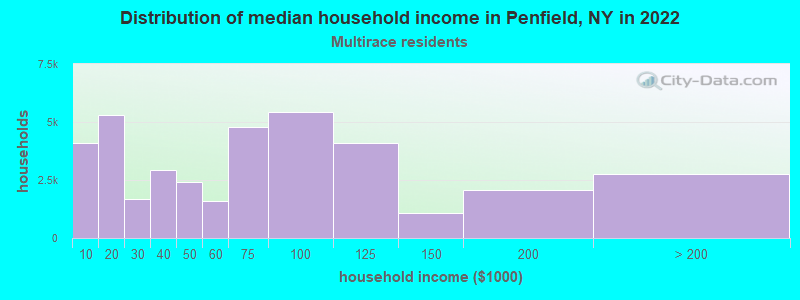
- $126,701Two or more races householders
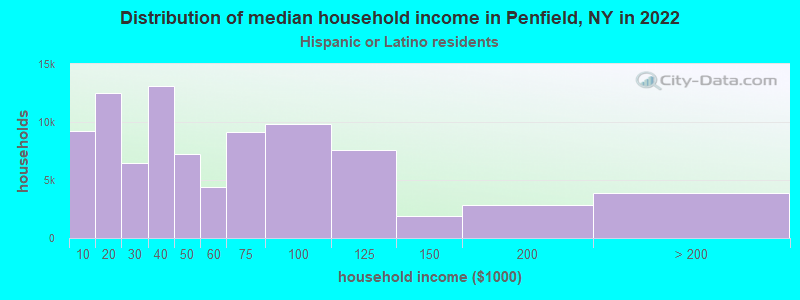
- $158,018Hispanic or Latino race householders
- Median 2022 house value
- $277,328White Non-Hispanic householders
- $320,119Black or African American householders
- $173,202American Indian or Alaska Native householders
- $369,431Asian householders
- $193,579Some other race householders
- $375,340Two or more races householders
- $243,095Hispanic or Latino householders
Household income for White non-Hispanic householders
Household income for Black householders
Household income for American Indian and Alaska Native householders
Household income for Asian householders
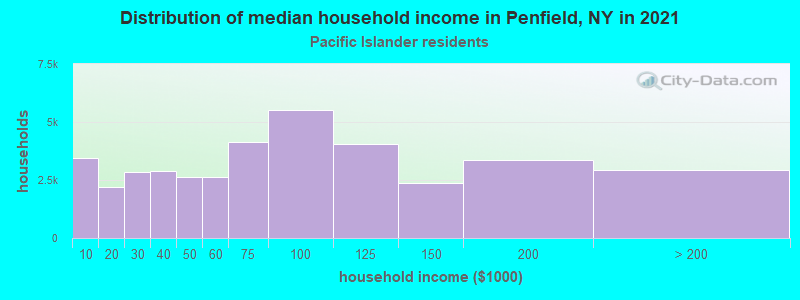
Household income for Native Hawaiian and other Pacific Islander householders
Household income for Two or more races householders
Household income for Hispanic or Latino race householders
Foreign-born residents in Penfield
3,043 residents are foreign born (4.8% Europe, 2.4% Asia).
| This city: | 8.8% |
| New York: | 20.4% |
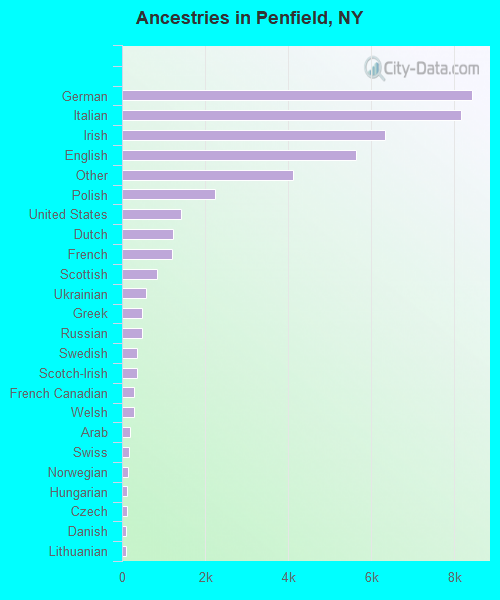
Ancestries in Penfield

- 8,41019.3%German
- 8,14918.7%Italian
- 6,33214.5%Irish
- 5,62312.9%English
- 4,1069.4%Other
- 2,2495.2%Polish
- 1,4273.3%United States
- 1,2352.8%Dutch
- 1,2082.8%French
- 8361.9%Scottish
- 5671.3%Ukrainian
- 4921.1%Greek
- 4771.1%Russian
- 3690.8%Swedish
- 3500.8%Scotch-Irish
- 2990.7%French Canadian
- 2770.6%Welsh
- 1820.4%Arab
- 1800.4%Swiss
- 1550.4%Norwegian
- 1300.3%Hungarian
- 1280.3%Czech
- 1010.2%Danish
- 930.2%Lithuanian
- 730.2%Portuguese
- 730.2%Slovak
- 730.2%West Indian
- 250.06%Subsaharan African
Zip codes: 14526.