Races in Peninsula, Washington (WA) Detailed Stats
Ancestries, Foreign-born residents, place of birth
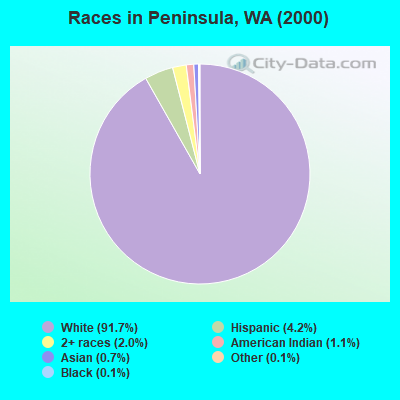
Race distribution in Peninsula

- 8,09191.7%White alone
- 3714.2%Hispanic
- 1742.0%Two or more races
- 1011.1%American Indian alone
- 660.7%Asian alone
- 90.1%Black alone
- 100.1%Other race alone
- 50.06%Native Hawaiian and Other
Pacific Islander alone
2000
2022
-
- 4,652,49078.9%White alone
- 441,5097.5%Hispanic
- 319,4015.4%Asian alone
- 184,6313.1%Black alone
- 175,9263.0%Two or more races
- 85,3961.4%American Indian alone
- 22,7790.4%Native Hawaiian and Other
Pacific Islander alone - 11,9890.2%Other race alone

-
- 4,941,45663.5%White alone
- 1,093,31314.0%Hispanic
- 755,8329.7%Asian alone
- 523,4486.7%Two or more races
- 299,5373.8%Black alone
- 69,0240.9%American Indian alone
- 52,2310.7%Native Hawaiian and Other
Pacific Islander alone - 50,9450.7%Other race alone

Income and house value in Peninsula
- Median household income in 2022
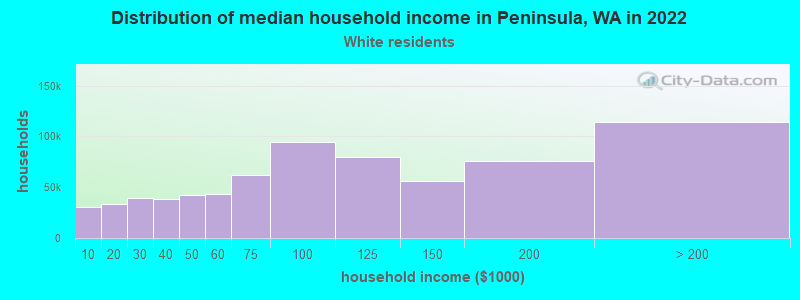
- $57,763White non-Hispanic householders
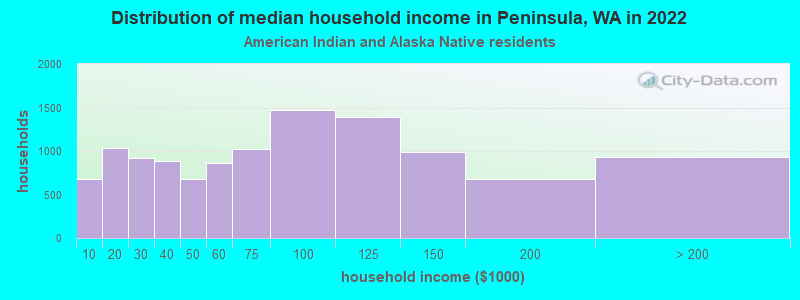
- $52,856American Indian and Alaska Native householders
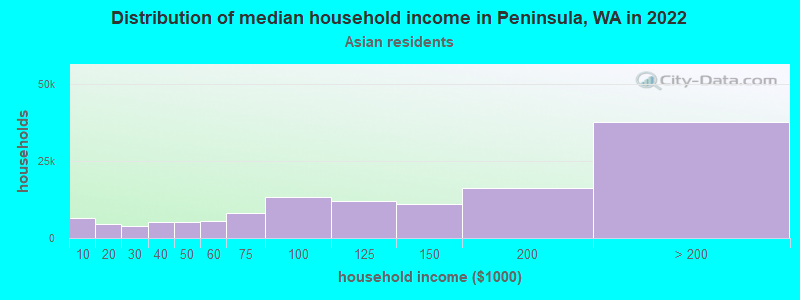
- $98,995Asian householders
- $40,153Some other race householders
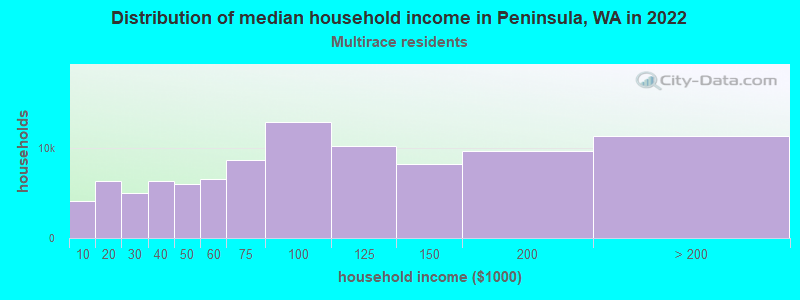
- $58,331Two or more races householders
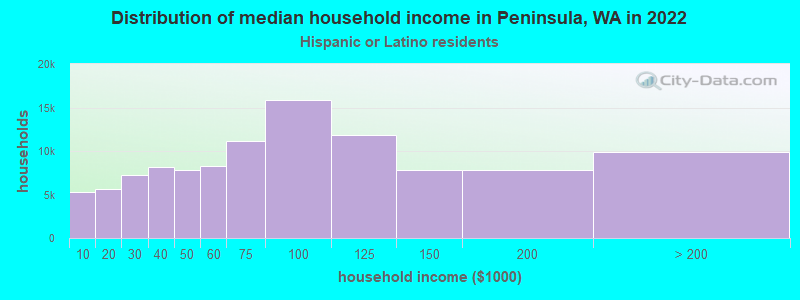
- $53,801Hispanic or Latino race householders
- Median 2022 house value
- $400,690White Non-Hispanic householders
- $505,670American Indian or Alaska Native householders
- $335,117Asian householders
- $325,028Some other race householders
- $405,419Two or more races householders
- $403,842Hispanic or Latino householders
Household income for White non-Hispanic householders
Household income for American Indian and Alaska Native householders
Household income for Asian householders
Household income for Two or more races householders
Household income for Hispanic or Latino race householders
Zip code: 98631