Races in Penn Hills, Pennsylvania (PA) Detailed Stats
Ancestries, Foreign-born residents, place of birth

Recent posts about races in Penn Hills, Pennsylvania on our local forum with over 2,400,000 registered users:
 | PA Republicans bucking party to endorse Democrat Josh Shapiro for governor (284 replies) |
| Throw gas on fires or alternatively: "yeah, this is gonna help things" (75 replies) |
| Is the Pittsburgh Metro Growing in Population? (60 replies) |
| Suburb of the week: Penn Hills (9 replies) |
| Why are Latinos moving to Beechview? (21 replies) |
| Moving to Pittsburgh, House hunting (44 replies) |
2.5% of Penn Hills, PA residents are foreign-born (1.4% born in Europe, 0.5% born in Asia, 0.3% born in Latin America), which is 181.3% less than the foreign-born rate of 7.0% across the entire state of Pennsylvania.
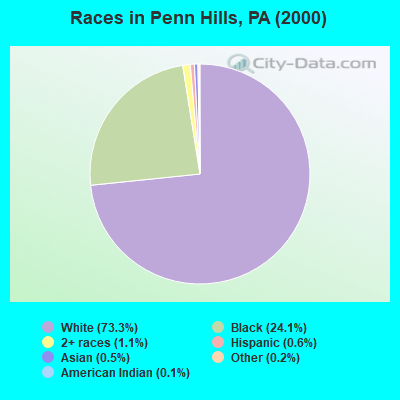
Race distribution in Penn Hills

- 34,29573.3%White alone
- 11,29424.1%Black alone
- 4981.1%Two or more races
- 2970.6%Hispanic
- 2510.5%Asian alone
- 1130.2%Other race alone
- 570.1%American Indian alone
- 40.01%Native Hawaiian and Other
Pacific Islander alone
2000
2022
-
- 10,322,45584.1%White alone
- 1,202,4379.8%Black alone
- 394,0883.2%Hispanic
- 218,2961.8%Asian alone
- 113,0970.9%Two or more races
- 13,0860.1%Other race alone
- 14,9040.1%American Indian alone
- 2,6910.02%Native Hawaiian and Other
Pacific Islander alone

-
- 9,487,22873.1%White alone
- 1,311,58110.1%Black alone
- 1,115,9978.6%Hispanic
- 493,9423.8%Two or more races
- 487,1243.8%Asian alone
- 63,5820.5%Other race alone
- 10,1300.08%American Indian alone
- 2,4240.02%Native Hawaiian and Other
Pacific Islander alone

Income and house value in Penn Hills
- Median household income in 2022
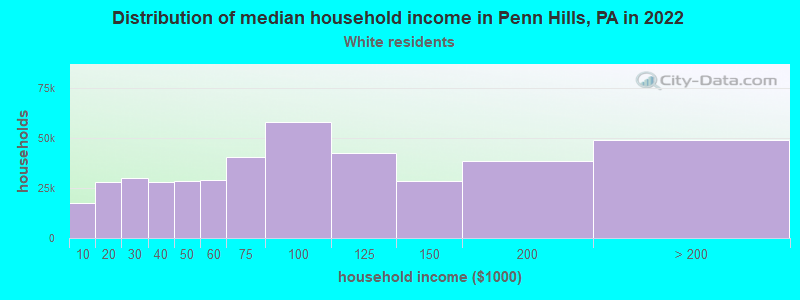
- $75,380White non-Hispanic householders
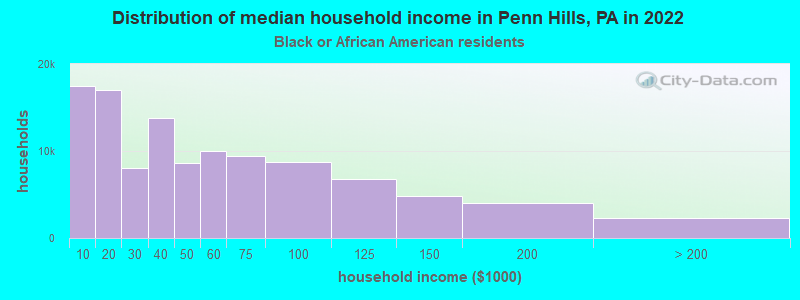
- $72,702Black householders
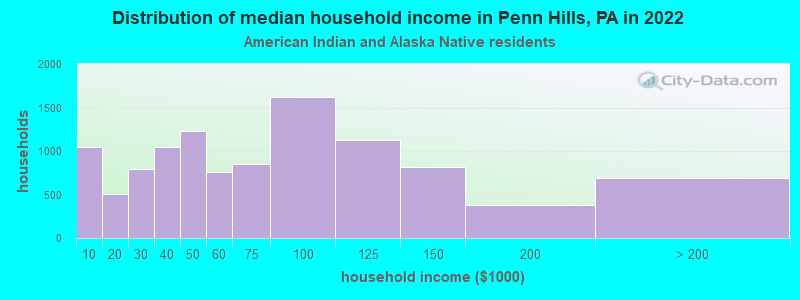
- $57,962American Indian and Alaska Native householders
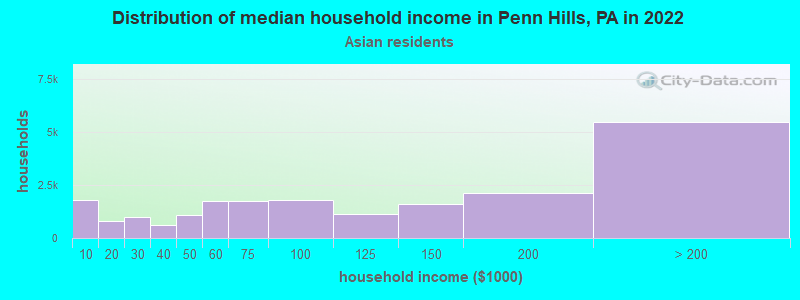
- $107,390Asian householders
- $82,486Some other race householders
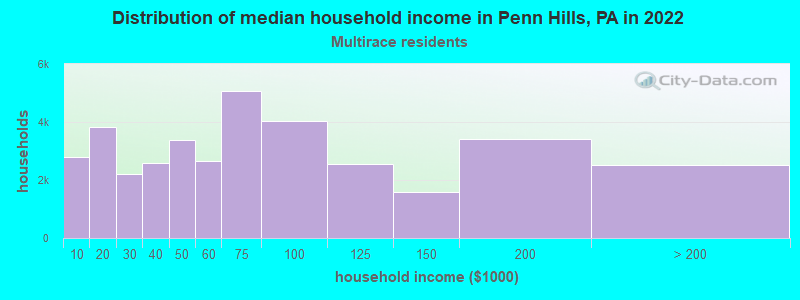
- $95,319Two or more races householders
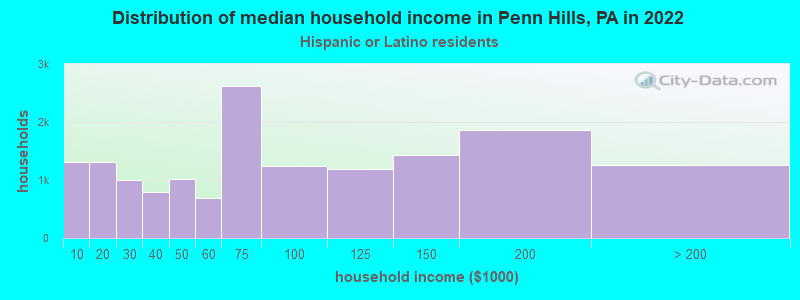
- $93,215Hispanic or Latino race householders
- Median 2022 house value
- $184,794White Non-Hispanic householders
- $178,687Black or African American householders
- $233,913American Indian or Alaska Native householders
- $211,079Asian householders
- $122,399Some other race householders
- $174,173Two or more races householders
- $165,943Hispanic or Latino householders
Household income for White non-Hispanic householders
Household income for Black householders
Household income for American Indian and Alaska Native householders
Household income for Asian householders
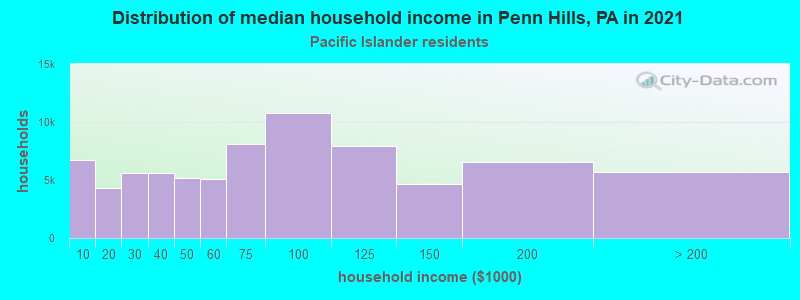
Household income for Native Hawaiian and other Pacific Islander householders
Household income for Two or more races householders
Household income for Hispanic or Latino race householders
Foreign-born residents in Penn Hills
1,165 residents are foreign born (1.4% Europe, 0.5% Asia, 0.3% Latin America).
| This city: | 2.5% |
| Pennsylvania: | 4.1% |
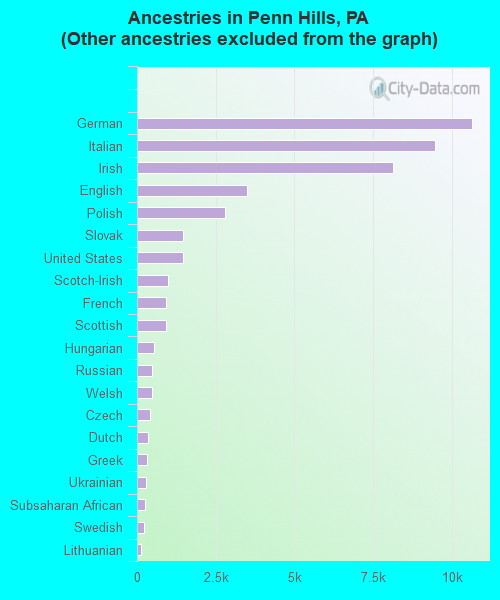
Ancestries in Penn Hills

- 12,55022.1%Other
- 10,65318.8%German
- 9,48316.7%Italian
- 8,14014.4%Irish
- 3,5096.2%English
- 2,8004.9%Polish
- 1,4732.6%Slovak
- 1,4602.6%United States
- 9791.7%Scotch-Irish
- 9271.6%French
- 9061.6%Scottish
- 5411.0%Hungarian
- 4740.8%Russian
- 4740.8%Welsh
- 4200.7%Czech
- 3520.6%Dutch
- 3260.6%Greek
- 2860.5%Ukrainian
- 2640.5%Subsaharan African
- 2340.4%Swedish
- 1140.2%Lithuanian
- 930.2%Swiss
- 920.2%Arab
- 690.1%French Canadian
- 570.1%West Indian
- 300.05%Norwegian
- 60.01%Portuguese
- 50.01%Danish
Zip codes: 15235.