Races in Phoenixville, Pennsylvania (PA) Detailed Stats
Data:
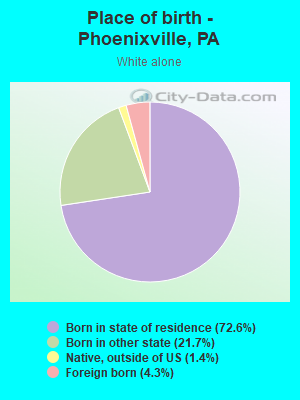
Races - White alone (%)
Races - White alone (% change since 2000)
Races - Black alone (%)
Races - Black alone (% change since 2000)
Races - American Indian alone (%)
Races - American Indian alone (% change since 2000)
Races - Asian alone (%)
Races - Asian alone (% change since 2000)
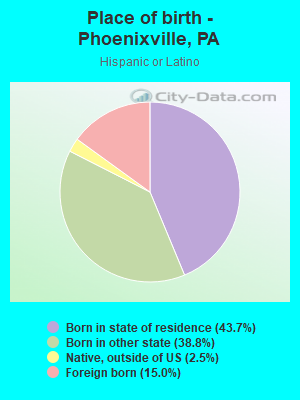
Races - Hispanic (%)
Races - Hispanic (% change since 2000)
Races - Native Hawaiian and Other Pacific Islander alone (%)
Races - Native Hawaiian and Other Pacific Islander alone (% change since 2000)
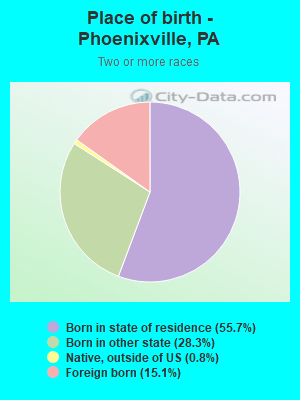
Races - Two or more races(%)
Races - Two or more races(% change since 2000)
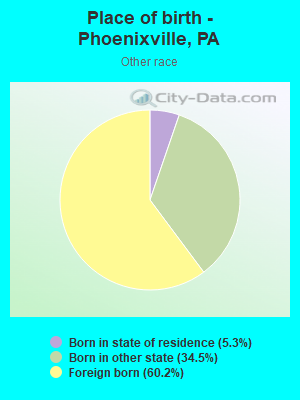
Races - Other race alone (%)
Races - Other race alone (% change since 2000)
Racial diversity
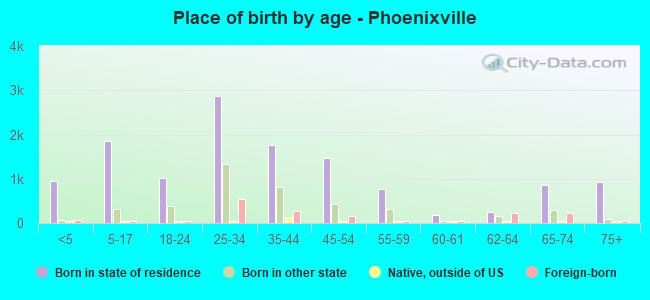
Place of birth - Born in state of residence (%)
Place of birth - Born in state of residence (%) - White
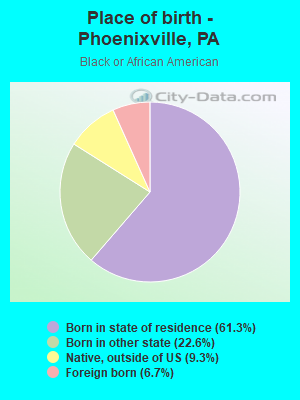
Place of birth - Born in state of residence (%) - Black or African American
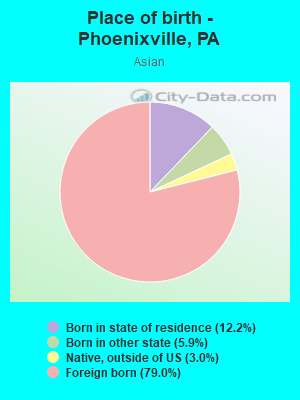
Place of birth - Born in state of residence (%) - Asian
Place of birth - Born in state of residence (%) - Hispanic or Latino
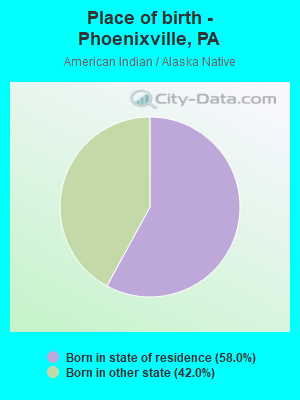
Place of birth - Born in state of residence (%) - American Indian and Alaska Native
Place of birth - Born in state of residence (%) - Multirace
Place of birth - Born in state of residence (%) - Other Race
Place of birth - Born in other state (%)
Place of birth - Born in other state (%) - White
Place of birth - Born in other state (%) - Black or African American
Place of birth - Born in other state (%) - Asian
Place of birth - Born in other state (%) - Hispanic or Latino
Place of birth - Born in other state (%) - American Indian and Alaska Native
Place of birth - Born in other state (%) - Multirace
Place of birth - Born in other state (%) - Other Race
Place of birth - Native, outside of US (%)
Place of birth - Native, outside of US (%) - White
Place of birth - Native, outside of US (%) - Black or African American
Place of birth - Native, outside of US (%) - Asian
Place of birth - Native, outside of US (%) - Hispanic or Latino
Place of birth - Native, outside of US (%) - American Indian and Alaska Native
Place of birth - Native, outside of US (%) - Multirace
Place of birth - Native, outside of US (%) - Other Race
Place of birth - Foreign born (%)
Place of birth - Foreign born (%) - White
Place of birth - Foreign born (%) - Black or African American
Place of birth - Foreign born (%) - Asian
Place of birth - Foreign born (%) - Hispanic or Latino
Place of birth - Foreign born (%) - American Indian and Alaska Native
Place of birth - Foreign born (%) - Multirace
Place of birth - Foreign born (%) - Other Race
Residents speaking English at home (%)
Residents speaking English at home - Born in the United States (%)
Residents speaking English at home - Native, born elsewhere (%)
Residents speaking English at home - Foreign born (%)
Residents speaking Spanish at home (%)
Residents speaking Spanish at home - Born in the United States (%)
Residents speaking Spanish at home - Native, born elsewhere (%)
Residents speaking Spanish at home - Foreign born (%)
Residents speaking other language at home (%)
Residents speaking other language at home - Born in the United States (%)
Residents speaking other language at home - Native, born elsewhere (%)
Residents speaking other language at home - Foreign born (%)
Marital status - Never married (%)
Marital status - Now married (%)
Marital status - Separated (%)
Marital status - Widowed (%)
Marital status - Divorced (%)
Ancestries Reported - Arab (%)
Ancestries Reported - Czech (%)
Ancestries Reported - Danish (%)
Ancestries Reported - Dutch (%)
Ancestries Reported - English (%)
Ancestries Reported - French (%)
Ancestries Reported - French Canadian (%)
Ancestries Reported - German (%)
Ancestries Reported - Greek (%)
Ancestries Reported - Hungarian (%)
Ancestries Reported - Irish (%)
Ancestries Reported - Italian (%)
Ancestries Reported - Lithuanian (%)
Ancestries Reported - Norwegian (%)
Ancestries Reported - Polish (%)
Ancestries Reported - Portuguese (%)
Ancestries Reported - Russian (%)
Ancestries Reported - Scotch-Irish (%)
Ancestries Reported - Scottish (%)
Ancestries Reported - Slovak (%)
Ancestries Reported - Subsaharan African (%)
Ancestries Reported - Swedish (%)
Ancestries Reported - Swiss (%)
Ancestries Reported - Ukrainian (%)
Ancestries Reported - United States (%)
Ancestries Reported - Welsh (%)
Ancestries Reported - West Indian (%)
Ancestries Reported - Other (%)
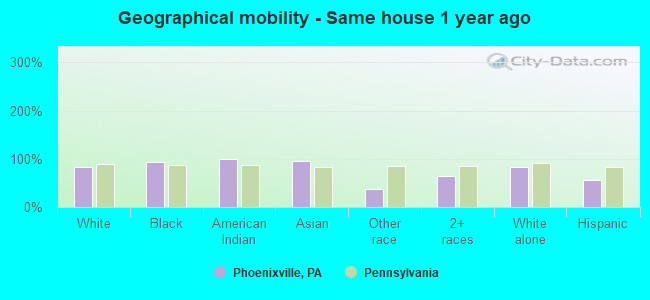
Geographical mobility - Same house 1 year ago (%)
Geographical mobility - Same house 1 year ago (%) - White
Geographical mobility - Same house 1 year ago (%) - Black or African American
Geographical mobility - Same house 1 year ago (%) - Asian
Geographical mobility - Same house 1 year ago (%) - Hispanic or Latino
Geographical mobility - Same house 1 year ago (%) - American Indian and Alaska Native
Geographical mobility - Same house 1 year ago (%) - Multirace
Geographical mobility - Same house 1 year ago (%) - Other Race
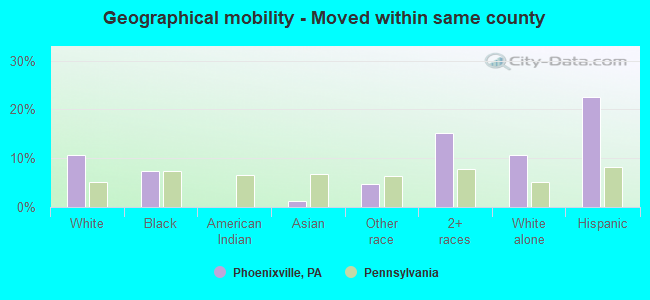
Geographical mobility - Moved within same county (%)
Geographical mobility - Moved within same county (%) - White
Geographical mobility - Moved within same county (%) - Black or African American
Geographical mobility - Moved within same county (%) - Asian
Geographical mobility - Moved within same county (%) - Hispanic or Latino
Geographical mobility - Moved within same county (%) - American Indian and Alaska Native
Geographical mobility - Moved within same county (%) - Multirace
Geographical mobility - Moved within same county (%) - Other Race
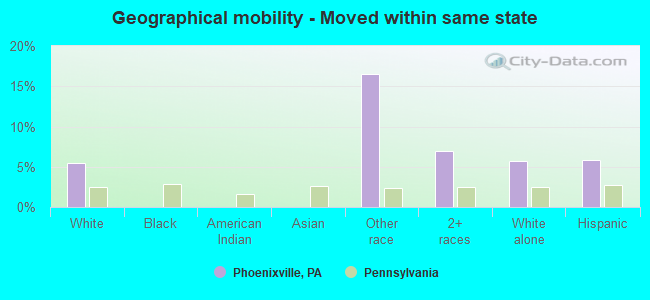
Geographical mobility - Moved from different county within same state (%)
Geographical mobility - Moved from different county within same state (%) - White
Geographical mobility - Moved from different county within same state (%) - Black or African American
Geographical mobility - Moved from different county within same state (%) - Asian
Geographical mobility - Moved from different county within same state (%) - Hispanic or Latino
Geographical mobility - Moved from different county within same state (%) - American Indian and Alaska Native
Geographical mobility - Moved from different county within same state (%) - Multirace
Geographical mobility - Moved from different county within same state (%) - Other Race
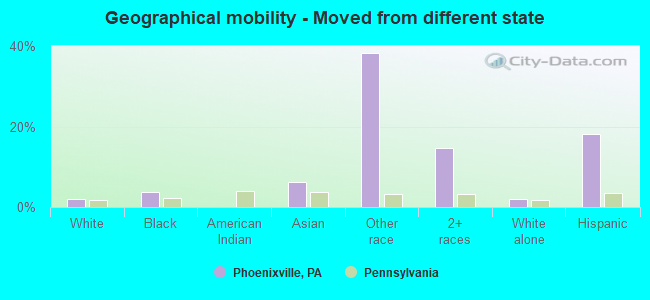
Geographical mobility - Moved from different state (%)
Geographical mobility - Moved from different state (%) - White
Geographical mobility - Moved from different state (%) - Black or African American
Geographical mobility - Moved from different state (%) - Asian
Geographical mobility - Moved from different state (%) - Hispanic or Latino
Geographical mobility - Moved from different state (%) - American Indian and Alaska Native
Geographical mobility - Moved from different state (%) - Multirace
Geographical mobility - Moved from different state (%) - Other Race
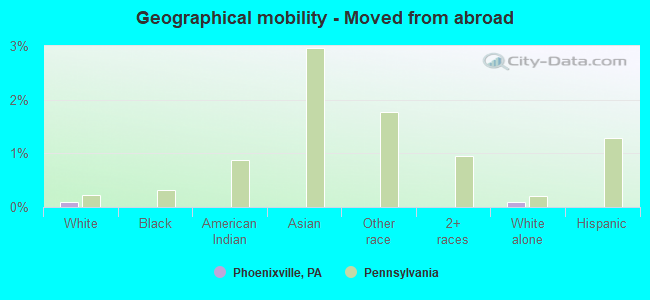
Geographical mobility - Moved from abroad (%)
Geographical mobility - Moved from abroad (%) - White
Geographical mobility - Moved from abroad (%) - Black or African American
Geographical mobility - Moved from abroad (%) - Asian
Geographical mobility - Moved from abroad (%) - Hispanic or Latino
Geographical mobility - Moved from abroad (%) - American Indian and Alaska Native
Geographical mobility - Moved from abroad (%) - Multirace
Geographical mobility - Moved from abroad (%) - Other Race
Place of birth for the foreign-born population - Ireland (%)
Place of birth for the foreign-born population - Denmark (%)
Place of birth for the foreign-born population - Norway (%)
Place of birth for the foreign-born population - Sweden (%)
Place of birth for the foreign-born population - United Kingdom (%)
Place of birth for the foreign-born population - England (%)
Place of birth for the foreign-born population - Scotland (%)
Place of birth for the foreign-born population - Other Northern Europe (%)
Place of birth for the foreign-born population - Austria (%)
Place of birth for the foreign-born population - Belgium (%)
Place of birth for the foreign-born population - France (%)
Place of birth for the foreign-born population - Germany (%)
Place of birth for the foreign-born population - Netherlands (%)
Place of birth for the foreign-born population - Switzerland (%)
Place of birth for the foreign-born population - Other Western Europe (%)
Place of birth for the foreign-born population - Greece (%)
Place of birth for the foreign-born population - Italy (%)
Place of birth for the foreign-born population - Portugal (%)
Place of birth for the foreign-born population - Spain (%)
Place of birth for the foreign-born population - Other Southern Europe (%)
Place of birth for the foreign-born population - Albania (%)
Place of birth for the foreign-born population - Belarus (%)
Place of birth for the foreign-born population - Bosnia and Herzegovina (%)
Place of birth for the foreign-born population - Bulgaria (%)
Place of birth for the foreign-born population - Croatia (%)
Place of birth for the foreign-born population - Czechoslovakia (%)
Place of birth for the foreign-born population - Hungary (%)
Place of birth for the foreign-born population - Latvia (%)
Place of birth for the foreign-born population - Lithuania (%)
Place of birth for the foreign-born population - North Macedonia (Macedonia) (%)
Place of birth for the foreign-born population - Moldova (%)
Place of birth for the foreign-born population - Poland (%)
Place of birth for the foreign-born population - Romania (%)
Place of birth for the foreign-born population - Russia (%)
Place of birth for the foreign-born population - Serbia (%)
Place of birth for the foreign-born population - Ukraine (%)
Place of birth for the foreign-born population - Other Eastern Europe (%)
Place of birth for the foreign-born population - China (%)
Place of birth for the foreign-born population - Hong Kong (%)
Place of birth for the foreign-born population - Taiwan (%)
Place of birth for the foreign-born population - Japan (%)
Place of birth for the foreign-born population - Korea (%)
Place of birth for the foreign-born population - Other Eastern Asia (%)
Place of birth for the foreign-born population - Afghanistan (%)
Place of birth for the foreign-born population - Bangladesh (%)
Place of birth for the foreign-born population - India (%)
Place of birth for the foreign-born population - Iran (%)
Place of birth for the foreign-born population - Kazakhstan (%)
Place of birth for the foreign-born population - Nepal (%)
Place of birth for the foreign-born population - Pakistan (%)
Place of birth for the foreign-born population - Sri Lanka (%)
Place of birth for the foreign-born population - Uzbekistan (%)
Place of birth for the foreign-born population - Other South Central Asia (%)
Place of birth for the foreign-born population - Burma (%)
Place of birth for the foreign-born population - Cambodia (%)
Place of birth for the foreign-born population - Indonesia (%)
Place of birth for the foreign-born population - Laos (%)
Place of birth for the foreign-born population - Malaysia (%)
Place of birth for the foreign-born population - Philippines (%)
Place of birth for the foreign-born population - Singapore (%)
Place of birth for the foreign-born population - Thailand (%)
Place of birth for the foreign-born population - Vietnam (%)
Place of birth for the foreign-born population - Other South Eastern Asia (%)
Place of birth for the foreign-born population - Armenia (%)
Place of birth for the foreign-born population - Iraq (%)
Place of birth for the foreign-born population - Israel (%)
Place of birth for the foreign-born population - Jordan (%)
Place of birth for the foreign-born population - Kuwait (%)
Place of birth for the foreign-born population - Lebanon (%)
Place of birth for the foreign-born population - Saudi Arabia (%)
Place of birth for the foreign-born population - Syria (%)
Place of birth for the foreign-born population - Turkey (%)
Place of birth for the foreign-born population - Yemen (%)
Place of birth for the foreign-born population - Other Western Asia (%)
Place of birth for the foreign-born population - Eritrea (%)
Place of birth for the foreign-born population - Ethiopia (%)
Place of birth for the foreign-born population - Kenya (%)
Place of birth for the foreign-born population - Somalia (%)
Place of birth for the foreign-born population - Uganda (%)
Place of birth for the foreign-born population - Zimbabwe (%)
Place of birth for the foreign-born population - Other Eastern Africa (%)
Place of birth for the foreign-born population - Cameroon (%)
Place of birth for the foreign-born population - Congo (%)
Place of birth for the foreign-born population - Democratic Republic of Congo (Zaire) (%)
Place of birth for the foreign-born population - Other Middle Africa (%)
Place of birth for the foreign-born population - Egypt (%)
Place of birth for the foreign-born population - Morocco (%)
Place of birth for the foreign-born population - Sudan (%)
Place of birth for the foreign-born population - Other Northern Africa (%)
Place of birth for the foreign-born population - South Africa (%)
Place of birth for the foreign-born population - Other Southern Africa (%)
Place of birth for the foreign-born population - Cabo Verde (%)
Place of birth for the foreign-born population - Ghana (%)
Place of birth for the foreign-born population - Liberia (%)
Place of birth for the foreign-born population - Nigeria (%)
Place of birth for the foreign-born population - Senegal (%)
Place of birth for the foreign-born population - Sierra Leone (%)
Place of birth for the foreign-born population - Other Western Africa (%)
Place of birth for the foreign-born population - Australia (%)
Place of birth for the foreign-born population - New Zealand (%)
Place of birth for the foreign-born population - Fiji (%)
Place of birth for the foreign-born population - Micronesia (%)
Place of birth for the foreign-born population - Bahamas (%)
Place of birth for the foreign-born population - Barbados (%)
Place of birth for the foreign-born population - Cuba (%)
Place of birth for the foreign-born population - Dominica (%)
Place of birth for the foreign-born population - Dominican Republic (%)
Place of birth for the foreign-born population - Grenada (%)
Place of birth for the foreign-born population - Haiti (%)
Place of birth for the foreign-born population - Jamaica (%)
Place of birth for the foreign-born population - St. Vincent and the Grenadines (%)
Place of birth for the foreign-born population - Trinidad and Tobago (%)
Place of birth for the foreign-born population - West Indies (%)
Place of birth for the foreign-born population - Other Caribbean (%)
Place of birth for the foreign-born population - Belize (%)
Place of birth for the foreign-born population - Costa Rica (%)
Place of birth for the foreign-born population - El Salvador (%)
Place of birth for the foreign-born population - Guatemala (%)
Place of birth for the foreign-born population - Honduras (%)
Place of birth for the foreign-born population - Mexico (%)
Place of birth for the foreign-born population - Nicaragua (%)
Place of birth for the foreign-born population - Panama (%)
Place of birth for the foreign-born population - Other Central America (%)
Place of birth for the foreign-born population - Argentina (%)
Place of birth for the foreign-born population - Bolivia (%)
Place of birth for the foreign-born population - Brazil (%)
Place of birth for the foreign-born population - Chile (%)
Place of birth for the foreign-born population - Colombia (%)
Place of birth for the foreign-born population - Ecuador (%)
Place of birth for the foreign-born population - Guyana (%)
Place of birth for the foreign-born population - Peru (%)
Place of birth for the foreign-born population - Uruguay (%)
Place of birth for the foreign-born population - Venezuela (%)
Place of birth for the foreign-born population - Other South America (%)
Place of birth for the foreign-born population - Canada (%)
Place of birth for the foreign-born population - Other Northern America (%)
Place of birth for the foreign-born population - Other (%)
Latest news about races in Phoenixville, PA collected exclusively by city-data.com from local newspapers, TV, and radio stations
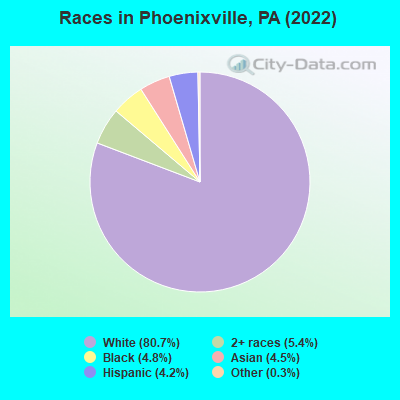
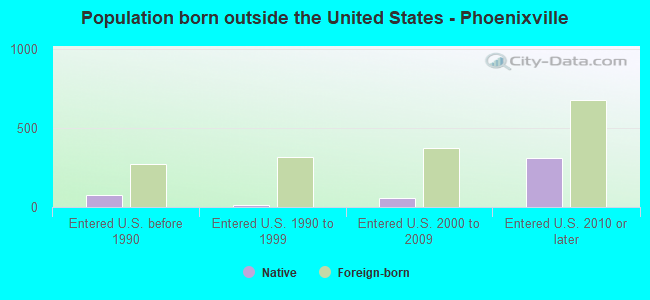
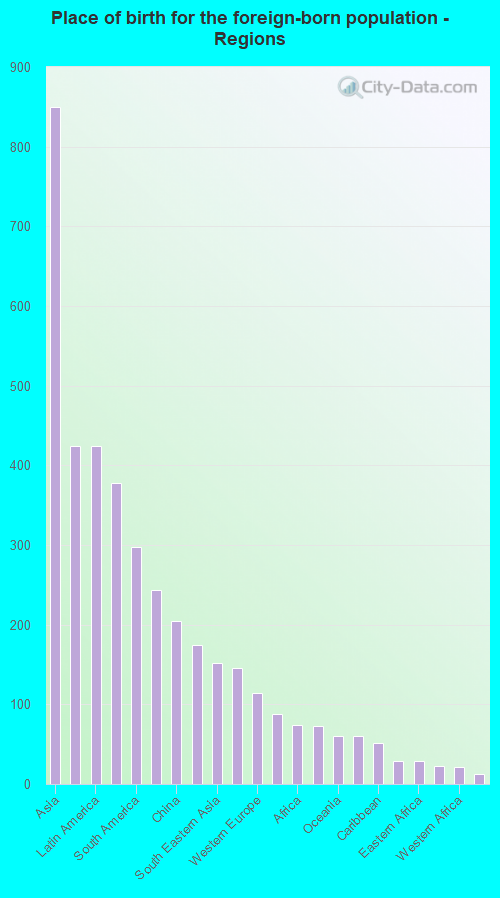
According to 2022 data, the most numerous races in Phoenixville, PA are White alone (15,368 residents), Black alone (913 residents), and Hispanic (793 residents). 88.3% of Phoenixville residents speak English at home. 8.7% of Phoenixville, PA residents are foreign-born (4.4% born in Asia, 2.2% born in Latin America, 1.3% born in Europe), which is 19.4% greater than the foreign-born rate of 7.0% across the entire state of Pennsylvania.
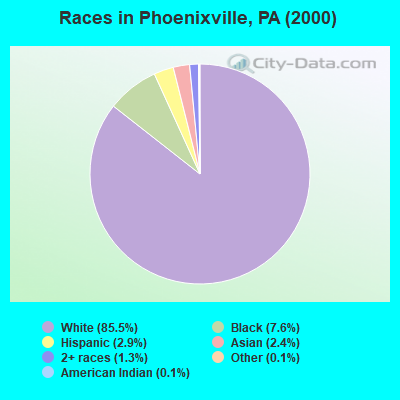
Race distribution in Phoenixville
2000 2022
10,322,455 84.1% White alone 1,202,437 9.8% Black alone 394,088 3.2% Hispanic 218,296 1.8% Asian alone 113,097 0.9% Two or more races 13,086 0.1% Other race alone 14,904 0.1% American Indian alone 2,691 0.02% Native Hawaiian and Other
9,487,228 73.1% White alone 1,311,581 10.1% Black alone 1,115,997 8.6% Hispanic 493,942 3.8% Two or more races 487,124 3.8% Asian alone 63,582 0.5% Other race alone 10,130 0.08% American Indian alone 2,424 0.02% Native Hawaiian and Other
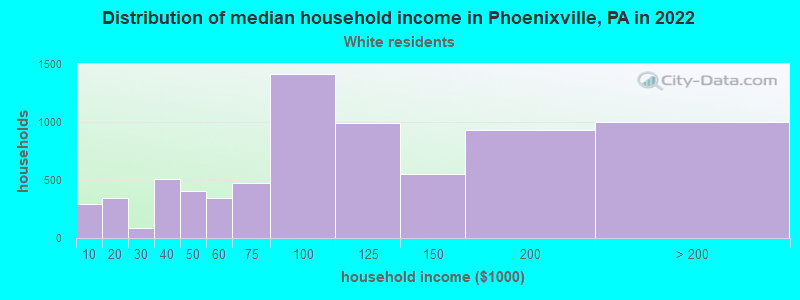
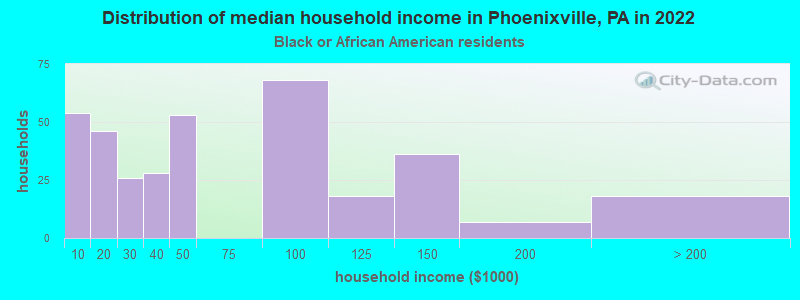
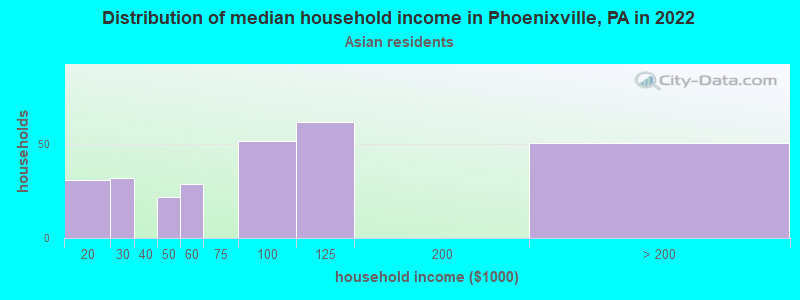
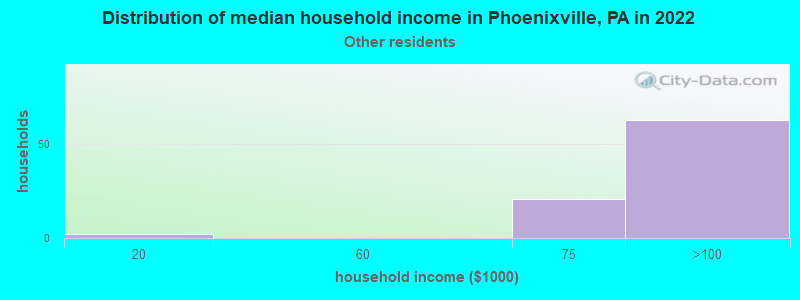
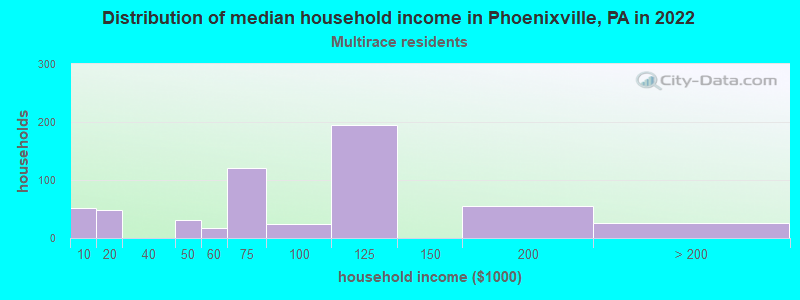
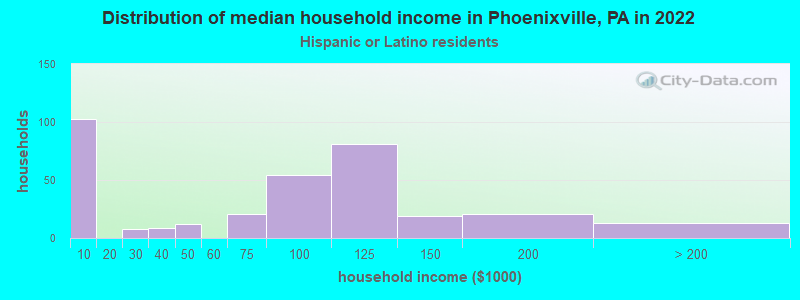
Income and house value in Phoenixville Median household income in 2022 $93,922 White non-Hispanic householders$100,359 Asian householders$85,599 Some other race householders$81,550 Two or more races householders$84,723 Hispanic or Latino race householdersMedian 2022 house value $343,899 White Non-Hispanic householders$272,567 Black or African American householders $374,003 Asian householders$323,939 Some other race householders$449,916 Two or more races householders$321,976 Hispanic or Latino householders
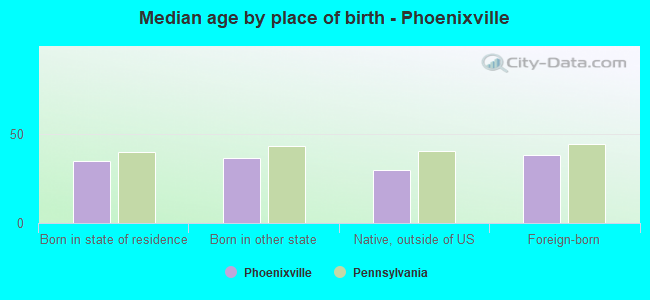
Median age by race in Phoenixville
35.6 Median age for White residents34.8 36.2 44.8 Median age for Black or African American residents50.1 30.6 -591,549,295.2 Median age for American Indian / Alaska Native residents-596,491,227.5 -593,055,555.0 42.3 Median age for Asian residents45.7 36.6 -596,045,197.1 Median age for Native Hawaiian / Pacific Islander residents-665,394,401.4 -747,474,746.7 34.0 Median age for Other race residents29.5 50.0 28.2 Median age for Two or more races residents29.0 27.3 35.4 Median age for White alone residents34.5 36.2 29.6 Median age for Hispanic or Latino residents30.7 27.4
Owner/renter occupied households by race in Phoenixville
House owners and renters - White residents 3,864 54.4% Owner occupied3,241 45.6% Renter occupiedHouse owners and renters - Black or African American residents 82 25.2% Owner occupied245 74.8% Renter occupiedHouse owners and renters - American Indian / Alaska Native residents 11 100.0% Renter occupiedHouse owners and renters - Asian residents 157 55.2% Owner occupied127 44.8% Renter occupiedHouse owners and renters - Other race residents 32 48.4% Owner occupied34 51.6% Renter occupiedHouse owners and renters - Two or more races residents 240 40.6% Owner occupied350 59.4% Renter occupiedHouse owners and renters - White alone residents 3,861 54.0% Owner occupied3,285 46.0% Renter occupiedHouse owners and renters - Hispanic or Latino residents 168 57.4% Owner occupied125 42.6% Renter occupied
Language usage in Phoenixville
English speakers - Total 88.3% of residents of Phoenixville speak English at home.
1.6% of residents speak Spanish at home 200 67.6% Speak English very well96 32.4% Speak English less than very well10.4% of residents speak other language at home 1,050 56.4% Speak English very well813 43.6% Speak English less than very well
English speakers - Born in the United States 92.5% of residents of Phoenixville speak English at home.
2.3% of residents speak Spanish at home 88 92.6% Speak English very well7 7.4% Speak English less than very well5.2% of residents speak other language at home 214 100.0% Speak English very well
All residents speak only English at home
English speakers - Foreign-born 22.5% of residents of Phoenixville speak English at home.
7.0% of residents speak Spanish at home 29 25.9% Speak English very well83 74.1% Speak English less than very well74.7% of residents speak other language at home 434 36.5% Speak English very well756 63.5% Speak English less than very well
White (Caucasian) - Speak only English Native:
95.6% (13,254)Foreign-born:
36.1% (199)
White (Caucasian) - Speak another language Native:
4.5% (624)Foreign-born:
63.0% (348)
Black or African American - Speak only English Native:
94.5% (825)Foreign-born:
98.1% (63)
Asian - Speak only English Native:
65.0% (106)Foreign-born:
10.0% (65)
Asian - Speak another language Native:
33.0% (54)Foreign-born:
88.0% (567)
Other race - Speak another language Native:
21.8% (20)Foreign-born:
95.6% (113)
Two or more races - Speak only English Native:
95.6% (1,245)Foreign-born:
10.2% (17)
Two or more races - Speak another language Native:
2.8% (37)Foreign-born:
91.7% (153)
White alone - Speak only English Native:
95.1% (13,206)Foreign-born:
29.2% (193)
White alone - Speak another language Native:
5.3% (736)Foreign-born:
75.1% (496)
Hispanic or Latino - Speak only English Native:
98.0% (618)Foreign-born:
18.7% (23)
Hispanic or Latino - Speak another language Native:
8.3% (52)Foreign-born:
84.6% (103)
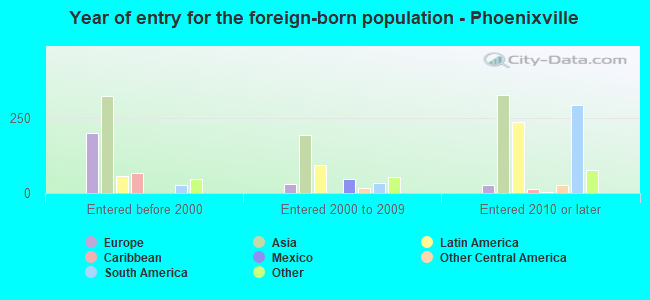
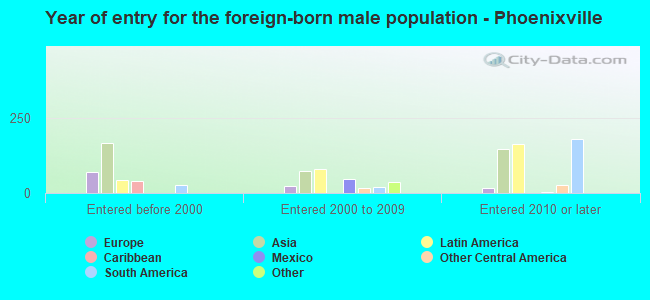
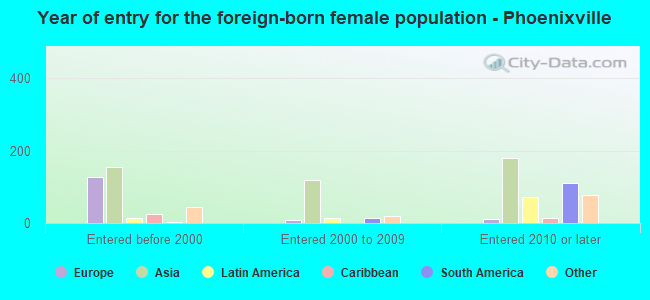
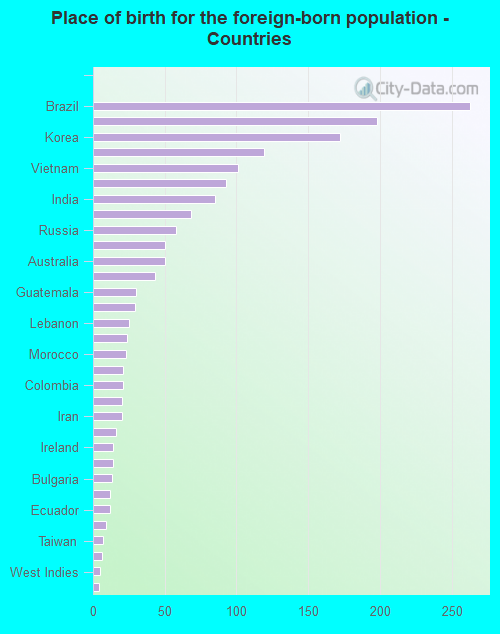
Foreign-born residents in Phoenixville 1,654 residents are foreign born (4.4% Asia , 2.2% Latin America , 1.3% Europe ).
This city:
8.7%Pennsylvania:
7.3%
Marital status for residents in Phoenixville Marital status - White (Caucasian) population 15 years and over
Males 45.4% Never married36.3% Now married1.0% Separated2.7% Widowed14.6% DivorcedFemales 36.5% Never married40.6% Now married1.3% Separated9.4% Widowed12.3% DivorcedWomen who gave birth in the past 12 months Now married:
79.3% (243)Unmarried:
20.7% (64)
Women who did not give birth in the past 12 months Now married:
38.3% (1,375)Unmarried:
61.7% (2,214)
Marital status - Black or African American population 15 years and over
Males 47.1% Never married43.4% Now married4.2% Separated0.0% Widowed5.3% DivorcedFemales 73.4% Never married12.9% Now married13.8% Separated0.0% Widowed0.0% DivorcedWomen who did not give birth in the past 12 months Now married:
36.8% (79)Unmarried:
63.2% (135)
Marital status - Asian population 15 years and over
Males 29.1% Never married70.9% Now married0.0% Separated0.0% Widowed0.0% DivorcedFemales 1.6% Never married84.5% Now married0.0% Separated0.2% Widowed13.7% DivorcedWomen who gave birth in the past 12 months Now married:
100.0% (72)Unmarried:
0.0% (0)
Women who did not give birth in the past 12 months Now married:
70.3% (172)Unmarried:
29.7% (73)
Marital status - Other race population 15 years and over
Males 75.2% Never married24.8% Now married0.0% Separated0.0% Widowed0.0% DivorcedFemales 7.7% Never married0.0% Now married0.0% Separated0.0% Widowed92.3% DivorcedWomen who did not give birth in the past 12 months Now married:
0.0% (0)Unmarried:
100.0% (29)
Marital status - Two or more races population 15 years and over
Males 67.8% Never married25.6% Now married0.0% Separated6.6% Widowed0.0% DivorcedFemales 52.2% Never married31.7% Now married0.0% Separated0.0% Widowed16.1% DivorcedWomen who gave birth in the past 12 months Now married:
100.0% (13)Unmarried:
0.0% (0)
Women who did not give birth in the past 12 months Now married:
17.8% (55)Unmarried:
82.2% (253)
Marital status - White alone, not Hispanic / Latino population 15 years and over
Males 44.7% Never married36.7% Now married1.0% Separated2.8% Widowed14.8% DivorcedFemales 36.5% Never married40.6% Now married1.3% Separated9.3% Widowed12.3% DivorcedWomen who gave birth in the past 12 months Now married:
78.7% (237)Unmarried:
21.3% (64)
Women who did not give birth in the past 12 months Now married:
38.3% (1,388)Unmarried:
61.7% (2,234)
Marital status - Hispanic or Latino population 15 years and over
Males 76.5% Never married23.5% Now married0.0% Separated0.0% Widowed0.0% DivorcedFemales 62.4% Never married13.3% Now married0.0% Separated4.9% Widowed19.4% DivorcedWomen who gave birth in the past 12 months Now married:
100.0% (8)Unmarried:
0.0% (0)
Women who did not give birth in the past 12 months Now married:
6.8% (12)Unmarried:
93.2% (165)
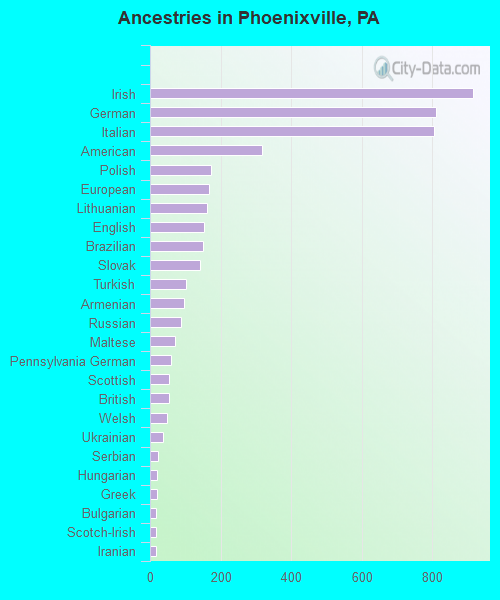
Ancestries in Phoenixville
915 12.9% Irish811 11.4% German805 11.4% Italian318 4.5% American172 2.4% Polish166 2.3% European161 2.3% Lithuanian154 2.2% English151 2.1% Brazilian143 2.0% Slovak102 1.4% Turkish95 1.3% Armenian88 1.2% Russian72 1.0% Maltese60 0.8% Pennsylvania German54 0.8% Scottish53 0.7% British49 0.7% Welsh37 0.5% Ukrainian23 0.3% Serbian19 0.3% Hungarian19 0.3% Greek18 0.3% Bulgarian18 0.3% Scotch-Irish18 0.3% Iranian17 0.2% Cape Verdean16 0.2% Jamaican15 0.2% Swedish14 0.2% Moroccan14 0.2% Eastern European14 0.2% Lebanese14 0.2% Yugoslavian12 0.2% Dutch11 0.2% Czech9 0.1% Croatian8 0.1% French8 0.1% African6 0.08% Czechoslovakian6 0.08% West Indian
Geographical mobility in Phoenixville Same house 1 year ago 12,194 81.7% White (Caucasian)896 92.6% Black or African American23 99.6% American Indian / Alaska Native840 96.5% Asian86 36.8% Other race1,115 64.9% Two or more races12,274 81.6% White alone, not Hispanic / Latino442 56.2% Hispanic or LatinoMoved within same county 1,586 10.6% White / Caucasian71 7.3% Black or African American11 1.3% Asian11 4.8% Other race262 15.3% Two or more races1,613 10.7% White alone, not Hispanic / Latino177 22.5% Hispanic or LatinoMoved within same state 823 5.5% White / Caucasian38 16.5% Other race119 6.9% Two or more races859 5.7% White alone, not Hispanic / Latino46 5.8% Hispanic or LatinoMoved from different state 311 2.1% White / Caucasian36 3.7% Black or African American53 6.1% Asian89 38.4% Other race253 14.7% Two or more races297 2.0% White alone, not Hispanic / Latino142 18.1% Hispanic or LatinoMoved from abroad 12 0.1% White13 0.1% White alone, not Hispanic / Latino
Children Nativity (place of birth) in Phoenixville
Children under 6 years - Living with two parents Both parents native 878 100.0% NativeBoth parents foreign-born 12 15.7% Native65 84.3% Foreign-bornOne native, one foreign-born parent 24 30.4% Native55 69.6% Foreign-bornChildren under 6 years - Living with one parent Native parent 266 100.0% NativeForeign-born parent 12 100.0% NativeChildren 6 to 17 years - Living with two parents Both parents native 914 99.8% Native2 0.2% Foreign-bornBoth parents foreign-born 78 73.1% Native29 26.9% Foreign-bornOne native, one foreign-born parent 146 100.0% NativeChildren 6 to 17 years - Living with one parent Native parent 697 100.0% NativeForeign-born parent 77 47.6% Native84 52.4% Foreign-born
Grandparents responsible for own grandchildren in Phoenixville
Grandparents (30 to 59 years) White / Caucasian 27 69.9% Responsible for grandchildren11 30.1% Not responsible for grandchildrenOther race 2 100.0% Responsible for grandchildrenWhite alone, not Hispanic / Latino 27 65.9% Responsible for grandchildren14 34.1% Not responsible for grandchildrenGrandparents (60 years and over) White / Caucasian 6 8.5% Responsible for grandchildren65 91.5% Not responsible for grandchildrenWhite alone, not Hispanic / Latino 6 8.4% Responsible for grandchildren68 91.6% Not responsible for grandchildren