Races in Picnic Point-North Lynnwood, Washington (WA) Detailed Stats
Ancestries, Foreign-born residents, place of birth

Discuss Picnic Point-North Lynnwood, Washington races on our local forum with over 2,400,000 registered users
16.5% of Picnic Point-North Lynnwood, WA residents are foreign-born (9.3% born in Asia, 3.1% born in Europe, 1.9% born in Latin America), which is 8.9% greater than the foreign-born rate of 15.0% across the entire state of Washington.
Race distribution in Picnic Point-North Lynnwood

- 17,67577.0%White alone
- 2,51611.0%Asian alone
- 1,0974.8%Hispanic
- 8773.8%Two or more races
- 4952.2%Black alone
- 1810.8%American Indian alone
- 710.3%Native Hawaiian and Other
Pacific Islander alone - 410.2%Other race alone
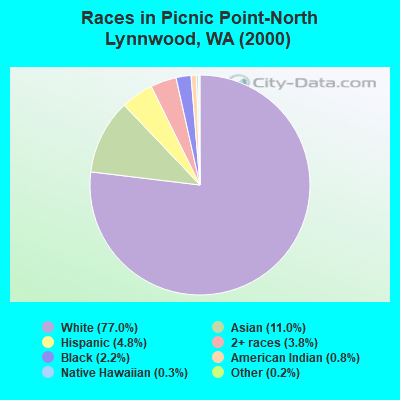
2000
2022
-
- 4,652,49078.9%White alone
- 441,5097.5%Hispanic
- 319,4015.4%Asian alone
- 184,6313.1%Black alone
- 175,9263.0%Two or more races
- 85,3961.4%American Indian alone
- 22,7790.4%Native Hawaiian and Other
Pacific Islander alone - 11,9890.2%Other race alone

-
- 4,941,45663.5%White alone
- 1,093,31314.0%Hispanic
- 755,8329.7%Asian alone
- 523,4486.7%Two or more races
- 299,5373.8%Black alone
- 69,0240.9%American Indian alone
- 52,2310.7%Native Hawaiian and Other
Pacific Islander alone - 50,9450.7%Other race alone

Income and house value in Picnic Point-North Lynnwood
- Median household income in 2022
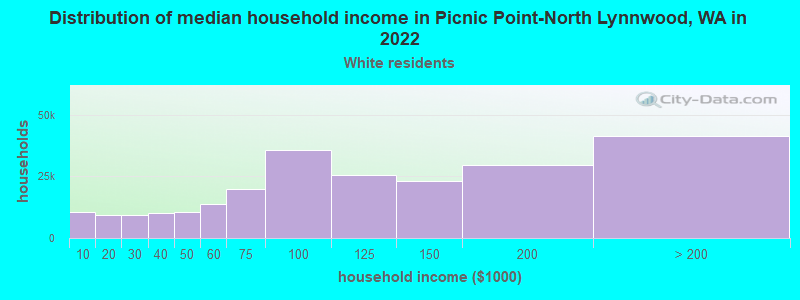
- $105,062White non-Hispanic householders
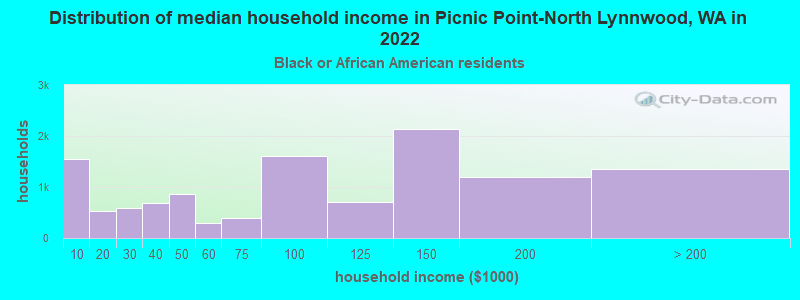
- $102,093Black householders
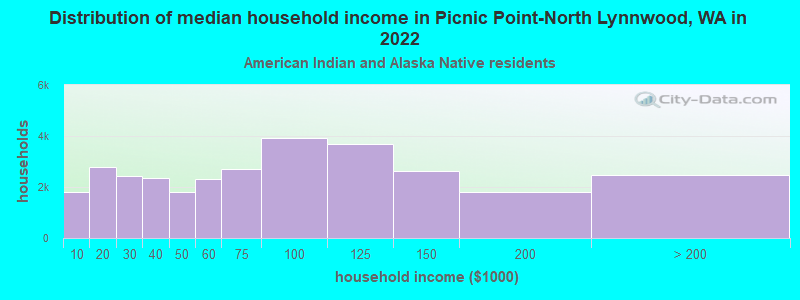
- over $200,000American Indian and Alaska Native householders
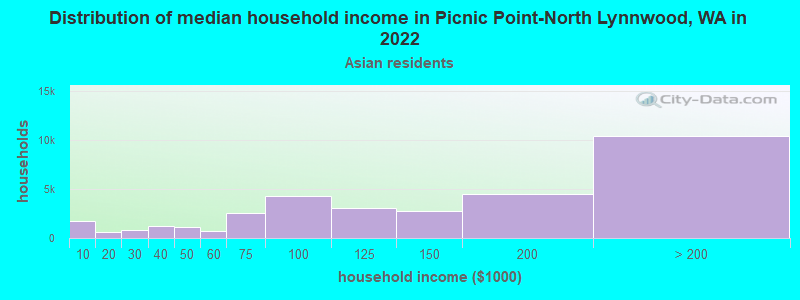
- $119,946Asian householders
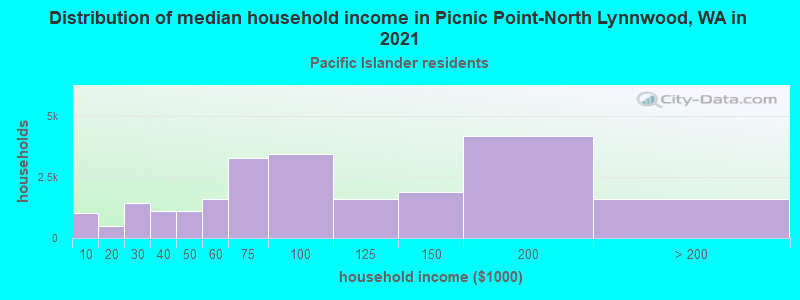
- $130,238Native Hawaiian and other Pacific Islander householders
- $85,927Some other race householders
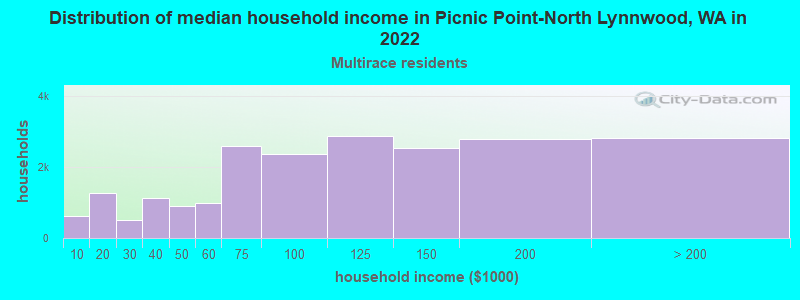
- $89,933Two or more races householders
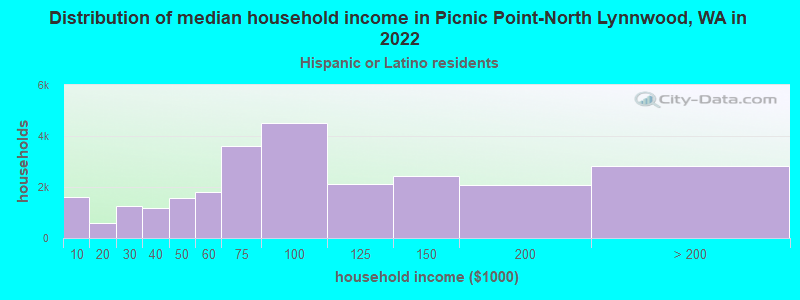
- $89,912Hispanic or Latino race householders
- Median 2022 house value
- $819,083White Non-Hispanic householders
- $799,041Black or African American householders
- $602,778American Indian or Alaska Native householders
- $806,226Asian householders
- $850,848Native Hawaiian and other Pacific Islander householders
- $633,031Some other race householders
- $854,629Two or more races householders
- $709,040Hispanic or Latino householders
Household income for White non-Hispanic householders
Household income for Black householders
Household income for American Indian and Alaska Native householders
Household income for Asian householders
Household income for Native Hawaiian and other Pacific Islander householders
Household income for Two or more races householders
Household income for Hispanic or Latino race householders
Foreign-born residents in Picnic Point-North Lynnwood
3,780 residents are foreign born (9.3% Asia, 3.1% Europe, 1.9% Latin America).
| This city: | 16.5% |
| Washington: | 10.4% |
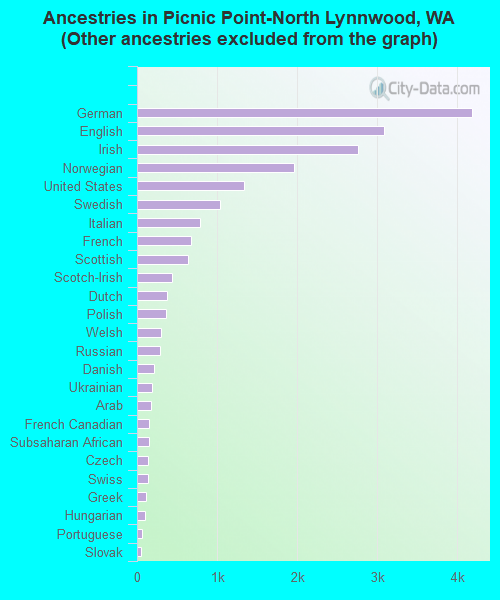
Ancestries in Picnic Point-North Lynnwood

- 6,53824.9%Other
- 4,18615.9%German
- 3,08311.7%English
- 2,75510.5%Irish
- 1,9567.5%Norwegian
- 1,3325.1%United States
- 1,0374.0%Swedish
- 7833.0%Italian
- 6792.6%French
- 6322.4%Scottish
- 4331.6%Scotch-Irish
- 3771.4%Dutch
- 3561.4%Polish
- 2981.1%Welsh
- 2931.1%Russian
- 2120.8%Danish
- 1830.7%Ukrainian
- 1740.7%Arab
- 1550.6%French Canadian
- 1470.6%Subsaharan African
- 1370.5%Czech
- 1320.5%Swiss
- 1090.4%Greek
- 1050.4%Hungarian
- 680.3%Portuguese
- 540.2%Slovak
- 310.1%Lithuanian
Zip codes: 98037.