Races in Pinecrest, Florida (FL) Detailed Stats
Data:
Races - White alone (%)
Races - White alone (% change since 2000)
Races - Black alone (%)
Races - Black alone (% change since 2000)
Races - American Indian alone (%)
Races - American Indian alone (% change since 2000)
Races - Asian alone (%)
Races - Asian alone (% change since 2000)
Races - Hispanic (%)
Races - Hispanic (% change since 2000)
Races - Native Hawaiian and Other Pacific Islander alone (%)
Races - Native Hawaiian and Other Pacific Islander alone (% change since 2000)
Races - Two or more races(%)
Races - Two or more races(% change since 2000)
Races - Other race alone (%)
Races - Other race alone (% change since 2000)
Racial diversity
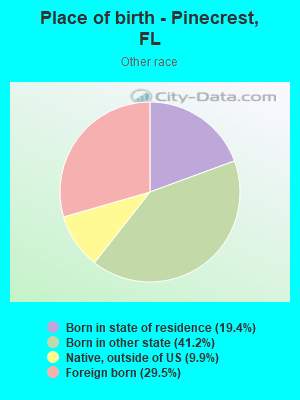
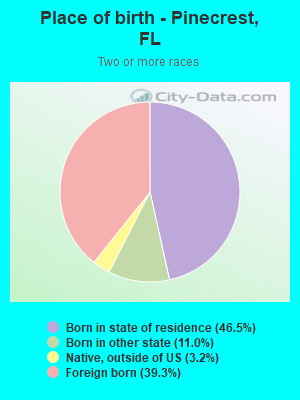
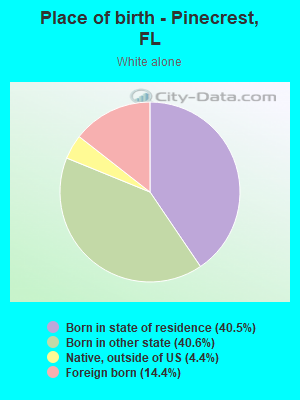
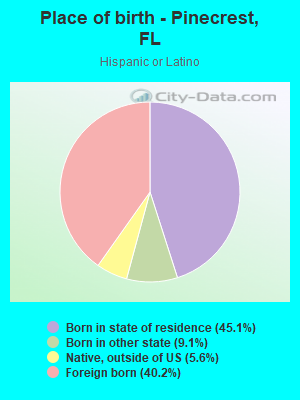
Place of birth - Born in state of residence (%)
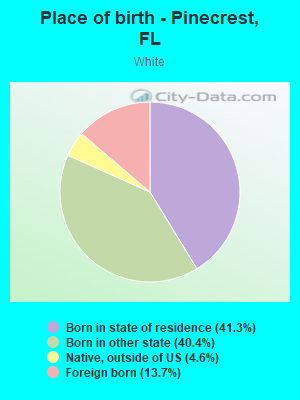
Place of birth - Born in state of residence (%) - White
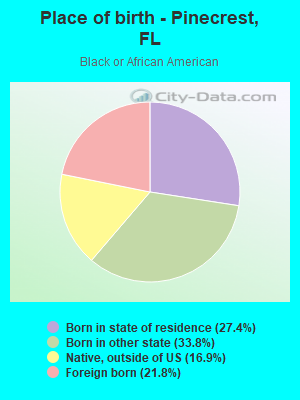
Place of birth - Born in state of residence (%) - Black or African American
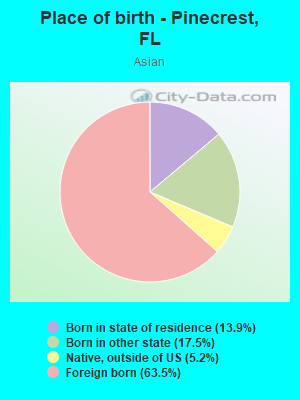
Place of birth - Born in state of residence (%) - Asian
Place of birth - Born in state of residence (%) - Hispanic or Latino
Place of birth - Born in state of residence (%) - American Indian and Alaska Native
Place of birth - Born in state of residence (%) - Multirace
Place of birth - Born in state of residence (%) - Other Race
Place of birth - Born in other state (%)
Place of birth - Born in other state (%) - White
Place of birth - Born in other state (%) - Black or African American
Place of birth - Born in other state (%) - Asian
Place of birth - Born in other state (%) - Hispanic or Latino
Place of birth - Born in other state (%) - American Indian and Alaska Native
Place of birth - Born in other state (%) - Multirace
Place of birth - Born in other state (%) - Other Race
Place of birth - Native, outside of US (%)
Place of birth - Native, outside of US (%) - White
Place of birth - Native, outside of US (%) - Black or African American
Place of birth - Native, outside of US (%) - Asian
Place of birth - Native, outside of US (%) - Hispanic or Latino
Place of birth - Native, outside of US (%) - American Indian and Alaska Native
Place of birth - Native, outside of US (%) - Multirace
Place of birth - Native, outside of US (%) - Other Race
Place of birth - Foreign born (%)
Place of birth - Foreign born (%) - White
Place of birth - Foreign born (%) - Black or African American
Place of birth - Foreign born (%) - Asian
Place of birth - Foreign born (%) - Hispanic or Latino
Place of birth - Foreign born (%) - American Indian and Alaska Native
Place of birth - Foreign born (%) - Multirace
Place of birth - Foreign born (%) - Other Race
Residents speaking English at home (%)
Residents speaking English at home - Born in the United States (%)
Residents speaking English at home - Native, born elsewhere (%)
Residents speaking English at home - Foreign born (%)
Residents speaking Spanish at home (%)
Residents speaking Spanish at home - Born in the United States (%)
Residents speaking Spanish at home - Native, born elsewhere (%)
Residents speaking Spanish at home - Foreign born (%)
Residents speaking other language at home (%)
Residents speaking other language at home - Born in the United States (%)
Residents speaking other language at home - Native, born elsewhere (%)
Residents speaking other language at home - Foreign born (%)
Marital status - Never married (%)
Marital status - Now married (%)
Marital status - Separated (%)
Marital status - Widowed (%)
Marital status - Divorced (%)
Ancestries Reported - Arab (%)
Ancestries Reported - Czech (%)
Ancestries Reported - Danish (%)
Ancestries Reported - Dutch (%)
Ancestries Reported - English (%)
Ancestries Reported - French (%)
Ancestries Reported - French Canadian (%)
Ancestries Reported - German (%)
Ancestries Reported - Greek (%)
Ancestries Reported - Hungarian (%)
Ancestries Reported - Irish (%)
Ancestries Reported - Italian (%)
Ancestries Reported - Lithuanian (%)
Ancestries Reported - Norwegian (%)
Ancestries Reported - Polish (%)
Ancestries Reported - Portuguese (%)
Ancestries Reported - Russian (%)
Ancestries Reported - Scotch-Irish (%)
Ancestries Reported - Scottish (%)
Ancestries Reported - Slovak (%)
Ancestries Reported - Subsaharan African (%)
Ancestries Reported - Swedish (%)
Ancestries Reported - Swiss (%)
Ancestries Reported - Ukrainian (%)
Ancestries Reported - United States (%)
Ancestries Reported - Welsh (%)
Ancestries Reported - West Indian (%)
Ancestries Reported - Other (%)
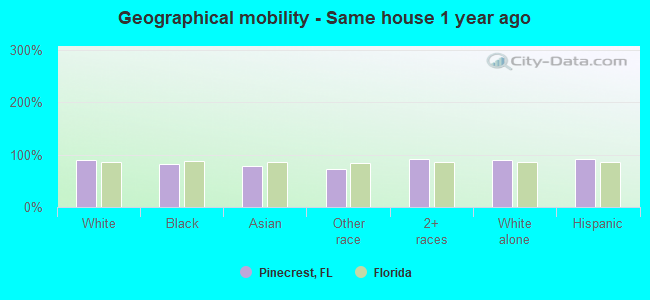
Geographical mobility - Same house 1 year ago (%)
Geographical mobility - Same house 1 year ago (%) - White
Geographical mobility - Same house 1 year ago (%) - Black or African American
Geographical mobility - Same house 1 year ago (%) - Asian
Geographical mobility - Same house 1 year ago (%) - Hispanic or Latino
Geographical mobility - Same house 1 year ago (%) - American Indian and Alaska Native
Geographical mobility - Same house 1 year ago (%) - Multirace
Geographical mobility - Same house 1 year ago (%) - Other Race
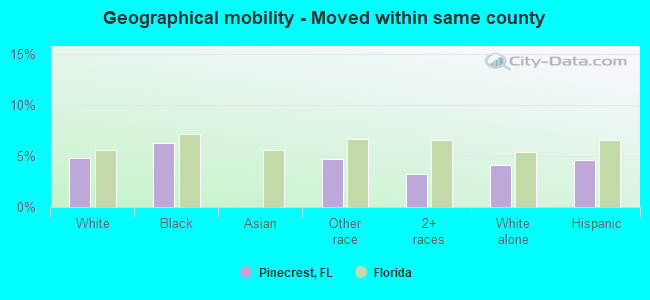
Geographical mobility - Moved within same county (%)
Geographical mobility - Moved within same county (%) - White
Geographical mobility - Moved within same county (%) - Black or African American
Geographical mobility - Moved within same county (%) - Asian
Geographical mobility - Moved within same county (%) - Hispanic or Latino
Geographical mobility - Moved within same county (%) - American Indian and Alaska Native
Geographical mobility - Moved within same county (%) - Multirace
Geographical mobility - Moved within same county (%) - Other Race
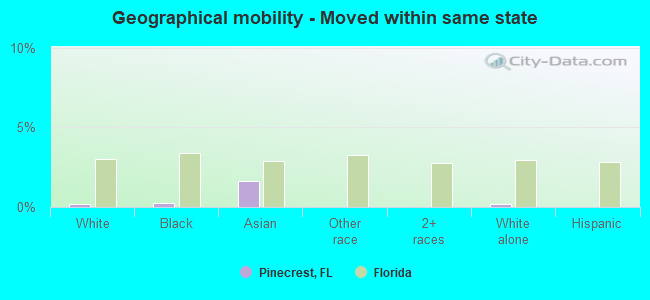
Geographical mobility - Moved from different county within same state (%)
Geographical mobility - Moved from different county within same state (%) - White
Geographical mobility - Moved from different county within same state (%) - Black or African American
Geographical mobility - Moved from different county within same state (%) - Asian
Geographical mobility - Moved from different county within same state (%) - Hispanic or Latino
Geographical mobility - Moved from different county within same state (%) - American Indian and Alaska Native
Geographical mobility - Moved from different county within same state (%) - Multirace
Geographical mobility - Moved from different county within same state (%) - Other Race
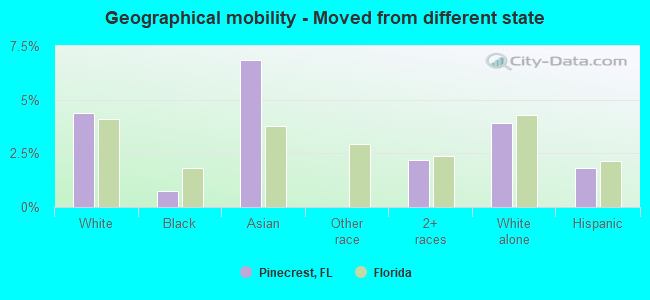
Geographical mobility - Moved from different state (%)
Geographical mobility - Moved from different state (%) - White
Geographical mobility - Moved from different state (%) - Black or African American
Geographical mobility - Moved from different state (%) - Asian
Geographical mobility - Moved from different state (%) - Hispanic or Latino
Geographical mobility - Moved from different state (%) - American Indian and Alaska Native
Geographical mobility - Moved from different state (%) - Multirace
Geographical mobility - Moved from different state (%) - Other Race
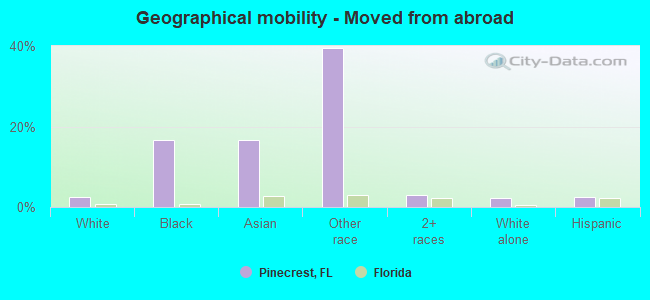
Geographical mobility - Moved from abroad (%)
Geographical mobility - Moved from abroad (%) - White
Geographical mobility - Moved from abroad (%) - Black or African American
Geographical mobility - Moved from abroad (%) - Asian
Geographical mobility - Moved from abroad (%) - Hispanic or Latino
Geographical mobility - Moved from abroad (%) - American Indian and Alaska Native
Geographical mobility - Moved from abroad (%) - Multirace
Geographical mobility - Moved from abroad (%) - Other Race
Place of birth for the foreign-born population - Ireland (%)
Place of birth for the foreign-born population - Denmark (%)
Place of birth for the foreign-born population - Norway (%)
Place of birth for the foreign-born population - Sweden (%)
Place of birth for the foreign-born population - United Kingdom (%)
Place of birth for the foreign-born population - England (%)
Place of birth for the foreign-born population - Scotland (%)
Place of birth for the foreign-born population - Other Northern Europe (%)
Place of birth for the foreign-born population - Austria (%)
Place of birth for the foreign-born population - Belgium (%)
Place of birth for the foreign-born population - France (%)
Place of birth for the foreign-born population - Germany (%)
Place of birth for the foreign-born population - Netherlands (%)
Place of birth for the foreign-born population - Switzerland (%)
Place of birth for the foreign-born population - Other Western Europe (%)
Place of birth for the foreign-born population - Greece (%)
Place of birth for the foreign-born population - Italy (%)
Place of birth for the foreign-born population - Portugal (%)
Place of birth for the foreign-born population - Spain (%)
Place of birth for the foreign-born population - Other Southern Europe (%)
Place of birth for the foreign-born population - Albania (%)
Place of birth for the foreign-born population - Belarus (%)
Place of birth for the foreign-born population - Bosnia and Herzegovina (%)
Place of birth for the foreign-born population - Bulgaria (%)
Place of birth for the foreign-born population - Croatia (%)
Place of birth for the foreign-born population - Czechoslovakia (%)
Place of birth for the foreign-born population - Hungary (%)
Place of birth for the foreign-born population - Latvia (%)
Place of birth for the foreign-born population - Lithuania (%)
Place of birth for the foreign-born population - North Macedonia (Macedonia) (%)
Place of birth for the foreign-born population - Moldova (%)
Place of birth for the foreign-born population - Poland (%)
Place of birth for the foreign-born population - Romania (%)
Place of birth for the foreign-born population - Russia (%)
Place of birth for the foreign-born population - Serbia (%)
Place of birth for the foreign-born population - Ukraine (%)
Place of birth for the foreign-born population - Other Eastern Europe (%)
Place of birth for the foreign-born population - China (%)
Place of birth for the foreign-born population - Hong Kong (%)
Place of birth for the foreign-born population - Taiwan (%)
Place of birth for the foreign-born population - Japan (%)
Place of birth for the foreign-born population - Korea (%)
Place of birth for the foreign-born population - Other Eastern Asia (%)
Place of birth for the foreign-born population - Afghanistan (%)
Place of birth for the foreign-born population - Bangladesh (%)
Place of birth for the foreign-born population - India (%)
Place of birth for the foreign-born population - Iran (%)
Place of birth for the foreign-born population - Kazakhstan (%)
Place of birth for the foreign-born population - Nepal (%)
Place of birth for the foreign-born population - Pakistan (%)
Place of birth for the foreign-born population - Sri Lanka (%)
Place of birth for the foreign-born population - Uzbekistan (%)
Place of birth for the foreign-born population - Other South Central Asia (%)
Place of birth for the foreign-born population - Burma (%)
Place of birth for the foreign-born population - Cambodia (%)
Place of birth for the foreign-born population - Indonesia (%)
Place of birth for the foreign-born population - Laos (%)
Place of birth for the foreign-born population - Malaysia (%)
Place of birth for the foreign-born population - Philippines (%)
Place of birth for the foreign-born population - Singapore (%)
Place of birth for the foreign-born population - Thailand (%)
Place of birth for the foreign-born population - Vietnam (%)
Place of birth for the foreign-born population - Other South Eastern Asia (%)
Place of birth for the foreign-born population - Armenia (%)
Place of birth for the foreign-born population - Iraq (%)
Place of birth for the foreign-born population - Israel (%)
Place of birth for the foreign-born population - Jordan (%)
Place of birth for the foreign-born population - Kuwait (%)
Place of birth for the foreign-born population - Lebanon (%)
Place of birth for the foreign-born population - Saudi Arabia (%)
Place of birth for the foreign-born population - Syria (%)
Place of birth for the foreign-born population - Turkey (%)
Place of birth for the foreign-born population - Yemen (%)
Place of birth for the foreign-born population - Other Western Asia (%)
Place of birth for the foreign-born population - Eritrea (%)
Place of birth for the foreign-born population - Ethiopia (%)
Place of birth for the foreign-born population - Kenya (%)
Place of birth for the foreign-born population - Somalia (%)
Place of birth for the foreign-born population - Uganda (%)
Place of birth for the foreign-born population - Zimbabwe (%)
Place of birth for the foreign-born population - Other Eastern Africa (%)
Place of birth for the foreign-born population - Cameroon (%)
Place of birth for the foreign-born population - Congo (%)
Place of birth for the foreign-born population - Democratic Republic of Congo (Zaire) (%)
Place of birth for the foreign-born population - Other Middle Africa (%)
Place of birth for the foreign-born population - Egypt (%)
Place of birth for the foreign-born population - Morocco (%)
Place of birth for the foreign-born population - Sudan (%)
Place of birth for the foreign-born population - Other Northern Africa (%)
Place of birth for the foreign-born population - South Africa (%)
Place of birth for the foreign-born population - Other Southern Africa (%)
Place of birth for the foreign-born population - Cabo Verde (%)
Place of birth for the foreign-born population - Ghana (%)
Place of birth for the foreign-born population - Liberia (%)
Place of birth for the foreign-born population - Nigeria (%)
Place of birth for the foreign-born population - Senegal (%)
Place of birth for the foreign-born population - Sierra Leone (%)
Place of birth for the foreign-born population - Other Western Africa (%)
Place of birth for the foreign-born population - Australia (%)
Place of birth for the foreign-born population - New Zealand (%)
Place of birth for the foreign-born population - Fiji (%)
Place of birth for the foreign-born population - Micronesia (%)
Place of birth for the foreign-born population - Bahamas (%)
Place of birth for the foreign-born population - Barbados (%)
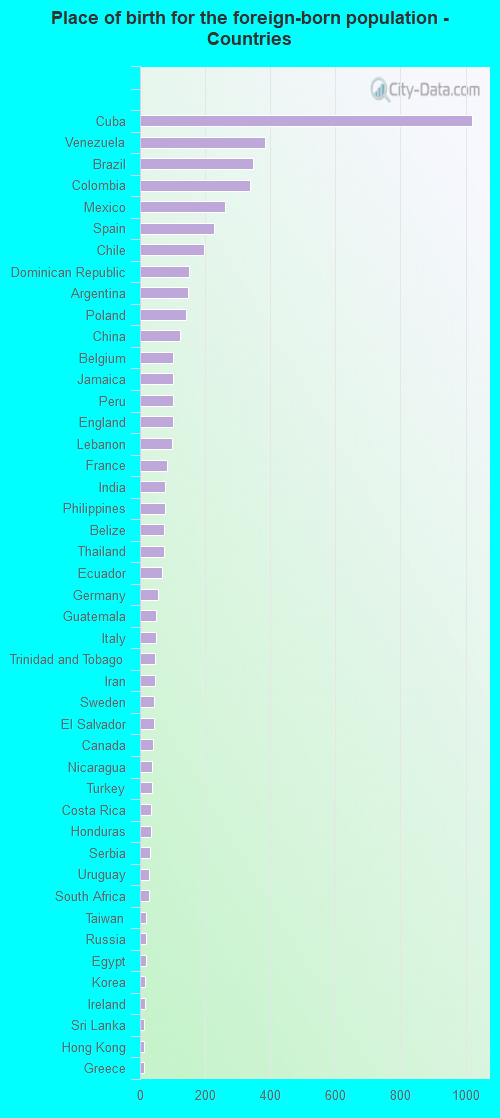
Place of birth for the foreign-born population - Cuba (%)
Place of birth for the foreign-born population - Dominica (%)
Place of birth for the foreign-born population - Dominican Republic (%)
Place of birth for the foreign-born population - Grenada (%)
Place of birth for the foreign-born population - Haiti (%)
Place of birth for the foreign-born population - Jamaica (%)
Place of birth for the foreign-born population - St. Vincent and the Grenadines (%)
Place of birth for the foreign-born population - Trinidad and Tobago (%)
Place of birth for the foreign-born population - West Indies (%)
Place of birth for the foreign-born population - Other Caribbean (%)
Place of birth for the foreign-born population - Belize (%)
Place of birth for the foreign-born population - Costa Rica (%)
Place of birth for the foreign-born population - El Salvador (%)
Place of birth for the foreign-born population - Guatemala (%)
Place of birth for the foreign-born population - Honduras (%)
Place of birth for the foreign-born population - Mexico (%)
Place of birth for the foreign-born population - Nicaragua (%)
Place of birth for the foreign-born population - Panama (%)
Place of birth for the foreign-born population - Other Central America (%)
Place of birth for the foreign-born population - Argentina (%)
Place of birth for the foreign-born population - Bolivia (%)
Place of birth for the foreign-born population - Brazil (%)
Place of birth for the foreign-born population - Chile (%)
Place of birth for the foreign-born population - Colombia (%)
Place of birth for the foreign-born population - Ecuador (%)
Place of birth for the foreign-born population - Guyana (%)
Place of birth for the foreign-born population - Peru (%)
Place of birth for the foreign-born population - Uruguay (%)
Place of birth for the foreign-born population - Venezuela (%)
Place of birth for the foreign-born population - Other South America (%)
Place of birth for the foreign-born population - Canada (%)
Place of birth for the foreign-born population - Other Northern America (%)
Place of birth for the foreign-born population - Other (%)
Latest news about races in Pinecrest, FL collected exclusively by city-data.com from local newspapers, TV, and radio stations
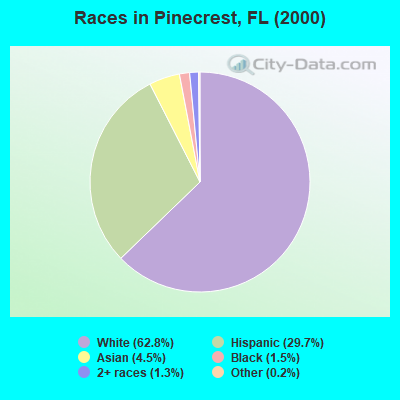
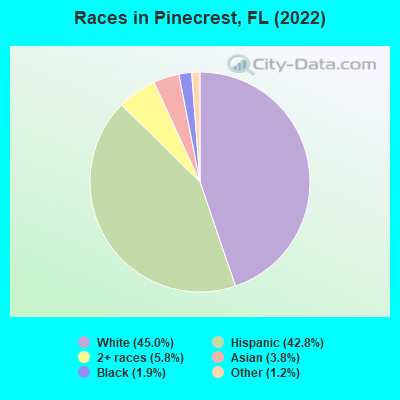
According to 2022 data, the most numerous races in Pinecrest, FL are White alone (8,178 residents), Hispanic (7,785 residents), and Black alone (345 residents). 45.9% of Pinecrest residents speak English at home. 28.6% of Pinecrest, FL residents are foreign-born (19.5% born in Latin America, 5.1% born in Europe, 3.4% born in Asia), which is 26.7% greater than the foreign-born rate of 21.0% across the entire state of Florida.
Race distribution in Pinecrest
2000 2022
10,458,509 65.4% White alone 2,682,715 16.8% Hispanic 2,264,268 14.2% Black alone 261,693 1.6% Asian alone 236,954 1.5% Two or more races 42,358 0.3% American Indian alone 28,994 0.2% Other race alone 6,887 0.04% Native Hawaiian and Other
11,309,403 50.8% White alone 6,025,039 27.1% Hispanic 3,241,015 14.6% Black alone 861,630 3.9% Two or more races 623,692 2.8% Asian alone 152,054 0.7% Other race alone 22,504 0.1% American Indian alone 9,486 0.04% Native Hawaiian and Other
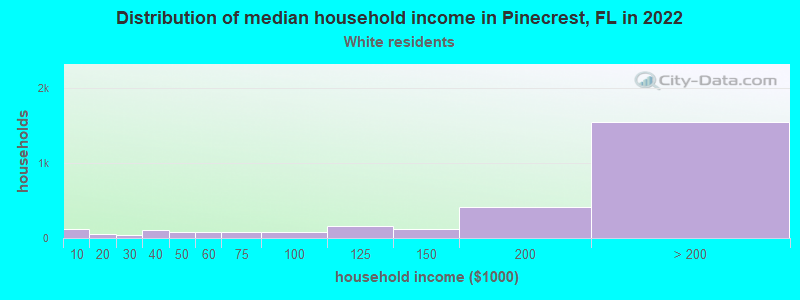
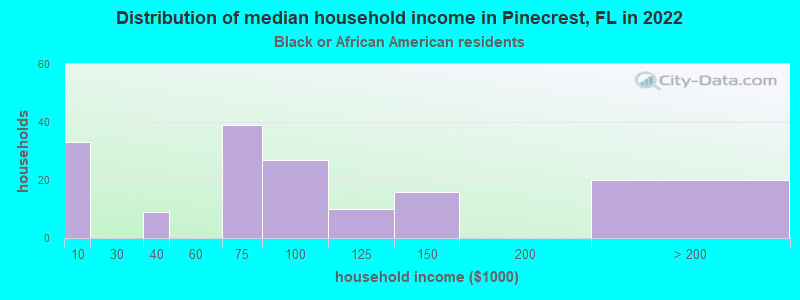
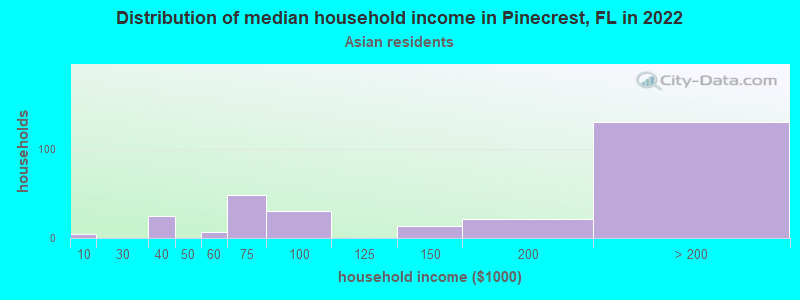
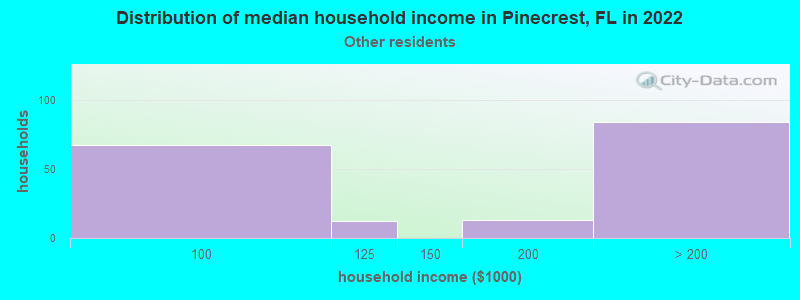
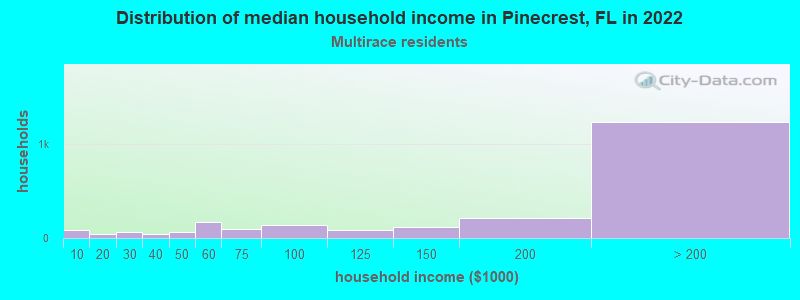
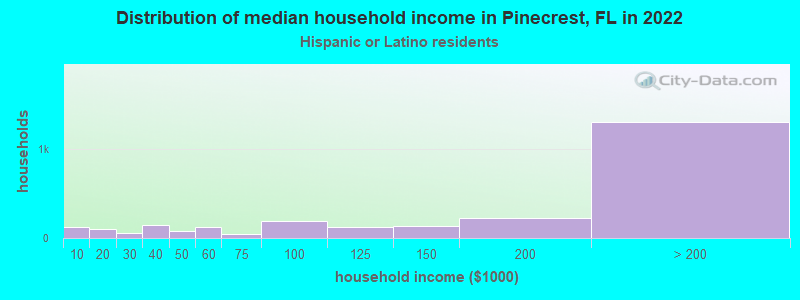
Income and house value in Pinecrest Median household income in 2022 $187,205 White non-Hispanic householders$74,036 Black householders$198,198 Asian householdersover $200,000 Two or more races householders$190,167 Hispanic or Latino race householdersMedian 2022 house value over $1,000,000 White Non-Hispanic householders$387,735 Black or African American householders $698,958 Asian householdersover $1,000,000 Some other race householdersover $1,000,000 Two or more races householdersover $1,000,000 Hispanic or Latino householders
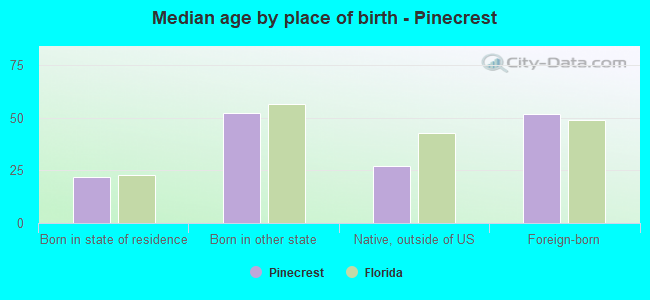
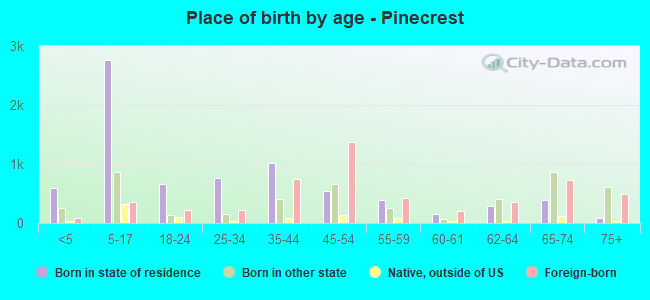
Median age by race in Pinecrest
42.7 Median age for White residents42.7 42.8 41.0 Median age for Black or African American residents40.9 45.9 -653,446,647.1 Median age for American Indian / Alaska Native residents-543,352,600.6 -762,696,213.5 48.9 Median age for Asian residents39.0 52.4 -679,849,340.2 Median age for Native Hawaiian / Pacific Islander residents-858,307,848.3 -443,298,968.6 42.1 Median age for Other race residents10.8 54.8 37.9 Median age for Two or more races residents26.3 41.9 47.5 Median age for White alone residents47.1 48.6 40.2 Median age for Hispanic or Latino residents37.1 42.4
Owner/renter occupied households by race in Pinecrest
House owners and renters - White residents 2,124 85.4% Owner occupied363 14.6% Renter occupiedHouse owners and renters - Black or African American residents 67 44.2% Owner occupied84 55.8% Renter occupiedHouse owners and renters - Asian residents 201 77.4% Owner occupied59 22.6% Renter occupiedHouse owners and renters - Other race residents 130 88.2% Owner occupied17 11.8% Renter occupiedHouse owners and renters - Two or more races residents 1,925 82.4% Owner occupied411 17.6% Renter occupiedHouse owners and renters - White alone residents 2,491 84.4% Owner occupied461 15.6% Renter occupiedHouse owners and renters - Hispanic or Latino residents 2,136 82.8% Owner occupied444 17.2% Renter occupied
Language usage in Pinecrest
English speakers - Total 45.9% of residents of Pinecrest speak English at home.
41.9% of residents speak Spanish at home 6,273 86.7% Speak English very well962 13.3% Speak English less than very well12.1% of residents speak other language at home 1,800 86.4% Speak English very well284 13.6% Speak English less than very well
English speakers - Born in the United States 77.1% of residents of Pinecrest speak English at home.
16.5% of residents speak Spanish at home 712 97.0% Speak English very well22 3.0% Speak English less than very well6.3% of residents speak other language at home 281 100.0% Speak English very well
English speakers - Native, born elsewhere 34.6% of residents of Pinecrest speak English at home.
47.8% of residents speak Spanish at home 398 97.3% Speak English very well11 2.7% Speak English less than very well18.5% of residents speak other language at home 131 82.9% Speak English very well27 17.1% Speak English less than very well
English speakers - Foreign-born 13.0% of residents of Pinecrest speak English at home.
62.6% of residents speak Spanish at home 2,377 73.9% Speak English very well838 26.1% Speak English less than very well23.9% of residents speak other language at home 979 79.9% Speak English very well247 20.1% Speak English less than very well
White (Caucasian) - Speak only English Native:
89.4% (5,768)Foreign-born:
19.4% (209)
White (Caucasian) - Speak another language Native:
22.6% (1,460)Foreign-born:
84.1% (904)
Black or African American - Speak only English Native:
68.3% (180)Foreign-born:
45.3% (36)
Black or African American - Speak another language Native:
31.6% (83)Foreign-born:
56.4% (45)
Asian - Speak only English Native:
16.4% (45)Foreign-born:
13.4% (64)
Asian - Speak another language Native:
81.5% (223)Foreign-born:
87.7% (419)
Other race - Speak only English Native:
46.0% (115)Foreign-born:
19.4% (25)
Other race - Speak another language Native:
54.2% (135)Foreign-born:
80.3% (105)
Two or more races - Speak only English Native:
25.3% (1,121)Foreign-born:
10.9% (347)
Two or more races - Speak another language Native:
74.5% (3,294)Foreign-born:
90.0% (2,858)
White alone - Speak only English Native:
84.7% (5,662)Foreign-born:
29.6% (334)
White alone - Speak another language Native:
15.9% (1,063)Foreign-born:
71.2% (805)
Hispanic or Latino - Speak only English Native:
23.5% (1,016)Foreign-born:
2.9% (90)
Hispanic or Latino - Speak another language Native:
76.8% (3,328)Foreign-born:
97.1% (3,036)
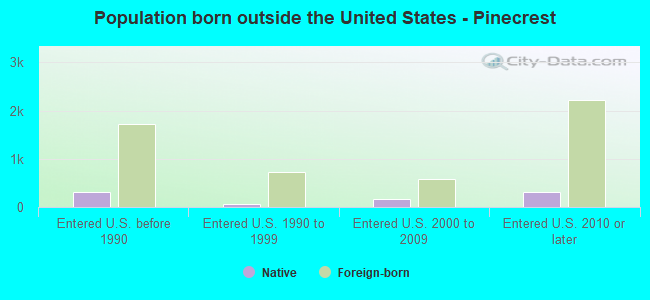
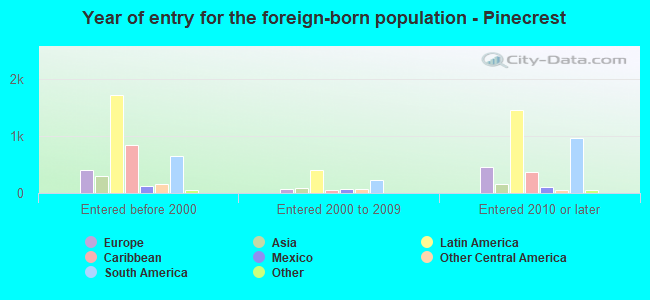
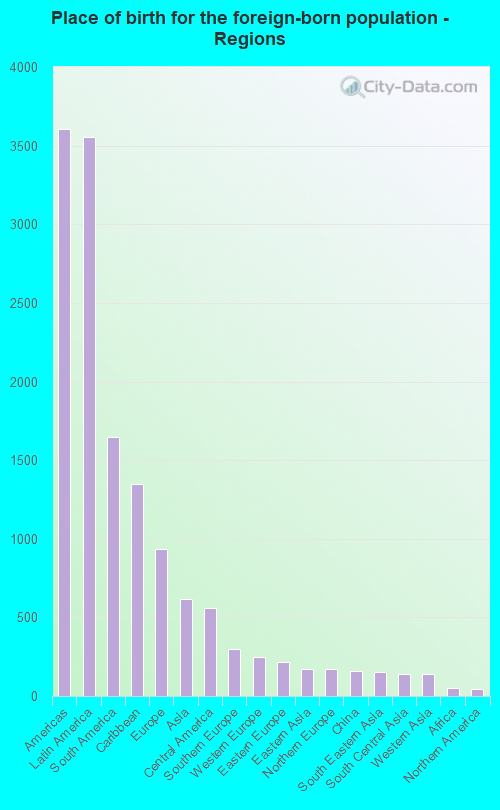
Foreign-born residents in Pinecrest 5,207 residents are foreign born (19.5% Latin America , 5.1% Europe , 3.4% Asia ).
This city:
28.6%Florida:
21.1%
Marital status for residents in Pinecrest Marital status - White (Caucasian) population 15 years and over
Males 30.8% Never married59.1% Now married0.4% Separated1.8% Widowed7.8% DivorcedFemales 25.4% Never married56.5% Now married1.5% Separated10.1% Widowed6.4% DivorcedWomen who gave birth in the past 12 months Now married:
100.0% (44)Unmarried:
0.0% (0)
Women who did not give birth in the past 12 months Now married:
44.8% (490)Unmarried:
55.2% (603)
Marital status - Black or African American population 15 years and over
Males 48.1% Never married50.6% Now married0.4% Separated0.4% Widowed0.4% DivorcedFemales 32.5% Never married67.5% Now married0.0% Separated0.0% Widowed0.0% DivorcedWomen who did not give birth in the past 12 months Now married:
27.0% (9)Unmarried:
73.0% (25)
Marital status - Asian population 15 years and over
Males 13.1% Never married86.9% Now married0.0% Separated0.0% Widowed0.0% DivorcedFemales 13.4% Never married65.9% Now married0.0% Separated20.7% Widowed0.0% DivorcedWomen who did not give birth in the past 12 months Now married:
71.4% (120)Unmarried:
28.6% (48)
Marital status - Other race population 15 years and over
Males 28.6% Never married55.7% Now married15.7% Separated0.0% Widowed0.0% DivorcedFemales 0.0% Never married77.7% Now married0.0% Separated14.6% Widowed7.7% DivorcedWomen who did not give birth in the past 12 months Now married:
70.6% (33)Unmarried:
29.4% (14)
Marital status - Two or more races population 15 years and over
Males 28.4% Never married66.5% Now married0.8% Separated2.1% Widowed2.1% DivorcedFemales 21.8% Never married66.4% Now married0.0% Separated4.3% Widowed7.5% DivorcedWomen who gave birth in the past 12 months Now married:
100.0% (83)Unmarried:
0.0% (0)
Women who did not give birth in the past 12 months Now married:
63.9% (1,070)Unmarried:
36.1% (603)
Marital status - White alone, not Hispanic / Latino population 15 years and over
Males 31.6% Never married60.1% Now married0.1% Separated2.6% Widowed5.6% DivorcedFemales 23.7% Never married58.3% Now married1.0% Separated11.2% Widowed5.8% DivorcedWomen who gave birth in the past 12 months Now married:
100.0% (62)Unmarried:
0.0% (0)
Women who did not give birth in the past 12 months Now married:
43.4% (548)Unmarried:
56.6% (715)
Marital status - Hispanic or Latino population 15 years and over
Males 26.4% Never married63.3% Now married1.4% Separated1.2% Widowed7.6% DivorcedFemales 25.4% Never married60.0% Now married1.2% Separated6.0% Widowed7.3% DivorcedWomen who gave birth in the past 12 months Now married:
100.0% (35)Unmarried:
0.0% (0)
Women who did not give birth in the past 12 months Now married:
57.1% (920)Unmarried:
42.9% (692)
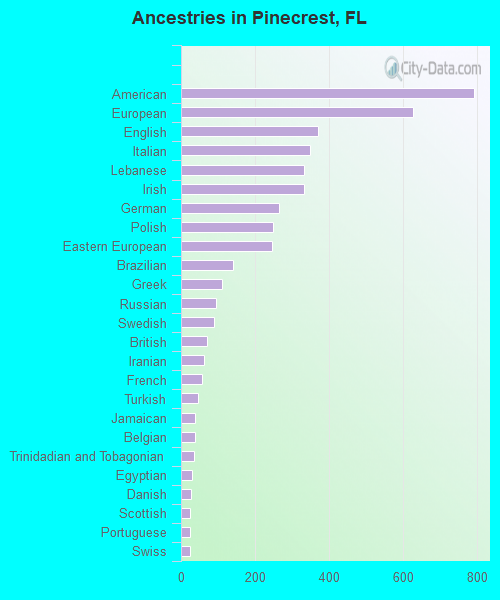
Ancestries in Pinecrest
794 8.0% American627 6.3% European370 3.7% English349 3.5% Italian333 3.4% Lebanese333 3.4% Irish266 2.7% German249 2.5% Polish246 2.5% Eastern European141 1.4% Brazilian110 1.1% Greek96 1.0% Russian88 0.9% Swedish71 0.7% British61 0.6% Iranian56 0.6% French47 0.5% Turkish39 0.4% Jamaican37 0.4% Belgian36 0.4% Trinidadian and Tobagonian31 0.3% Egyptian26 0.3% Danish25 0.3% Scottish24 0.2% Portuguese24 0.2% Swiss23 0.2% Serbian21 0.2% Hungarian21 0.2% Czech19 0.2% Ukrainian18 0.2% Dutch18 0.2% Dutch West Indian15 0.2% Lithuanian12 0.1% Haitian9 0.09% Norwegian9 0.09% Czechoslovakian8 0.08% French Canadian7 0.07% Scotch-Irish7 0.07% Moroccan7 0.07% Albanian6 0.06% Austrian5 0.05% Palestinian
Children Nativity (place of birth) in Pinecrest
Children under 6 years - Living with two parents Both parents native 419 100.0% NativeBoth parents foreign-born 212 72.8% Native79 27.2% Foreign-bornOne native, one foreign-born parent 232 100.0% NativeChildren under 6 years - Living with one parent Native parent 21 100.0% NativeForeign-born parent 46 100.0% NativeChildren 6 to 17 years - Living with two parents Both parents native 1,683 99.6% Native7 0.4% Foreign-bornBoth parents foreign-born 662 69.7% Native288 30.3% Foreign-bornOne native, one foreign-born parent 844 100.0% NativeChildren 6 to 17 years - Living with one parent Native parent 203 100.0% NativeForeign-born parent 257 54.0% Native219 46.0% Foreign-born
Grandparents responsible for own grandchildren in Pinecrest
Grandparents (30 to 59 years) White / Caucasian 15 100.0% Not responsible for grandchildrenAsian 19 100.0% Responsible for grandchildrenWhite alone, not Hispanic / Latino 8 100.0% Not responsible for grandchildrenHispanic or Latino 14 100.0% Not responsible for grandchildrenGrandparents (60 years and over) White / Caucasian 10 12.3% Responsible for grandchildren74 87.7% Not responsible for grandchildrenAsian 40 100.0% Not responsible for grandchildrenWhite alone, not Hispanic / Latino 13 15.8% Responsible for grandchildren67 84.2% Not responsible for grandchildrenHispanic or Latino 43 100.0% Not responsible for grandchildren