Races in Pitcher, New York (NY) Detailed Stats
Ancestries, Foreign-born residents, place of birth

Recent posts about races in Pitcher, New York on our local forum with over 2,400,000 registered users:
 | Possible move to Syracuse (59 replies) |
| Why is the UES so " dry" ?? (58 replies) |
| Inexpensive & great neighborhoods (16 replies) |
| My dream of moving from the South to CNY or WNY (30 replies) |
| Moving to Syracuse! (32 replies) |
| Wildwood Lanes in Riverhead (Bowling) (11 replies) |
Latest news about races in Pitcher, NY collected exclusively by city-data.com from local newspapers, TV, and radio stations
1.1% of Pitcher, NY residents are foreign-born , which is 1972.9% less than the foreign-born rate of 22.0% across the entire state of New York.
Race distribution in Pitcher

- 82997.8%White alone
- 131.5%Hispanic
- 30.4%Two or more races
- 20.2%Black alone
- 10.1%American Indian alone

2000
2022
-
- 11,760,98162.0%White alone
- 2,867,58315.1%Hispanic
- 2,812,62314.8%Black alone
- 1,035,9265.5%Asian alone
- 366,1161.9%Two or more races
- 75,4990.4%Other race alone
- 52,4990.3%American Indian alone
- 5,2300.03%Native Hawaiian and Other
Pacific Islander alone

-
- 10,408,93352.9%White alone
- 3,867,29919.7%Hispanic
- 2,633,84013.4%Black alone
- 1,776,2869.0%Asian alone
- 732,6703.7%Two or more races
- 216,1101.1%Other race alone
- 35,0820.2%American Indian alone
- 6,9310.04%Native Hawaiian and Other
Pacific Islander alone

Income and house value in Pitcher
- Median household income in 2022
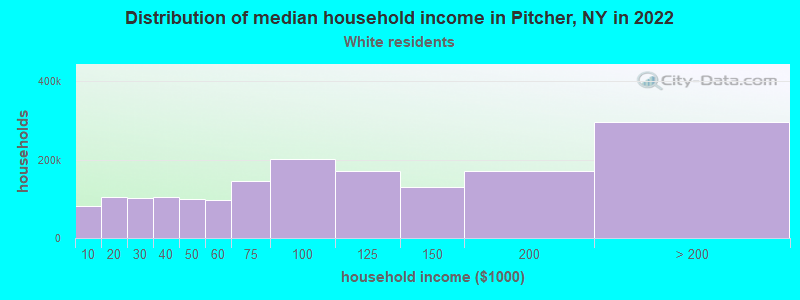
- $62,622White non-Hispanic householders
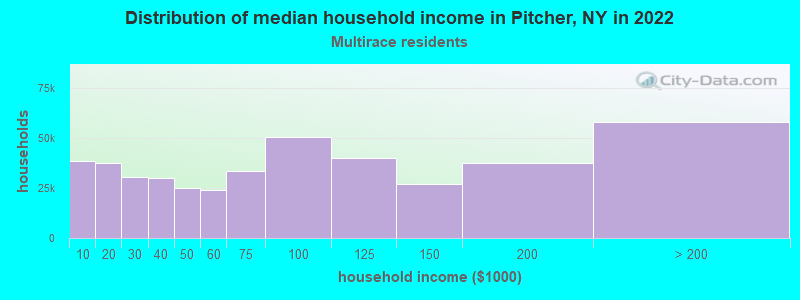
- $91,308Two or more races householders
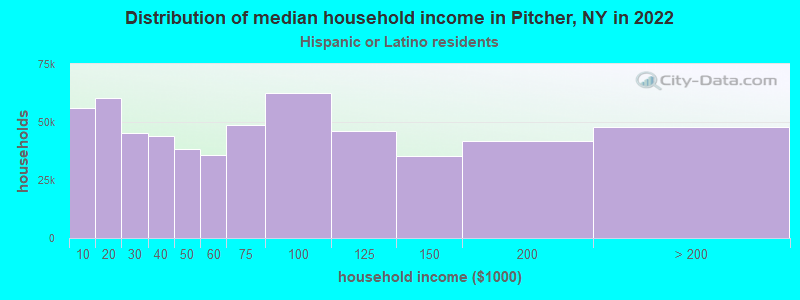
- $52,610Hispanic or Latino race householders
- Median 2022 house value
- $91,160White Non-Hispanic householders
Household income for White non-Hispanic householders
Household income for Two or more races householders
Household income for Hispanic or Latino race householders
Foreign-born residents in Pitcher
9 residents are foreign born
| This city: | 1.1% |
| New York: | 20.4% |
Ancestries in Pitcher

- 14518.6%German
- 10613.6%English
- 10213.1%Other
- 7910.2%Irish
- 749.5%Dutch
- 719.1%United States
- 546.9%Polish
- 476.0%Italian
- 354.5%French
- 202.6%French Canadian
- 182.3%Norwegian
- 131.7%Scotch-Irish
- 40.5%Lithuanian
- 40.5%Welsh
- 30.4%Hungarian
- 30.4%Scottish

Zip codes: 13136.