Races in Plainfield, Indiana (IN) Detailed Stats
Data:
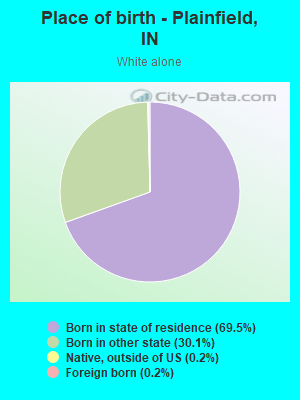
Races - White alone (%)
Races - White alone (% change since 2000)
Races - Black alone (%)
Races - Black alone (% change since 2000)
Races - American Indian alone (%)
Races - American Indian alone (% change since 2000)
Races - Asian alone (%)
Races - Asian alone (% change since 2000)
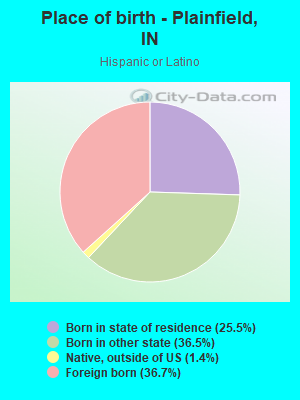
Races - Hispanic (%)
Races - Hispanic (% change since 2000)
Races - Native Hawaiian and Other Pacific Islander alone (%)
Races - Native Hawaiian and Other Pacific Islander alone (% change since 2000)
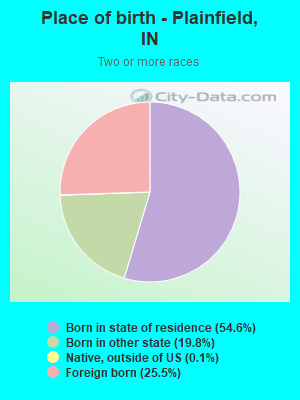
Races - Two or more races(%)
Races - Two or more races(% change since 2000)
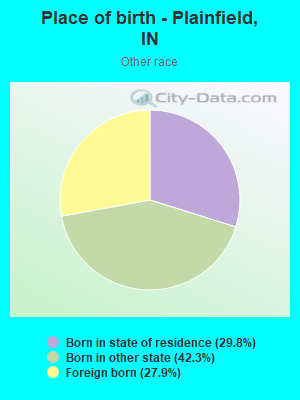
Races - Other race alone (%)
Races - Other race alone (% change since 2000)
Racial diversity
Place of birth - Born in state of residence (%)
Place of birth - Born in state of residence (%) - White
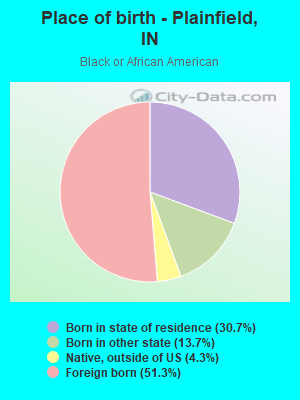
Place of birth - Born in state of residence (%) - Black or African American
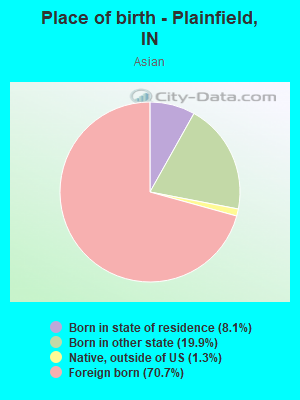
Place of birth - Born in state of residence (%) - Asian
Place of birth - Born in state of residence (%) - Hispanic or Latino
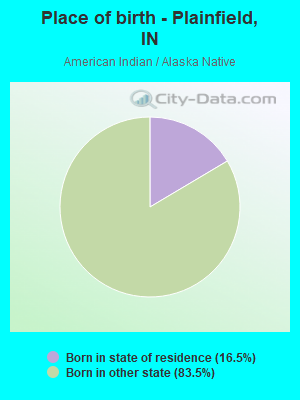
Place of birth - Born in state of residence (%) - American Indian and Alaska Native
Place of birth - Born in state of residence (%) - Multirace
Place of birth - Born in state of residence (%) - Other Race
Place of birth - Born in other state (%)
Place of birth - Born in other state (%) - White
Place of birth - Born in other state (%) - Black or African American
Place of birth - Born in other state (%) - Asian
Place of birth - Born in other state (%) - Hispanic or Latino
Place of birth - Born in other state (%) - American Indian and Alaska Native
Place of birth - Born in other state (%) - Multirace
Place of birth - Born in other state (%) - Other Race
Place of birth - Native, outside of US (%)
Place of birth - Native, outside of US (%) - White
Place of birth - Native, outside of US (%) - Black or African American
Place of birth - Native, outside of US (%) - Asian
Place of birth - Native, outside of US (%) - Hispanic or Latino
Place of birth - Native, outside of US (%) - American Indian and Alaska Native
Place of birth - Native, outside of US (%) - Multirace
Place of birth - Native, outside of US (%) - Other Race
Place of birth - Foreign born (%)
Place of birth - Foreign born (%) - White
Place of birth - Foreign born (%) - Black or African American
Place of birth - Foreign born (%) - Asian
Place of birth - Foreign born (%) - Hispanic or Latino
Place of birth - Foreign born (%) - American Indian and Alaska Native
Place of birth - Foreign born (%) - Multirace
Place of birth - Foreign born (%) - Other Race
Residents speaking English at home (%)
Residents speaking English at home - Born in the United States (%)
Residents speaking English at home - Native, born elsewhere (%)
Residents speaking English at home - Foreign born (%)
Residents speaking Spanish at home (%)
Residents speaking Spanish at home - Born in the United States (%)
Residents speaking Spanish at home - Native, born elsewhere (%)
Residents speaking Spanish at home - Foreign born (%)
Residents speaking other language at home (%)
Residents speaking other language at home - Born in the United States (%)
Residents speaking other language at home - Native, born elsewhere (%)
Residents speaking other language at home - Foreign born (%)
Marital status - Never married (%)
Marital status - Now married (%)
Marital status - Separated (%)
Marital status - Widowed (%)
Marital status - Divorced (%)
Ancestries Reported - Arab (%)
Ancestries Reported - Czech (%)
Ancestries Reported - Danish (%)
Ancestries Reported - Dutch (%)
Ancestries Reported - English (%)
Ancestries Reported - French (%)
Ancestries Reported - French Canadian (%)
Ancestries Reported - German (%)
Ancestries Reported - Greek (%)
Ancestries Reported - Hungarian (%)
Ancestries Reported - Irish (%)
Ancestries Reported - Italian (%)
Ancestries Reported - Lithuanian (%)
Ancestries Reported - Norwegian (%)
Ancestries Reported - Polish (%)
Ancestries Reported - Portuguese (%)
Ancestries Reported - Russian (%)
Ancestries Reported - Scotch-Irish (%)
Ancestries Reported - Scottish (%)
Ancestries Reported - Slovak (%)
Ancestries Reported - Subsaharan African (%)
Ancestries Reported - Swedish (%)
Ancestries Reported - Swiss (%)
Ancestries Reported - Ukrainian (%)
Ancestries Reported - United States (%)
Ancestries Reported - Welsh (%)
Ancestries Reported - West Indian (%)
Ancestries Reported - Other (%)
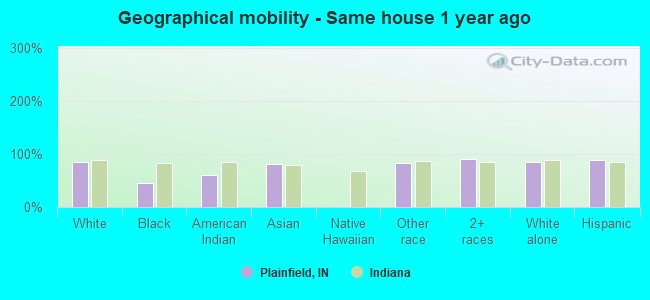
Geographical mobility - Same house 1 year ago (%)
Geographical mobility - Same house 1 year ago (%) - White
Geographical mobility - Same house 1 year ago (%) - Black or African American
Geographical mobility - Same house 1 year ago (%) - Asian
Geographical mobility - Same house 1 year ago (%) - Hispanic or Latino
Geographical mobility - Same house 1 year ago (%) - American Indian and Alaska Native
Geographical mobility - Same house 1 year ago (%) - Multirace
Geographical mobility - Same house 1 year ago (%) - Other Race
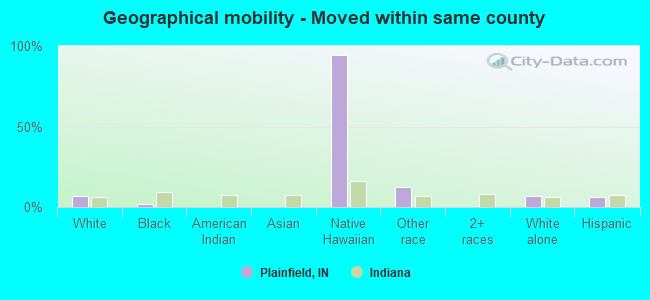
Geographical mobility - Moved within same county (%)
Geographical mobility - Moved within same county (%) - White
Geographical mobility - Moved within same county (%) - Black or African American
Geographical mobility - Moved within same county (%) - Asian
Geographical mobility - Moved within same county (%) - Hispanic or Latino
Geographical mobility - Moved within same county (%) - American Indian and Alaska Native
Geographical mobility - Moved within same county (%) - Multirace
Geographical mobility - Moved within same county (%) - Other Race
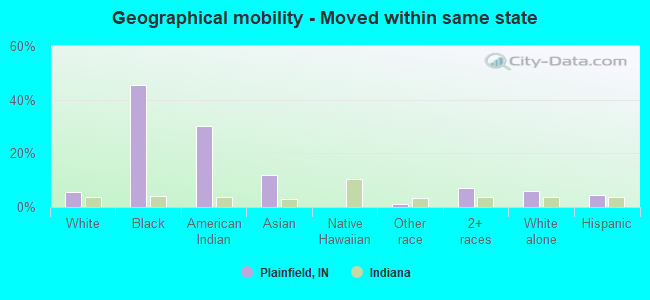
Geographical mobility - Moved from different county within same state (%)
Geographical mobility - Moved from different county within same state (%) - White
Geographical mobility - Moved from different county within same state (%) - Black or African American
Geographical mobility - Moved from different county within same state (%) - Asian
Geographical mobility - Moved from different county within same state (%) - Hispanic or Latino
Geographical mobility - Moved from different county within same state (%) - American Indian and Alaska Native
Geographical mobility - Moved from different county within same state (%) - Multirace
Geographical mobility - Moved from different county within same state (%) - Other Race
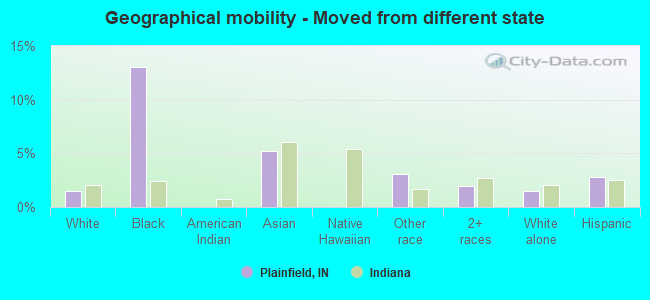
Geographical mobility - Moved from different state (%)
Geographical mobility - Moved from different state (%) - White
Geographical mobility - Moved from different state (%) - Black or African American
Geographical mobility - Moved from different state (%) - Asian
Geographical mobility - Moved from different state (%) - Hispanic or Latino
Geographical mobility - Moved from different state (%) - American Indian and Alaska Native
Geographical mobility - Moved from different state (%) - Multirace
Geographical mobility - Moved from different state (%) - Other Race
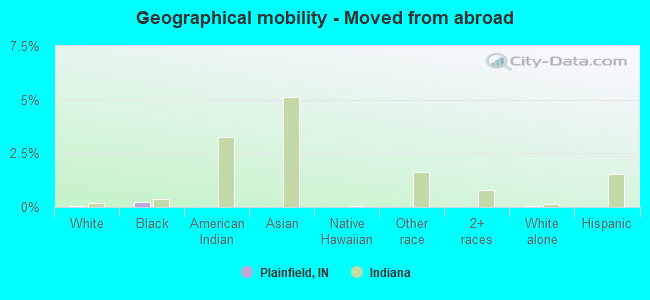
Geographical mobility - Moved from abroad (%)
Geographical mobility - Moved from abroad (%) - White
Geographical mobility - Moved from abroad (%) - Black or African American
Geographical mobility - Moved from abroad (%) - Asian
Geographical mobility - Moved from abroad (%) - Hispanic or Latino
Geographical mobility - Moved from abroad (%) - American Indian and Alaska Native
Geographical mobility - Moved from abroad (%) - Multirace
Geographical mobility - Moved from abroad (%) - Other Race
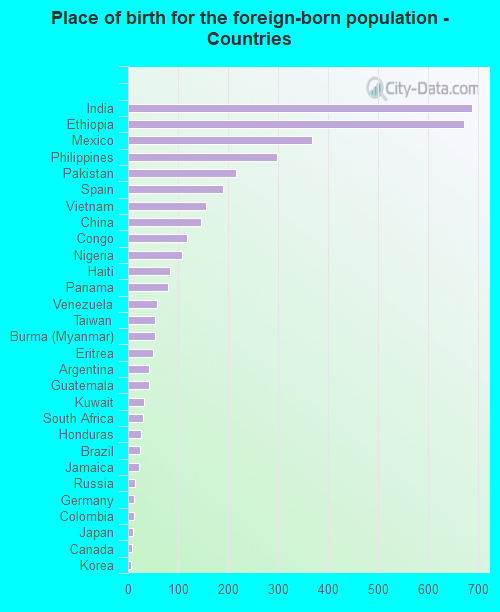
Place of birth for the foreign-born population - Ireland (%)
Place of birth for the foreign-born population - Denmark (%)
Place of birth for the foreign-born population - Norway (%)
Place of birth for the foreign-born population - Sweden (%)
Place of birth for the foreign-born population - United Kingdom (%)
Place of birth for the foreign-born population - England (%)
Place of birth for the foreign-born population - Scotland (%)
Place of birth for the foreign-born population - Other Northern Europe (%)
Place of birth for the foreign-born population - Austria (%)
Place of birth for the foreign-born population - Belgium (%)
Place of birth for the foreign-born population - France (%)
Place of birth for the foreign-born population - Germany (%)
Place of birth for the foreign-born population - Netherlands (%)
Place of birth for the foreign-born population - Switzerland (%)
Place of birth for the foreign-born population - Other Western Europe (%)
Place of birth for the foreign-born population - Greece (%)
Place of birth for the foreign-born population - Italy (%)
Place of birth for the foreign-born population - Portugal (%)
Place of birth for the foreign-born population - Spain (%)
Place of birth for the foreign-born population - Other Southern Europe (%)
Place of birth for the foreign-born population - Albania (%)
Place of birth for the foreign-born population - Belarus (%)
Place of birth for the foreign-born population - Bosnia and Herzegovina (%)
Place of birth for the foreign-born population - Bulgaria (%)
Place of birth for the foreign-born population - Croatia (%)
Place of birth for the foreign-born population - Czechoslovakia (%)
Place of birth for the foreign-born population - Hungary (%)
Place of birth for the foreign-born population - Latvia (%)
Place of birth for the foreign-born population - Lithuania (%)
Place of birth for the foreign-born population - North Macedonia (Macedonia) (%)
Place of birth for the foreign-born population - Moldova (%)
Place of birth for the foreign-born population - Poland (%)
Place of birth for the foreign-born population - Romania (%)
Place of birth for the foreign-born population - Russia (%)
Place of birth for the foreign-born population - Serbia (%)
Place of birth for the foreign-born population - Ukraine (%)
Place of birth for the foreign-born population - Other Eastern Europe (%)
Place of birth for the foreign-born population - China (%)
Place of birth for the foreign-born population - Hong Kong (%)
Place of birth for the foreign-born population - Taiwan (%)
Place of birth for the foreign-born population - Japan (%)
Place of birth for the foreign-born population - Korea (%)
Place of birth for the foreign-born population - Other Eastern Asia (%)
Place of birth for the foreign-born population - Afghanistan (%)
Place of birth for the foreign-born population - Bangladesh (%)
Place of birth for the foreign-born population - India (%)
Place of birth for the foreign-born population - Iran (%)
Place of birth for the foreign-born population - Kazakhstan (%)
Place of birth for the foreign-born population - Nepal (%)
Place of birth for the foreign-born population - Pakistan (%)
Place of birth for the foreign-born population - Sri Lanka (%)
Place of birth for the foreign-born population - Uzbekistan (%)
Place of birth for the foreign-born population - Other South Central Asia (%)
Place of birth for the foreign-born population - Burma (%)
Place of birth for the foreign-born population - Cambodia (%)
Place of birth for the foreign-born population - Indonesia (%)
Place of birth for the foreign-born population - Laos (%)
Place of birth for the foreign-born population - Malaysia (%)
Place of birth for the foreign-born population - Philippines (%)
Place of birth for the foreign-born population - Singapore (%)
Place of birth for the foreign-born population - Thailand (%)
Place of birth for the foreign-born population - Vietnam (%)
Place of birth for the foreign-born population - Other South Eastern Asia (%)
Place of birth for the foreign-born population - Armenia (%)
Place of birth for the foreign-born population - Iraq (%)
Place of birth for the foreign-born population - Israel (%)
Place of birth for the foreign-born population - Jordan (%)
Place of birth for the foreign-born population - Kuwait (%)
Place of birth for the foreign-born population - Lebanon (%)
Place of birth for the foreign-born population - Saudi Arabia (%)
Place of birth for the foreign-born population - Syria (%)
Place of birth for the foreign-born population - Turkey (%)
Place of birth for the foreign-born population - Yemen (%)
Place of birth for the foreign-born population - Other Western Asia (%)
Place of birth for the foreign-born population - Eritrea (%)
Place of birth for the foreign-born population - Ethiopia (%)
Place of birth for the foreign-born population - Kenya (%)
Place of birth for the foreign-born population - Somalia (%)
Place of birth for the foreign-born population - Uganda (%)
Place of birth for the foreign-born population - Zimbabwe (%)
Place of birth for the foreign-born population - Other Eastern Africa (%)
Place of birth for the foreign-born population - Cameroon (%)
Place of birth for the foreign-born population - Congo (%)
Place of birth for the foreign-born population - Democratic Republic of Congo (Zaire) (%)
Place of birth for the foreign-born population - Other Middle Africa (%)
Place of birth for the foreign-born population - Egypt (%)
Place of birth for the foreign-born population - Morocco (%)
Place of birth for the foreign-born population - Sudan (%)
Place of birth for the foreign-born population - Other Northern Africa (%)
Place of birth for the foreign-born population - South Africa (%)
Place of birth for the foreign-born population - Other Southern Africa (%)
Place of birth for the foreign-born population - Cabo Verde (%)
Place of birth for the foreign-born population - Ghana (%)
Place of birth for the foreign-born population - Liberia (%)
Place of birth for the foreign-born population - Nigeria (%)
Place of birth for the foreign-born population - Senegal (%)
Place of birth for the foreign-born population - Sierra Leone (%)
Place of birth for the foreign-born population - Other Western Africa (%)
Place of birth for the foreign-born population - Australia (%)
Place of birth for the foreign-born population - New Zealand (%)
Place of birth for the foreign-born population - Fiji (%)
Place of birth for the foreign-born population - Micronesia (%)
Place of birth for the foreign-born population - Bahamas (%)
Place of birth for the foreign-born population - Barbados (%)
Place of birth for the foreign-born population - Cuba (%)
Place of birth for the foreign-born population - Dominica (%)
Place of birth for the foreign-born population - Dominican Republic (%)
Place of birth for the foreign-born population - Grenada (%)
Place of birth for the foreign-born population - Haiti (%)
Place of birth for the foreign-born population - Jamaica (%)
Place of birth for the foreign-born population - St. Vincent and the Grenadines (%)
Place of birth for the foreign-born population - Trinidad and Tobago (%)
Place of birth for the foreign-born population - West Indies (%)
Place of birth for the foreign-born population - Other Caribbean (%)
Place of birth for the foreign-born population - Belize (%)
Place of birth for the foreign-born population - Costa Rica (%)
Place of birth for the foreign-born population - El Salvador (%)
Place of birth for the foreign-born population - Guatemala (%)
Place of birth for the foreign-born population - Honduras (%)
Place of birth for the foreign-born population - Mexico (%)
Place of birth for the foreign-born population - Nicaragua (%)
Place of birth for the foreign-born population - Panama (%)
Place of birth for the foreign-born population - Other Central America (%)
Place of birth for the foreign-born population - Argentina (%)
Place of birth for the foreign-born population - Bolivia (%)
Place of birth for the foreign-born population - Brazil (%)
Place of birth for the foreign-born population - Chile (%)
Place of birth for the foreign-born population - Colombia (%)
Place of birth for the foreign-born population - Ecuador (%)
Place of birth for the foreign-born population - Guyana (%)
Place of birth for the foreign-born population - Peru (%)
Place of birth for the foreign-born population - Uruguay (%)
Place of birth for the foreign-born population - Venezuela (%)
Place of birth for the foreign-born population - Other South America (%)
Place of birth for the foreign-born population - Canada (%)
Place of birth for the foreign-born population - Other Northern America (%)
Place of birth for the foreign-born population - Other (%)
Latest news about races in Plainfield, IN collected exclusively by city-data.com from local newspapers, TV, and radio stations
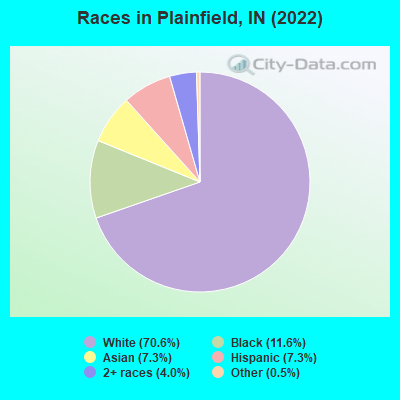
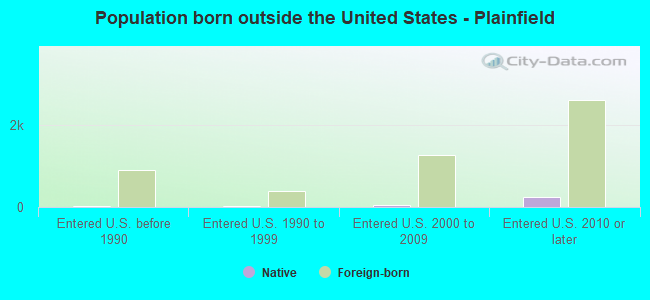
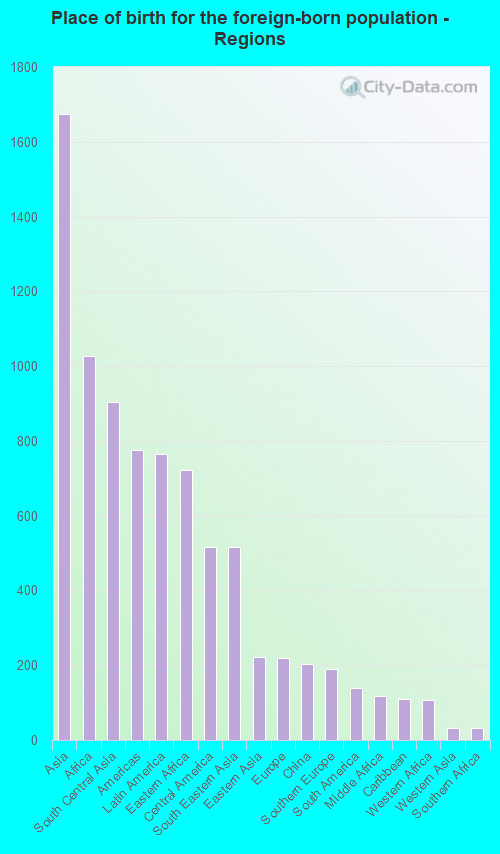
According to 2022 data, the most numerous races in Plainfield, IN are White alone (25,737 residents), Black alone (4,221 residents), and Hispanic (2,653 residents). 83.1% of Plainfield residents speak English at home. 10.1% of Plainfield, IN residents are foreign-born (4.4% born in Asia, 2.7% born in Africa, 2.0% born in Latin America), which is 40.8% greater than the foreign-born rate of 6.0% across the entire state of Indiana.
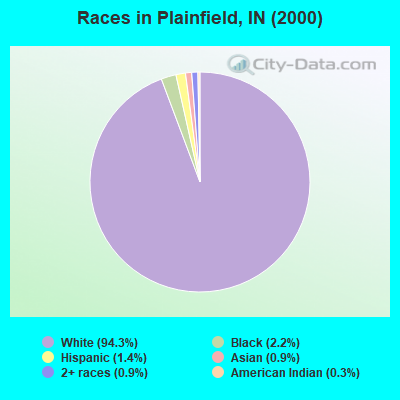
Race distribution in Plainfield
2000 2022
5,219,373 85.8% White alone 505,462 8.3% Black alone 214,536 3.5% Hispanic 61,115 1.0% Two or more races 58,424 1.0% Asian alone 13,654 0.2% American Indian alone 6,348 0.1% Other race alone 1,573 0.03% Native Hawaiian and Other
5,192,455 76.0% White alone 628,054 9.2% Black alone 534,528 7.8% Hispanic 263,242 3.9% Two or more races 172,880 2.5% Asian alone 33,467 0.5% Other race alone 5,866 0.09% American Indian alone 2,545 0.04% Native Hawaiian and Other
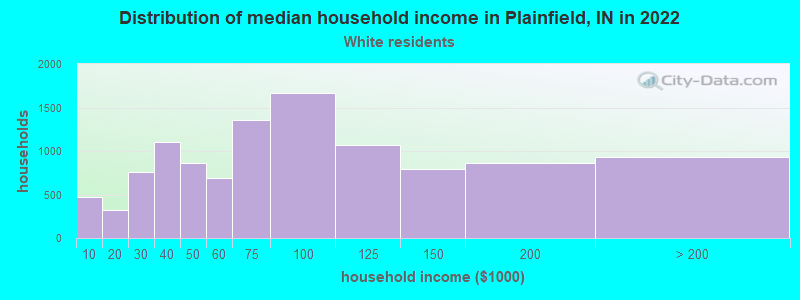
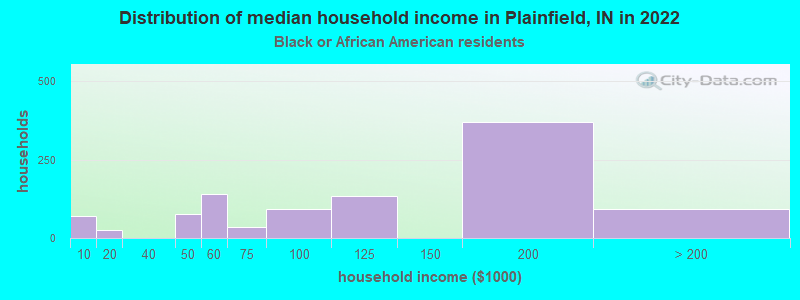
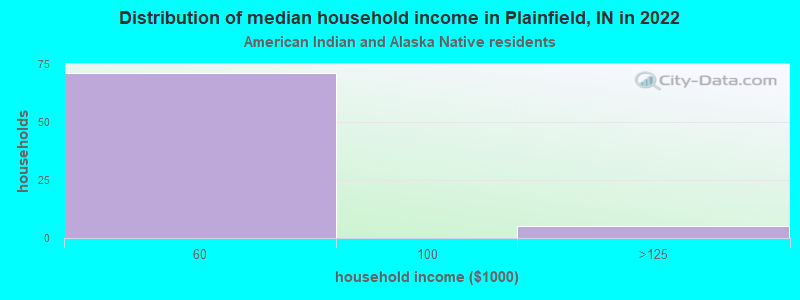
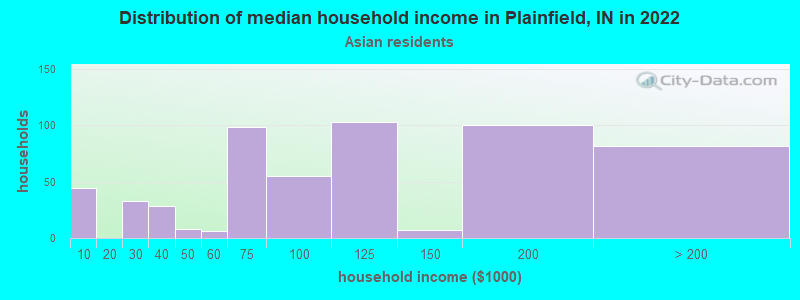
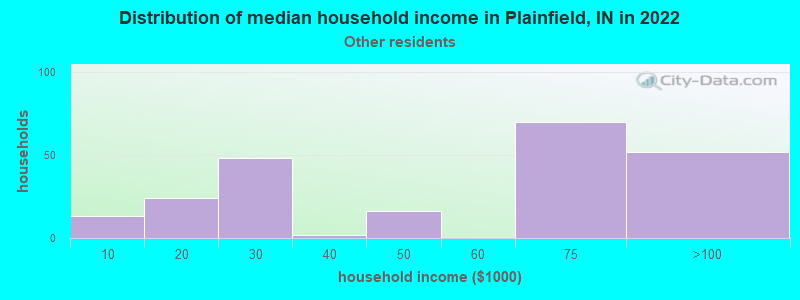
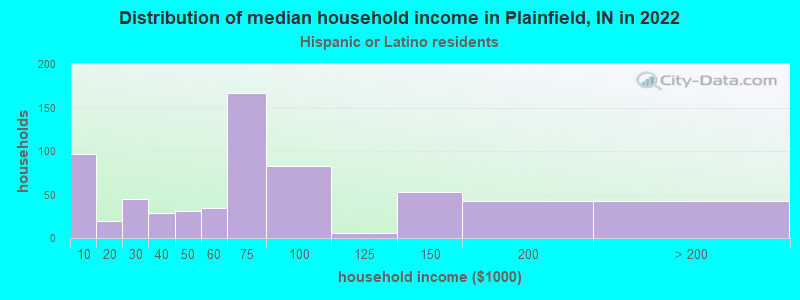
Income and house value in Plainfield Median household income in 2022 $73,978 White non-Hispanic householders$99,296 Black householders$56,919 American Indian and Alaska Native householders$129,339 Asian householders$122,060 Some other race householders$66,255 Two or more races householders$63,640 Hispanic or Latino race householdersMedian 2022 house value $273,338 White Non-Hispanic householders$190,854 Black or African American householders$356,480 American Indian or Alaska Native householders $301,637 Asian householders$120,655 Some other race householders$312,825 Two or more races householders$120,655 Hispanic or Latino householders
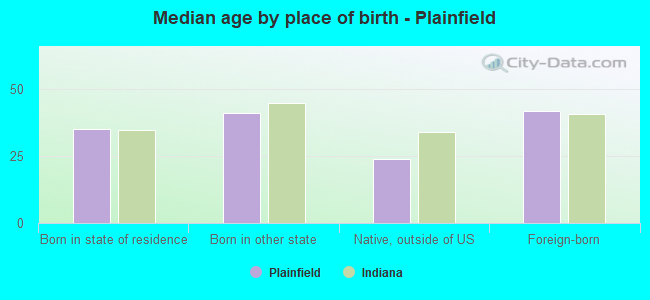
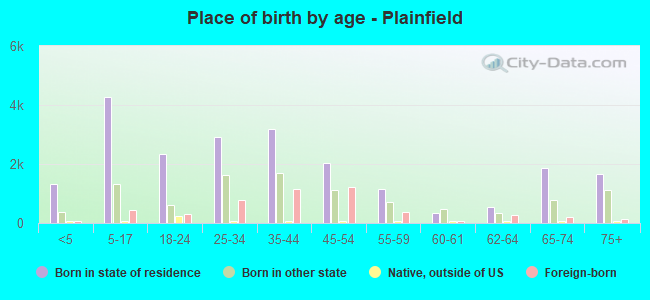
Median age by race in Plainfield
41.0 Median age for White residents39.7 42.3 39.1 Median age for Black or African American residents31.2 40.8 20.5 Median age for American Indian / Alaska Native residents23.7 18.7 28.2 Median age for Asian residents24.5 33.0 -666,666,666.0 Median age for Native Hawaiian / Pacific Islander residents-666,666,666.0 -666,666,666.0 21.3 Median age for Other race residents13.7 24.6 31.2 Median age for Two or more races residents27.0 45.1 41.1 Median age for White alone residents40.0 42.2 28.8 Median age for Hispanic or Latino residents25.3 42.7
Owner/renter occupied households by race in Plainfield
House owners and renters - White residents 7,257 68.1% Owner occupied3,392 31.9% Renter occupiedHouse owners and renters - Black or African American residents 238 23.0% Owner occupied800 77.0% Renter occupiedHouse owners and renters - American Indian / Alaska Native residents 7 11.9% Owner occupied55 88.1% Renter occupiedHouse owners and renters - Asian residents 615 86.6% Owner occupied95 13.4% Renter occupiedHouse owners and renters - Native Hawaiian / Pacific Islander residents 20 100.0% Renter occupiedHouse owners and renters - Other race residents 86 36.1% Owner occupied152 63.9% Renter occupiedHouse owners and renters - Two or more races residents 461 48.7% Owner occupied485 51.3% Renter occupiedHouse owners and renters - White alone residents 7,227 68.0% Owner occupied3,403 32.0% Renter occupiedHouse owners and renters - Hispanic or Latino residents 323 60.3% Owner occupied213 39.7% Renter occupied
Language usage in Plainfield
English speakers - Total 83.1% of residents of Plainfield speak English at home.
7.6% of residents speak Spanish at home 2,259 86.0% Speak English very well368 14.0% Speak English less than very well13.4% of residents speak other language at home 1,755 37.6% Speak English very well2,911 62.4% Speak English less than very well
English speakers - Born in the United States 91.1% of residents of Plainfield speak English at home.
7.1% of residents speak Spanish at home 678 98.0% Speak English very well14 2.0% Speak English less than very well2.3% of residents speak other language at home 208 94.5% Speak English very well12 5.5% Speak English less than very well
English speakers - Native, born elsewhere 79.3% of residents of Plainfield speak English at home.
5.6% of residents speak Spanish at home 17 100.0% Speak English very well12.1% of residents speak other language at home 37 100.0% Speak English very well
English speakers - Foreign-born 6.2% of residents of Plainfield speak English at home.
22.2% of residents speak Spanish at home 977 88.0% Speak English very well133 12.0% Speak English less than very well82.4% of residents speak other language at home 1,292 31.3% Speak English very well2,837 68.7% Speak English less than very well
White (Caucasian) - Speak only English Native:
97.9% (24,413)Foreign-born:
14.8% (17)
White (Caucasian) - Speak another language Native:
2.1% (532)Foreign-born:
68.8% (81)
Black or African American - Speak only English Native:
94.2% (1,879)Foreign-born:
9.9% (225)
Black or African American - Speak another language Native:
1.2% (25)Foreign-born:
92.0% (2,092)
Asian - Speak only English Native:
45.5% (307)Foreign-born:
4.7% (86)
Asian - Speak another language Native:
50.6% (341)Foreign-born:
96.3% (1,769)
Other race - Speak only English Native:
51.4% (267)Foreign-born:
6.4% (16)
Other race - Speak another language Native:
48.4% (252)Foreign-born:
92.6% (231)
Two or more races - Speak another language Native:
16.4% (428)Foreign-born:
100.0% (961)
White alone - Speak only English Native:
98.1% (24,276)Foreign-born:
37.0% (21)
White alone - Speak another language Native:
2.0% (489)Foreign-born:
61.7% (35)
Hispanic or Latino - Speak only English Native:
39.4% (575)Foreign-born:
1.5% (15)
Hispanic or Latino - Speak another language Native:
67.3% (983)Foreign-born:
98.5% (1,006)
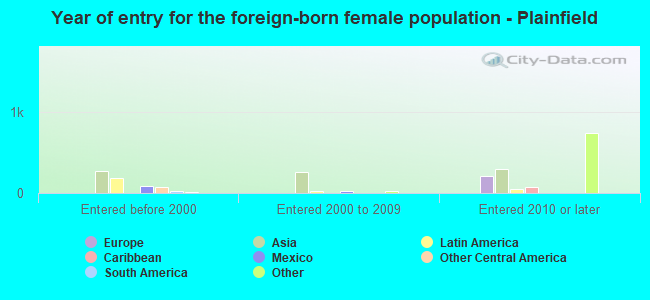
Foreign-born residents in Plainfield 3,697 residents are foreign born (4.4% Asia , 2.7% Africa , 2.0% Latin America ).
This city:
10.1%Indiana:
5.6%
Marital status for residents in Plainfield Marital status - White (Caucasian) population 15 years and over
Males 32.3% Never married51.2% Now married0.7% Separated3.2% Widowed12.6% DivorcedFemales 22.0% Never married52.0% Now married0.7% Separated9.8% Widowed15.6% DivorcedWomen who gave birth in the past 12 months Now married:
45.3% (152)Unmarried:
54.7% (184)
Women who did not give birth in the past 12 months Now married:
49.4% (2,595)Unmarried:
50.6% (2,655)
Marital status - Black or African American population 15 years and over
Males 57.0% Never married31.3% Now married0.0% Separated3.3% Widowed8.4% DivorcedFemales 26.4% Never married47.7% Now married0.0% Separated3.3% Widowed22.7% DivorcedWomen who gave birth in the past 12 months Now married:
0.0% (0)Unmarried:
100.0% (54)
Women who did not give birth in the past 12 months Now married:
49.3% (390)Unmarried:
50.7% (400)
Marital status - American Indian / Alaska Native population 15 years and over
Males 94.1% Never married0.0% Now married0.0% Separated0.0% Widowed5.9% DivorcedFemales 100.0% Never married0.0% Now married0.0% Separated0.0% Widowed0.0% DivorcedWomen who did not give birth in the past 12 months Now married:
0.0% (0)Unmarried:
100.0% (101)
Marital status - Asian population 15 years and over
Males 46.3% Never married49.4% Now married0.8% Separated2.4% Widowed1.1% DivorcedFemales 44.7% Never married41.6% Now married0.0% Separated7.0% Widowed6.7% DivorcedWomen who gave birth in the past 12 months Now married:
100.0% (57)Unmarried:
0.0% (0)
Women who did not give birth in the past 12 months Now married:
32.8% (227)Unmarried:
67.2% (465)
Marital status - Other race population 15 years and over
Males 47.4% Never married46.0% Now married0.0% Separated0.0% Widowed6.6% DivorcedFemales 14.7% Never married55.1% Now married0.0% Separated7.4% Widowed22.8% DivorcedWomen who did not give birth in the past 12 months Now married:
72.7% (136)Unmarried:
27.3% (51)
Marital status - Two or more races population 15 years and over
Males 63.7% Never married26.7% Now married0.0% Separated0.0% Widowed9.6% DivorcedFemales 24.5% Never married43.4% Now married17.7% Separated0.0% Widowed14.4% DivorcedWomen who gave birth in the past 12 months Now married:
100.0% (239)Unmarried:
0.0% (0)
Women who did not give birth in the past 12 months Now married:
27.3% (114)Unmarried:
72.7% (302)
Marital status - White alone, not Hispanic / Latino population 15 years and over
Males 32.2% Never married51.3% Now married0.3% Separated3.3% Widowed12.8% DivorcedFemales 22.2% Never married51.7% Now married0.6% Separated9.9% Widowed15.7% DivorcedWomen who gave birth in the past 12 months Now married:
45.3% (156)Unmarried:
54.7% (188)
Women who did not give birth in the past 12 months Now married:
48.7% (2,576)Unmarried:
51.3% (2,709)
Marital status - Hispanic or Latino population 15 years and over
Males 53.1% Never married34.2% Now married4.1% Separated0.0% Widowed8.6% DivorcedFemales 25.0% Never married61.7% Now married1.6% Separated2.9% Widowed8.9% DivorcedWomen who gave birth in the past 12 months Now married:
100.0% (188)Unmarried:
0.0% (0)
Women who did not give birth in the past 12 months Now married:
45.0% (156)Unmarried:
55.0% (190)
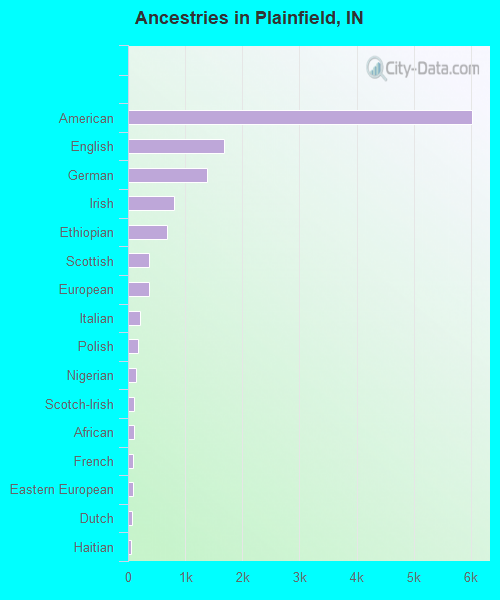
Ancestries in Plainfield
6,016 38.9% American1,685 10.9% English1,391 9.0% German810 5.2% Irish691 4.5% Ethiopian366 2.4% Scottish359 2.3% European214 1.4% Italian179 1.2% Polish143 0.9% Nigerian110 0.7% Scotch-Irish98 0.6% African96 0.6% French91 0.6% Eastern European71 0.5% Dutch56 0.4% Haitian49 0.3% Egyptian37 0.2% Welsh36 0.2% Romanian26 0.2% Northern European25 0.2% Austrian23 0.1% British18 0.1% Jamaican17 0.1% Croatian16 0.1% Norwegian15 0.10% Scandinavian13 0.08% Slovene12 0.08% Russian11 0.07% Belgian9 0.06% Finnish8 0.05% Ukrainian7 0.05% Hungarian6 0.04% Greek
Geographical mobility in Plainfield Same house 1 year ago 21,650 84.7% White (Caucasian)1,911 45.3% Black or African American124 60.0% American Indian / Alaska Native1,856 81.7% Asian734 82.2% Other race2,734 90.7% Two or more races21,492 84.3% White alone, not Hispanic / Latino2,277 88.7% Hispanic or LatinoMoved within same county 1,805 7.1% White / Caucasian85 2.0% Black or African American18 94.6% Native Hawaiian / Pacific Islander109 12.2% Other race1,783 7.0% White alone, not Hispanic / Latino165 6.4% Hispanic or LatinoMoved within same state 1,419 5.6% White / Caucasian1,915 45.4% Black or African American63 30.3% American Indian / Alaska Native267 11.8% Asian11 1.2% Other race216 7.1% Two or more races1,524 6.0% White alone, not Hispanic / Latino110 4.3% Hispanic or LatinoMoved from different state 369 1.4% White / Caucasian551 13.1% Black or African American119 5.3% Asian27 3.1% Other race60 2.0% Two or more races369 1.4% White alone, not Hispanic / Latino73 2.8% Hispanic or LatinoMoved from abroad 11 0.0% White11 0.2% Black or African American15 0.1% White alone, not Hispanic / Latino
Children Nativity (place of birth) in Plainfield
Children under 6 years - Living with two parents Both parents native 876 100.0% NativeBoth parents foreign-born 342 97.3% Native10 2.7% Foreign-bornOne native, one foreign-born parent 261 100.0% NativeChildren under 6 years - Living with one parent Native parent 487 100.0% NativeChildren 6 to 17 years - Living with two parents Both parents native 2,795 100.0% NativeBoth parents foreign-born 567 59.2% Native392 40.8% Foreign-bornOne native, one foreign-born parent 290 100.0% NativeChildren 6 to 17 years - Living with one parent Native parent 1,439 97.7% Native34 2.3% Foreign-bornForeign-born parent 88 87.9% Native12 12.1% Foreign-born
Grandparents responsible for own grandchildren in Plainfield
Grandparents (30 to 59 years) White / Caucasian 163 85.7% Responsible for grandchildren27 14.3% Not responsible for grandchildrenAsian 97 100.0% Not responsible for grandchildrenWhite alone, not Hispanic / Latino 168 85.4% Responsible for grandchildren29 14.6% Not responsible for grandchildrenGrandparents (60 years and over) White / Caucasian 88 42.2% Responsible for grandchildren120 57.8% Not responsible for grandchildrenAsian 77 100.0% Not responsible for grandchildrenWhite alone, not Hispanic / Latino 89 42.0% Responsible for grandchildren123 58.0% Not responsible for grandchildren