Races in Plainview, Texas (TX) Detailed Stats
Data:
Races - White alone (%)
Races - White alone (% change since 2000)
Races - Black alone (%)
Races - Black alone (% change since 2000)
Races - American Indian alone (%)
Races - American Indian alone (% change since 2000)
Races - Asian alone (%)
Races - Asian alone (% change since 2000)
Races - Hispanic (%)
Races - Hispanic (% change since 2000)
Races - Native Hawaiian and Other Pacific Islander alone (%)
Races - Native Hawaiian and Other Pacific Islander alone (% change since 2000)
Races - Two or more races(%)
Races - Two or more races(% change since 2000)
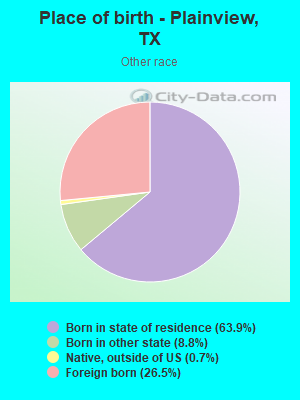
Races - Other race alone (%)
Races - Other race alone (% change since 2000)
Racial diversity
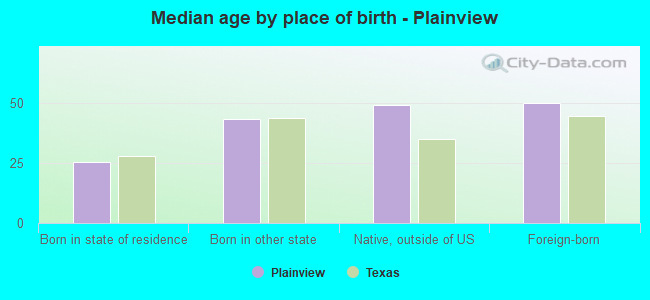
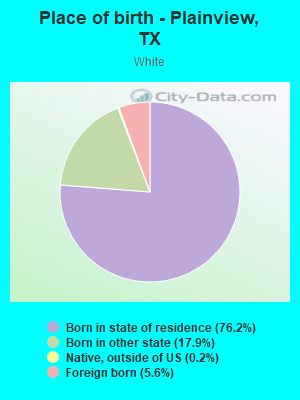
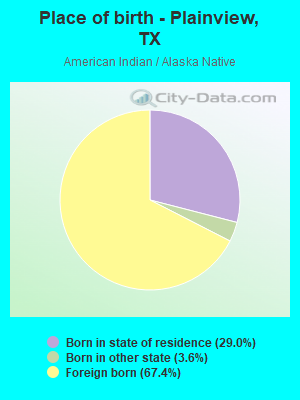
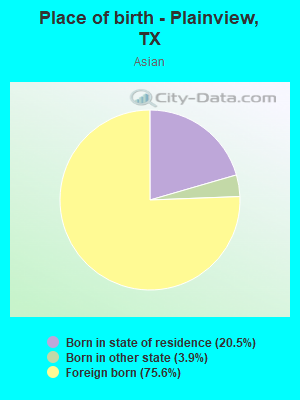
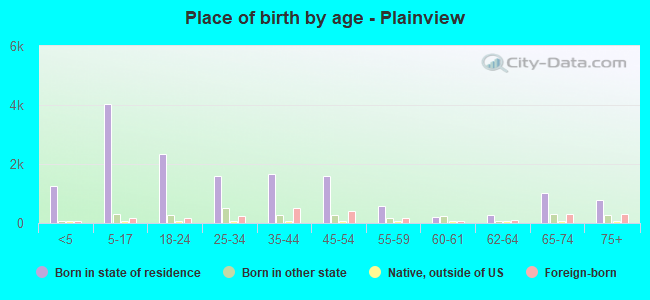
Place of birth - Born in state of residence (%)
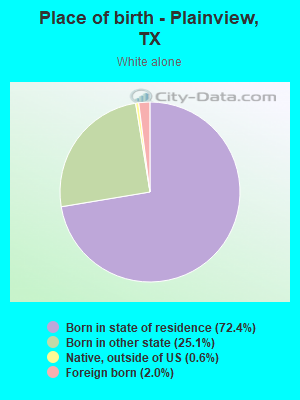
Place of birth - Born in state of residence (%) - White
Place of birth - Born in state of residence (%) - Black or African American
Place of birth - Born in state of residence (%) - Asian
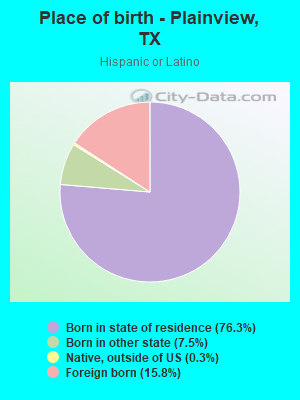
Place of birth - Born in state of residence (%) - Hispanic or Latino
Place of birth - Born in state of residence (%) - American Indian and Alaska Native
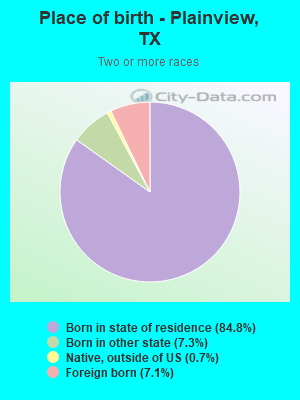
Place of birth - Born in state of residence (%) - Multirace
Place of birth - Born in state of residence (%) - Other Race
Place of birth - Born in other state (%)
Place of birth - Born in other state (%) - White
Place of birth - Born in other state (%) - Black or African American
Place of birth - Born in other state (%) - Asian
Place of birth - Born in other state (%) - Hispanic or Latino
Place of birth - Born in other state (%) - American Indian and Alaska Native
Place of birth - Born in other state (%) - Multirace
Place of birth - Born in other state (%) - Other Race
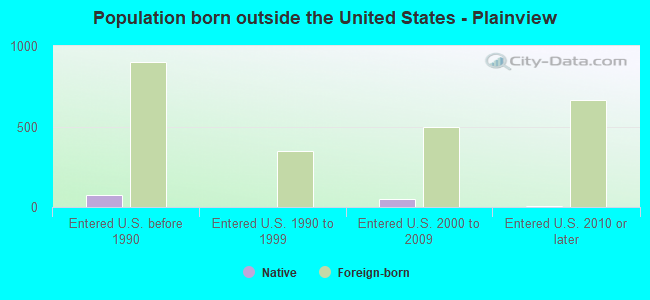
Place of birth - Native, outside of US (%)
Place of birth - Native, outside of US (%) - White
Place of birth - Native, outside of US (%) - Black or African American
Place of birth - Native, outside of US (%) - Asian
Place of birth - Native, outside of US (%) - Hispanic or Latino
Place of birth - Native, outside of US (%) - American Indian and Alaska Native
Place of birth - Native, outside of US (%) - Multirace
Place of birth - Native, outside of US (%) - Other Race
Place of birth - Foreign born (%)
Place of birth - Foreign born (%) - White
Place of birth - Foreign born (%) - Black or African American
Place of birth - Foreign born (%) - Asian
Place of birth - Foreign born (%) - Hispanic or Latino
Place of birth - Foreign born (%) - American Indian and Alaska Native
Place of birth - Foreign born (%) - Multirace
Place of birth - Foreign born (%) - Other Race
Residents speaking English at home (%)
Residents speaking English at home - Born in the United States (%)
Residents speaking English at home - Native, born elsewhere (%)
Residents speaking English at home - Foreign born (%)
Residents speaking Spanish at home (%)
Residents speaking Spanish at home - Born in the United States (%)
Residents speaking Spanish at home - Native, born elsewhere (%)
Residents speaking Spanish at home - Foreign born (%)
Residents speaking other language at home (%)
Residents speaking other language at home - Born in the United States (%)
Residents speaking other language at home - Native, born elsewhere (%)
Residents speaking other language at home - Foreign born (%)
Marital status - Never married (%)
Marital status - Now married (%)
Marital status - Separated (%)
Marital status - Widowed (%)
Marital status - Divorced (%)
Ancestries Reported - Arab (%)
Ancestries Reported - Czech (%)
Ancestries Reported - Danish (%)
Ancestries Reported - Dutch (%)
Ancestries Reported - English (%)
Ancestries Reported - French (%)
Ancestries Reported - French Canadian (%)
Ancestries Reported - German (%)
Ancestries Reported - Greek (%)
Ancestries Reported - Hungarian (%)
Ancestries Reported - Irish (%)
Ancestries Reported - Italian (%)
Ancestries Reported - Lithuanian (%)
Ancestries Reported - Norwegian (%)
Ancestries Reported - Polish (%)
Ancestries Reported - Portuguese (%)
Ancestries Reported - Russian (%)
Ancestries Reported - Scotch-Irish (%)
Ancestries Reported - Scottish (%)
Ancestries Reported - Slovak (%)
Ancestries Reported - Subsaharan African (%)
Ancestries Reported - Swedish (%)
Ancestries Reported - Swiss (%)
Ancestries Reported - Ukrainian (%)
Ancestries Reported - United States (%)
Ancestries Reported - Welsh (%)
Ancestries Reported - West Indian (%)
Ancestries Reported - Other (%)
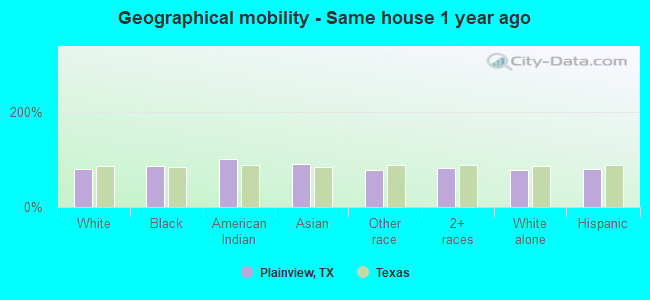
Geographical mobility - Same house 1 year ago (%)
Geographical mobility - Same house 1 year ago (%) - White
Geographical mobility - Same house 1 year ago (%) - Black or African American
Geographical mobility - Same house 1 year ago (%) - Asian
Geographical mobility - Same house 1 year ago (%) - Hispanic or Latino
Geographical mobility - Same house 1 year ago (%) - American Indian and Alaska Native
Geographical mobility - Same house 1 year ago (%) - Multirace
Geographical mobility - Same house 1 year ago (%) - Other Race
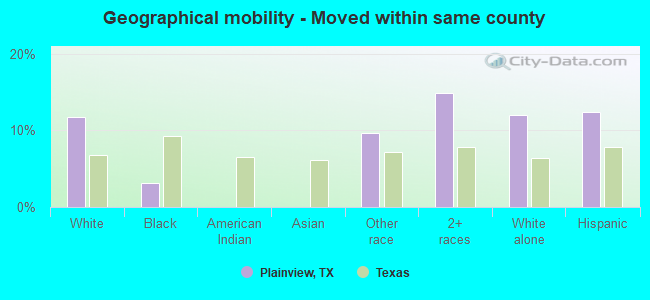
Geographical mobility - Moved within same county (%)
Geographical mobility - Moved within same county (%) - White
Geographical mobility - Moved within same county (%) - Black or African American
Geographical mobility - Moved within same county (%) - Asian
Geographical mobility - Moved within same county (%) - Hispanic or Latino
Geographical mobility - Moved within same county (%) - American Indian and Alaska Native
Geographical mobility - Moved within same county (%) - Multirace
Geographical mobility - Moved within same county (%) - Other Race
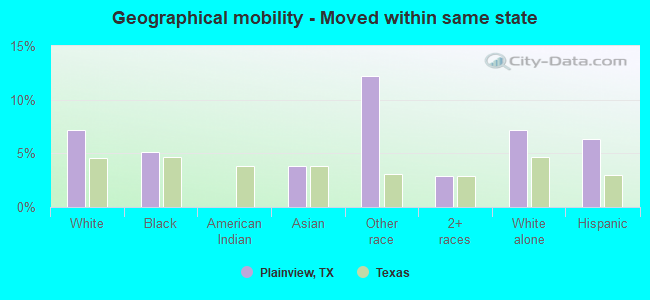
Geographical mobility - Moved from different county within same state (%)
Geographical mobility - Moved from different county within same state (%) - White
Geographical mobility - Moved from different county within same state (%) - Black or African American
Geographical mobility - Moved from different county within same state (%) - Asian
Geographical mobility - Moved from different county within same state (%) - Hispanic or Latino
Geographical mobility - Moved from different county within same state (%) - American Indian and Alaska Native
Geographical mobility - Moved from different county within same state (%) - Multirace
Geographical mobility - Moved from different county within same state (%) - Other Race
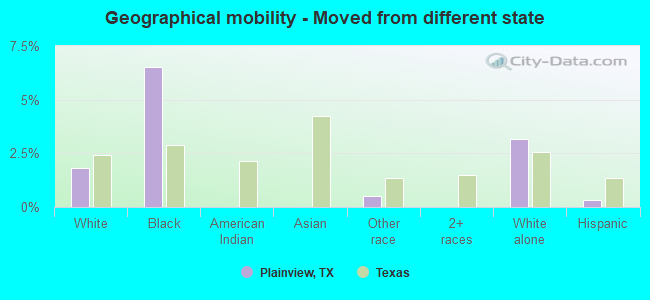
Geographical mobility - Moved from different state (%)
Geographical mobility - Moved from different state (%) - White
Geographical mobility - Moved from different state (%) - Black or African American
Geographical mobility - Moved from different state (%) - Asian
Geographical mobility - Moved from different state (%) - Hispanic or Latino
Geographical mobility - Moved from different state (%) - American Indian and Alaska Native
Geographical mobility - Moved from different state (%) - Multirace
Geographical mobility - Moved from different state (%) - Other Race
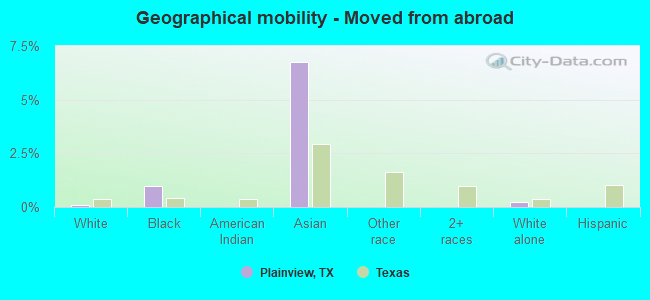
Geographical mobility - Moved from abroad (%)
Geographical mobility - Moved from abroad (%) - White
Geographical mobility - Moved from abroad (%) - Black or African American
Geographical mobility - Moved from abroad (%) - Asian
Geographical mobility - Moved from abroad (%) - Hispanic or Latino
Geographical mobility - Moved from abroad (%) - American Indian and Alaska Native
Geographical mobility - Moved from abroad (%) - Multirace
Geographical mobility - Moved from abroad (%) - Other Race
Place of birth for the foreign-born population - Ireland (%)
Place of birth for the foreign-born population - Denmark (%)
Place of birth for the foreign-born population - Norway (%)
Place of birth for the foreign-born population - Sweden (%)
Place of birth for the foreign-born population - United Kingdom (%)
Place of birth for the foreign-born population - England (%)
Place of birth for the foreign-born population - Scotland (%)
Place of birth for the foreign-born population - Other Northern Europe (%)
Place of birth for the foreign-born population - Austria (%)
Place of birth for the foreign-born population - Belgium (%)
Place of birth for the foreign-born population - France (%)
Place of birth for the foreign-born population - Germany (%)
Place of birth for the foreign-born population - Netherlands (%)
Place of birth for the foreign-born population - Switzerland (%)
Place of birth for the foreign-born population - Other Western Europe (%)
Place of birth for the foreign-born population - Greece (%)
Place of birth for the foreign-born population - Italy (%)
Place of birth for the foreign-born population - Portugal (%)
Place of birth for the foreign-born population - Spain (%)
Place of birth for the foreign-born population - Other Southern Europe (%)
Place of birth for the foreign-born population - Albania (%)
Place of birth for the foreign-born population - Belarus (%)
Place of birth for the foreign-born population - Bosnia and Herzegovina (%)
Place of birth for the foreign-born population - Bulgaria (%)
Place of birth for the foreign-born population - Croatia (%)
Place of birth for the foreign-born population - Czechoslovakia (%)
Place of birth for the foreign-born population - Hungary (%)
Place of birth for the foreign-born population - Latvia (%)
Place of birth for the foreign-born population - Lithuania (%)
Place of birth for the foreign-born population - North Macedonia (Macedonia) (%)
Place of birth for the foreign-born population - Moldova (%)
Place of birth for the foreign-born population - Poland (%)
Place of birth for the foreign-born population - Romania (%)
Place of birth for the foreign-born population - Russia (%)
Place of birth for the foreign-born population - Serbia (%)
Place of birth for the foreign-born population - Ukraine (%)
Place of birth for the foreign-born population - Other Eastern Europe (%)
Place of birth for the foreign-born population - China (%)
Place of birth for the foreign-born population - Hong Kong (%)
Place of birth for the foreign-born population - Taiwan (%)
Place of birth for the foreign-born population - Japan (%)
Place of birth for the foreign-born population - Korea (%)
Place of birth for the foreign-born population - Other Eastern Asia (%)
Place of birth for the foreign-born population - Afghanistan (%)
Place of birth for the foreign-born population - Bangladesh (%)
Place of birth for the foreign-born population - India (%)
Place of birth for the foreign-born population - Iran (%)
Place of birth for the foreign-born population - Kazakhstan (%)
Place of birth for the foreign-born population - Nepal (%)
Place of birth for the foreign-born population - Pakistan (%)
Place of birth for the foreign-born population - Sri Lanka (%)
Place of birth for the foreign-born population - Uzbekistan (%)
Place of birth for the foreign-born population - Other South Central Asia (%)
Place of birth for the foreign-born population - Burma (%)
Place of birth for the foreign-born population - Cambodia (%)
Place of birth for the foreign-born population - Indonesia (%)
Place of birth for the foreign-born population - Laos (%)
Place of birth for the foreign-born population - Malaysia (%)
Place of birth for the foreign-born population - Philippines (%)
Place of birth for the foreign-born population - Singapore (%)
Place of birth for the foreign-born population - Thailand (%)
Place of birth for the foreign-born population - Vietnam (%)
Place of birth for the foreign-born population - Other South Eastern Asia (%)
Place of birth for the foreign-born population - Armenia (%)
Place of birth for the foreign-born population - Iraq (%)
Place of birth for the foreign-born population - Israel (%)
Place of birth for the foreign-born population - Jordan (%)
Place of birth for the foreign-born population - Kuwait (%)
Place of birth for the foreign-born population - Lebanon (%)
Place of birth for the foreign-born population - Saudi Arabia (%)
Place of birth for the foreign-born population - Syria (%)
Place of birth for the foreign-born population - Turkey (%)
Place of birth for the foreign-born population - Yemen (%)
Place of birth for the foreign-born population - Other Western Asia (%)
Place of birth for the foreign-born population - Eritrea (%)
Place of birth for the foreign-born population - Ethiopia (%)
Place of birth for the foreign-born population - Kenya (%)
Place of birth for the foreign-born population - Somalia (%)
Place of birth for the foreign-born population - Uganda (%)
Place of birth for the foreign-born population - Zimbabwe (%)
Place of birth for the foreign-born population - Other Eastern Africa (%)
Place of birth for the foreign-born population - Cameroon (%)
Place of birth for the foreign-born population - Congo (%)
Place of birth for the foreign-born population - Democratic Republic of Congo (Zaire) (%)
Place of birth for the foreign-born population - Other Middle Africa (%)
Place of birth for the foreign-born population - Egypt (%)
Place of birth for the foreign-born population - Morocco (%)
Place of birth for the foreign-born population - Sudan (%)
Place of birth for the foreign-born population - Other Northern Africa (%)
Place of birth for the foreign-born population - South Africa (%)
Place of birth for the foreign-born population - Other Southern Africa (%)
Place of birth for the foreign-born population - Cabo Verde (%)
Place of birth for the foreign-born population - Ghana (%)
Place of birth for the foreign-born population - Liberia (%)
Place of birth for the foreign-born population - Nigeria (%)
Place of birth for the foreign-born population - Senegal (%)
Place of birth for the foreign-born population - Sierra Leone (%)
Place of birth for the foreign-born population - Other Western Africa (%)
Place of birth for the foreign-born population - Australia (%)
Place of birth for the foreign-born population - New Zealand (%)
Place of birth for the foreign-born population - Fiji (%)
Place of birth for the foreign-born population - Micronesia (%)
Place of birth for the foreign-born population - Bahamas (%)
Place of birth for the foreign-born population - Barbados (%)
Place of birth for the foreign-born population - Cuba (%)
Place of birth for the foreign-born population - Dominica (%)
Place of birth for the foreign-born population - Dominican Republic (%)
Place of birth for the foreign-born population - Grenada (%)
Place of birth for the foreign-born population - Haiti (%)
Place of birth for the foreign-born population - Jamaica (%)
Place of birth for the foreign-born population - St. Vincent and the Grenadines (%)
Place of birth for the foreign-born population - Trinidad and Tobago (%)
Place of birth for the foreign-born population - West Indies (%)
Place of birth for the foreign-born population - Other Caribbean (%)
Place of birth for the foreign-born population - Belize (%)
Place of birth for the foreign-born population - Costa Rica (%)
Place of birth for the foreign-born population - El Salvador (%)
Place of birth for the foreign-born population - Guatemala (%)
Place of birth for the foreign-born population - Honduras (%)
Place of birth for the foreign-born population - Mexico (%)
Place of birth for the foreign-born population - Nicaragua (%)
Place of birth for the foreign-born population - Panama (%)
Place of birth for the foreign-born population - Other Central America (%)
Place of birth for the foreign-born population - Argentina (%)
Place of birth for the foreign-born population - Bolivia (%)
Place of birth for the foreign-born population - Brazil (%)
Place of birth for the foreign-born population - Chile (%)
Place of birth for the foreign-born population - Colombia (%)
Place of birth for the foreign-born population - Ecuador (%)
Place of birth for the foreign-born population - Guyana (%)
Place of birth for the foreign-born population - Peru (%)
Place of birth for the foreign-born population - Uruguay (%)
Place of birth for the foreign-born population - Venezuela (%)
Place of birth for the foreign-born population - Other South America (%)
Place of birth for the foreign-born population - Canada (%)
Place of birth for the foreign-born population - Other Northern America (%)
Place of birth for the foreign-born population - Other (%)
Latest news about races in Plainview, TX collected exclusively by city-data.com from local newspapers, TV, and radio stations
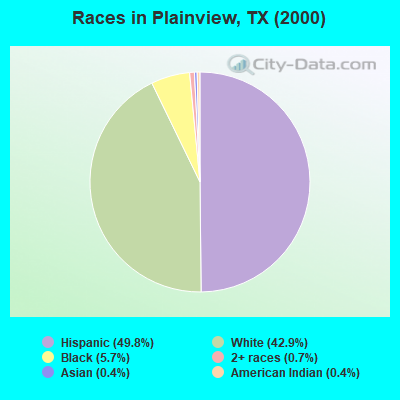
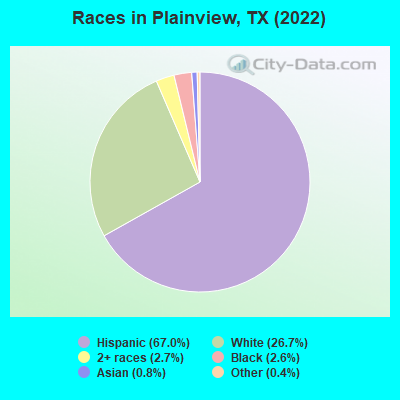
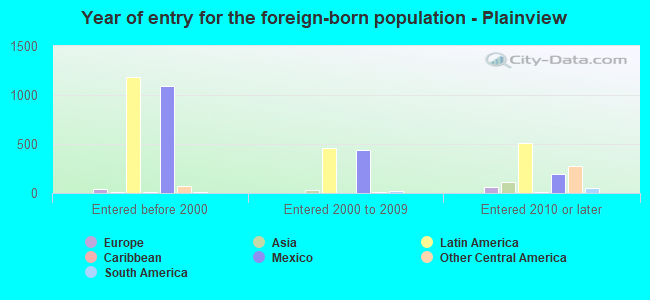
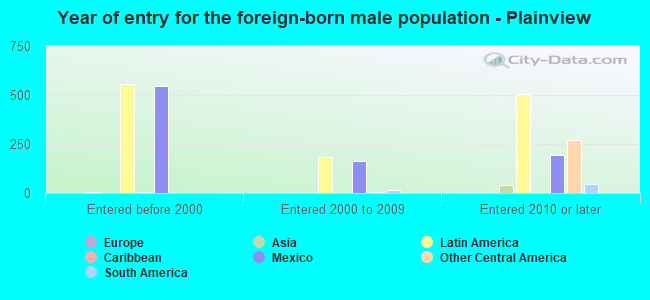
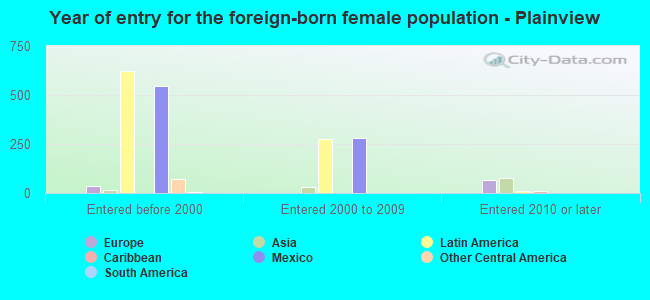
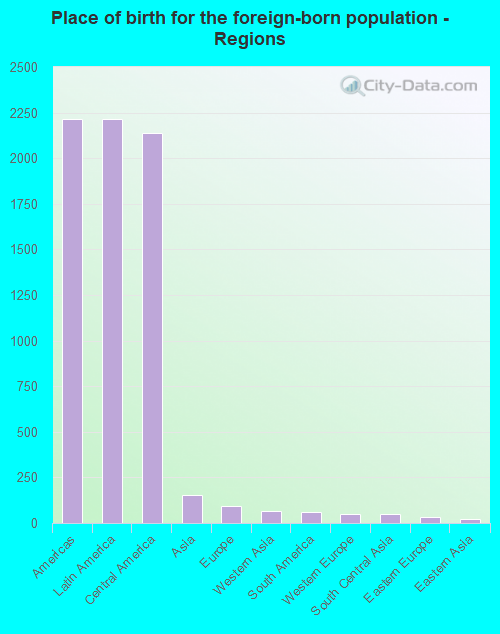
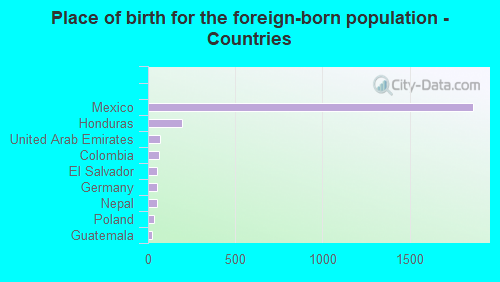
According to 2022 data, the most numerous races in Plainview, TX are Hispanic (13,841 residents), White alone (5,522 residents), and Black alone (547 residents). 58.9% of Plainview residents speak English at home. 11.9% of Plainview, TX residents are foreign-born (10.6% born in Latin America), which is 42.9% less than the foreign-born rate of 17.0% across the entire state of Texas.
Race distribution in Plainview
2000 2022
10,933,313 52.4% White alone 6,669,666 32.0% Hispanic 2,364,255 11.3% Black alone 554,445 2.7% Asian alone 230,567 1.1% Two or more races 68,859 0.3% American Indian alone 19,958 0.10% Other race alone 10,757 0.05% Native Hawaiian and Other
12,070,642 40.2% Hispanic 11,683,430 38.9% White alone 3,508,706 11.7% Black alone 1,608,173 5.4% Asian alone 956,560 3.2% Two or more races 125,763 0.4% Other race alone 47,023 0.2% American Indian alone 29,275 0.10% Native Hawaiian and Other
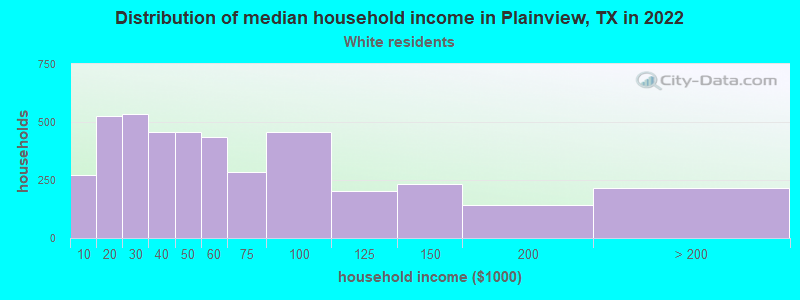
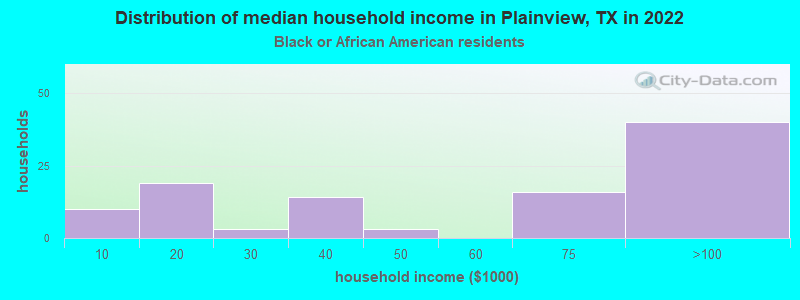
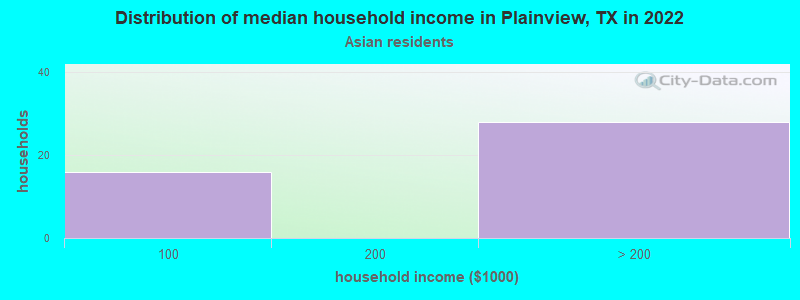
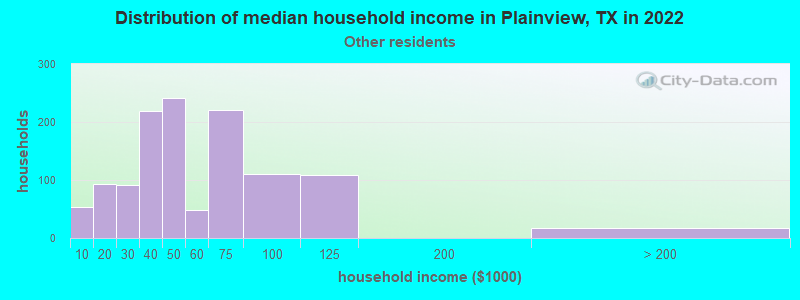
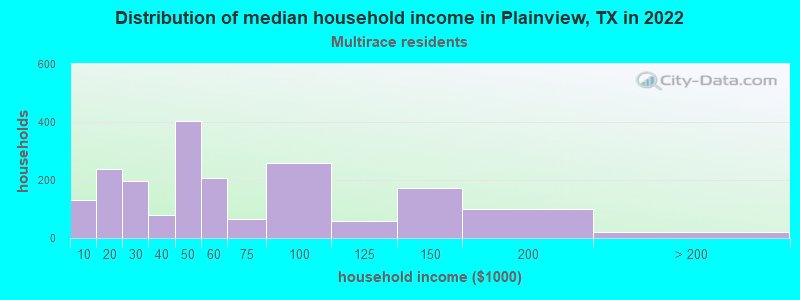
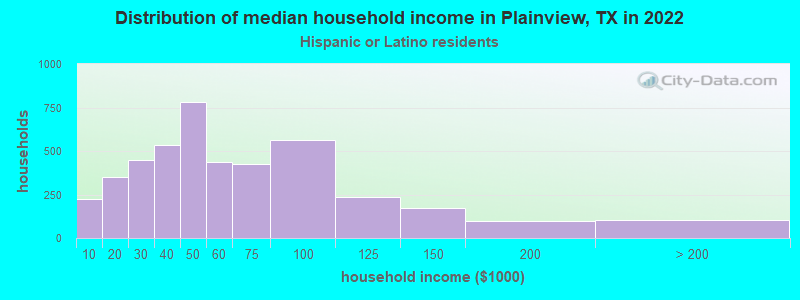
Income and house value in Plainview Median household income in 2022 $42,804 White non-Hispanic householders$60,827 Black householders$48,955 Some other race householders$45,109 Two or more races householders$48,347 Hispanic or Latino race householdersMedian 2022 house value $138,004 White Non-Hispanic householders$74,628 Black or African American householders$48,370 American Indian or Alaska Native householders $141,558 Asian householders$78,182 Some other race householders$122,012 Two or more races householders$77,195 Hispanic or Latino householders
Median age by race in Plainview
35.1 Median age for White residents33.0 36.4 19.2 Median age for Black or African American residents17.6 35.6 20.0 Median age for American Indian / Alaska Native residents-682,445,758.7 37.0 27.3 Median age for Asian residents38.3 26.8 -581,560,283.1 Median age for Native Hawaiian / Pacific Islander residents-612,729,233.5 -577,777,777.2 36.2 Median age for Other race residents26.8 41.8 27.4 Median age for Two or more races residents31.8 23.6 47.8 Median age for White alone residents47.5 48.0 27.8 Median age for Hispanic or Latino residents26.9 29.7
Owner/renter occupied households by race in Plainview
House owners and renters - White residents 2,338 54.5% Owner occupied1,952 45.5% Renter occupiedHouse owners and renters - Black or African American residents 24 22.6% Owner occupied83 77.4% Renter occupiedHouse owners and renters - Asian residents 44 100.0% Owner occupiedHouse owners and renters - Other race residents 681 55.9% Owner occupied537 44.1% Renter occupiedHouse owners and renters - Two or more races residents 939 49.6% Owner occupied955 50.4% Renter occupiedHouse owners and renters - White alone residents 1,441 54.0% Owner occupied1,230 46.0% Renter occupiedHouse owners and renters - Hispanic or Latino residents 2,332 53.5% Owner occupied2,030 46.5% Renter occupied
Language usage in Plainview
English speakers - Total 58.9% of residents of Plainview speak English at home.
39.6% of residents speak Spanish at home 5,582 72.9% Speak English very well2,077 27.1% Speak English less than very well1.3% of residents speak other language at home 193 74.2% Speak English very well67 25.8% Speak English less than very well
English speakers - Born in the United States 80.8% of residents of Plainview speak English at home.
18.6% of residents speak Spanish at home 418 84.8% Speak English very well75 15.2% Speak English less than very well0.4% of residents speak other language at home 10 100.0% Speak English very well
English speakers - Native, born elsewhere 75.6% of residents of Plainview speak English at home.
20.0% of residents speak Spanish at home 27 100.0% Speak English less than very well2.2% of residents speak other language at home 3 100.0% Speak English very well
English speakers - Foreign-born 6.5% of residents of Plainview speak English at home.
83.3% of residents speak Spanish at home 563 27.8% Speak English very well1,462 72.2% Speak English less than very well9.5% of residents speak other language at home 164 71.3% Speak English very well66 28.7% Speak English less than very well
White (Caucasian) - Speak only English Native:
76.5% (7,430)Foreign-born:
10.6% (61)
White (Caucasian) - Speak another language Native:
17.4% (1,693)Foreign-born:
83.0% (479)
Black or African American - Speak only English Native:
92.0% (525)Foreign-born:
34.0% (8)
Black or African American - Speak another language Native:
8.0% (46)Foreign-born:
65.7% (16)
American Indian / Alaska Native - Speak another language Native:
100.0% (33)Foreign-born:
98.9% (68)
Asian - Speak only English Native:
70.8% (16)Foreign-born:
10.4% (14)
Asian - Speak another language Native:
29.7% (7)Foreign-born:
89.5% (124)
Other race - Speak another language Native:
55.8% (1,191)Foreign-born:
99.5% (821)
Two or more races - Speak only English Native:
56.1% (2,877)Foreign-born:
20.3% (91)
Two or more races - Speak another language Native:
42.7% (2,186)Foreign-born:
78.9% (354)
White alone - Speak another language Native:
7.1% (375)Foreign-born:
99.8% (110)
Hispanic or Latino - Speak only English Native:
50.7% (5,353)Foreign-born:
6.6% (143)
Hispanic or Latino - Speak another language Native:
49.6% (5,239)Foreign-born:
93.5% (2,017)
Foreign-born residents in Plainview 2,457 residents are foreign born (10.6% Latin America ).
This city:
11.9%Texas:
17.1%
Marital status for residents in Plainview Marital status - White (Caucasian) population 15 years and over
Males 33.3% Never married53.2% Now married1.5% Separated4.6% Widowed7.4% DivorcedFemales 30.1% Never married48.5% Now married2.5% Separated11.6% Widowed7.3% DivorcedWomen who gave birth in the past 12 months Now married:
33.9% (66)Unmarried:
66.1% (129)
Women who did not give birth in the past 12 months Now married:
49.1% (1,220)Unmarried:
50.9% (1,265)
Marital status - Black or African American population 15 years and over
Males 65.6% Never married18.2% Now married3.2% Separated1.2% Widowed11.9% DivorcedFemales 19.7% Never married63.9% Now married2.7% Separated10.2% Widowed3.4% DivorcedWomen who did not give birth in the past 12 months Now married:
51.2% (43)Unmarried:
48.8% (41)
Marital status - American Indian / Alaska Native population 15 years and over
Males 100.0% Never married0.0% Now married0.0% Separated0.0% Widowed0.0% DivorcedFemales 92.7% Never married7.3% Now married0.0% Separated0.0% Widowed0.0% DivorcedWomen who did not give birth in the past 12 months Now married:
0.0% (0)Unmarried:
100.0% (54)
Marital status - Asian population 15 years and over
Males 20.8% Never married79.2% Now married0.0% Separated0.0% Widowed0.0% DivorcedFemales 8.7% Never married91.3% Now married0.0% Separated0.0% Widowed0.0% DivorcedWomen who did not give birth in the past 12 months Now married:
87.0% (43)Unmarried:
13.0% (6)
Marital status - Other race population 15 years and over
Males 40.4% Never married49.5% Now married0.0% Separated2.7% Widowed7.3% DivorcedFemales 28.1% Never married45.3% Now married13.0% Separated4.7% Widowed8.9% DivorcedWomen who gave birth in the past 12 months Now married:
40.7% (15)Unmarried:
59.3% (22)
Women who did not give birth in the past 12 months Now married:
40.9% (275)Unmarried:
59.1% (397)
Marital status - Two or more races population 15 years and over
Males 44.8% Never married39.5% Now married8.1% Separated0.2% Widowed7.5% DivorcedFemales 32.3% Never married37.6% Now married12.5% Separated9.6% Widowed8.0% DivorcedWomen who gave birth in the past 12 months Now married:
0.0% (0)Unmarried:
100.0% (39)
Women who did not give birth in the past 12 months Now married:
41.6% (535)Unmarried:
58.4% (752)
Marital status - White alone, not Hispanic / Latino population 15 years and over
Males 30.9% Never married50.5% Now married0.9% Separated8.4% Widowed9.3% DivorcedFemales 29.1% Never married41.4% Now married2.0% Separated18.8% Widowed8.6% DivorcedWomen who gave birth in the past 12 months Now married:
30.7% (50)Unmarried:
69.3% (112)
Women who did not give birth in the past 12 months Now married:
38.8% (393)Unmarried:
61.2% (620)
Marital status - Hispanic or Latino population 15 years and over
Males 39.5% Never married49.4% Now married3.2% Separated1.2% Widowed6.6% DivorcedFemales 31.8% Never married49.3% Now married6.3% Separated5.7% Widowed6.9% DivorcedWomen who gave birth in the past 12 months Now married:
33.1% (45)Unmarried:
66.9% (90)
Women who did not give birth in the past 12 months Now married:
48.6% (1,636)Unmarried:
51.4% (1,733)
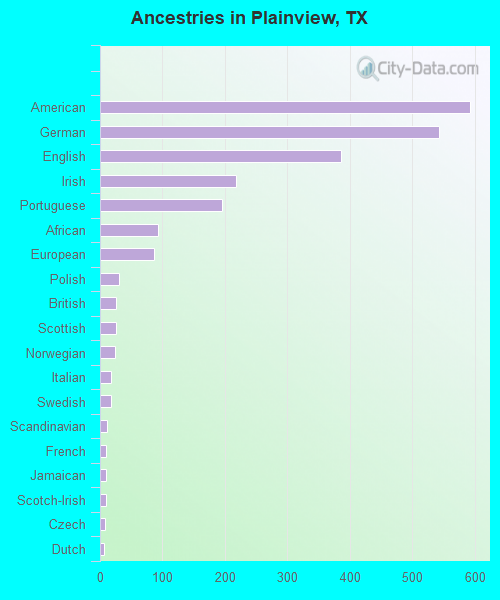
Ancestries in Plainview
593 4.8% American542 4.4% German386 3.1% English217 1.7% Irish195 1.6% Portuguese93 0.7% African86 0.7% European30 0.2% Polish26 0.2% British25 0.2% Scottish24 0.2% Norwegian17 0.1% Italian17 0.1% Swedish11 0.09% Scandinavian10 0.08% French10 0.08% Jamaican9 0.07% Scotch-Irish8 0.06% Czech6 0.05% Dutch
Geographical mobility in Plainview Same house 1 year ago 8,445 78.8% White (Caucasian)511 85.8% Black or African American93 100.0% American Indian / Alaska Native166 89.9% Asian2,359 76.8% Other race5,170 81.9% Two or more races4,214 76.7% White alone, not Hispanic / Latino11,013 80.2% Hispanic or LatinoMoved within same county 1,256 11.7% White / Caucasian19 3.1% Black or African American296 9.6% Other race937 14.8% Two or more races661 12.0% White alone, not Hispanic / Latino1,705 12.4% Hispanic or LatinoMoved within same state 772 7.2% White / Caucasian30 5.1% Black or African American7 3.8% Asian374 12.2% Other race179 2.8% Two or more races394 7.2% White alone, not Hispanic / Latino876 6.4% Hispanic or LatinoMoved from different state 193 1.8% White / Caucasian39 6.5% Black or African American15 0.5% Other race175 3.2% White alone, not Hispanic / Latino43 0.3% Hispanic or LatinoMoved from abroad 8 0.1% White6 1.0% Black or African American12 6.8% Asian12 0.2% White alone, not Hispanic / Latino
Children Nativity (place of birth) in Plainview
Children under 6 years - Living with two parents Both parents native 659 100.0% NativeBoth parents foreign-born 49 100.0% NativeOne native, one foreign-born parent 65 100.0% NativeChildren under 6 years - Living with one parent Native parent 550 100.0% NativeForeign-born parent 38 61.1% Native24 38.9% Foreign-bornChildren 6 to 17 years - Living with two parents Both parents native 1,478 100.0% NativeBoth parents foreign-born 318 100.0% NativeOne native, one foreign-born parent 276 88.4% Native36 11.6% Foreign-bornChildren 6 to 17 years - Living with one parent Native parent 1,456 100.0% NativeForeign-born parent 351 60.6% Native228 39.4% Foreign-born
Grandparents responsible for own grandchildren in Plainview
Grandparents (30 to 59 years) White / Caucasian 61 65.3% Responsible for grandchildren33 34.7% Not responsible for grandchildrenOther race 31 100.0% Responsible for grandchildrenTwo or more races 28 39.5% Responsible for grandchildren43 60.5% Not responsible for grandchildrenHispanic or Latino 134 65.2% Responsible for grandchildren71 34.8% Not responsible for grandchildrenGrandparents (60 years and over) White / Caucasian 24 48.3% Responsible for grandchildren26 51.7% Not responsible for grandchildrenOther race 68 65.6% Responsible for grandchildren36 34.4% Not responsible for grandchildrenTwo or more races 64 62.7% Responsible for grandchildren38 37.3% Not responsible for grandchildrenHispanic or Latino 115 58.2% Responsible for grandchildren82 41.8% Not responsible for grandchildren