Races in Plattsburgh, New York (NY) Detailed Stats
Data:
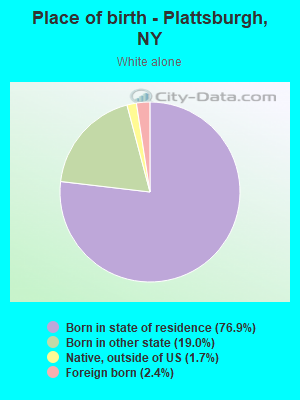
Races - White alone (%)
Races - White alone (% change since 2000)
Races - Black alone (%)
Races - Black alone (% change since 2000)
Races - American Indian alone (%)
Races - American Indian alone (% change since 2000)
Races - Asian alone (%)
Races - Asian alone (% change since 2000)
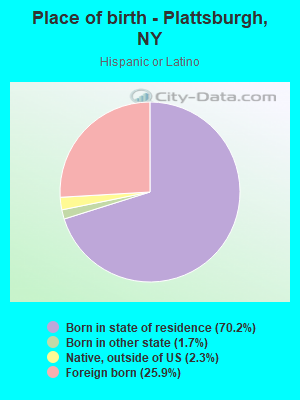
Races - Hispanic (%)
Races - Hispanic (% change since 2000)
Races - Native Hawaiian and Other Pacific Islander alone (%)
Races - Native Hawaiian and Other Pacific Islander alone (% change since 2000)
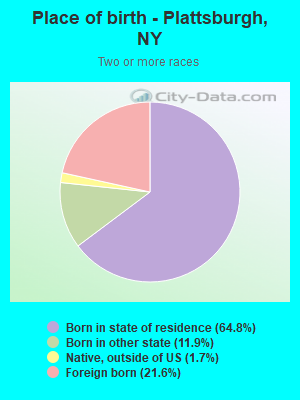
Races - Two or more races(%)
Races - Two or more races(% change since 2000)
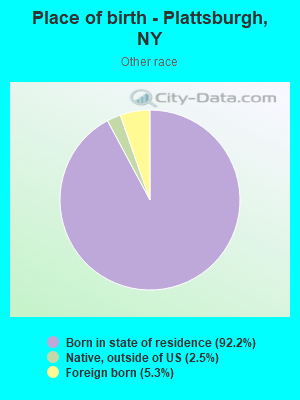
Races - Other race alone (%)
Races - Other race alone (% change since 2000)
Racial diversity
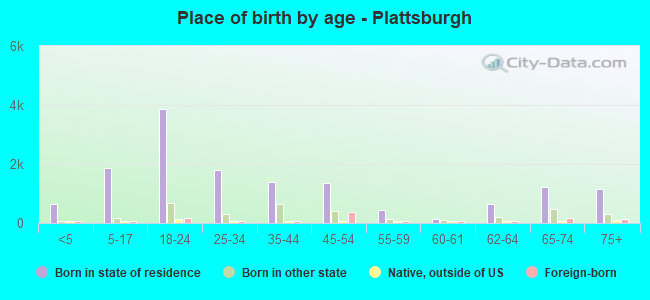
Place of birth - Born in state of residence (%)
Place of birth - Born in state of residence (%) - White
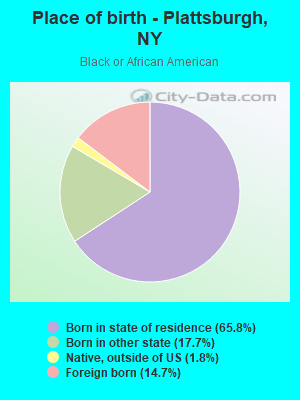
Place of birth - Born in state of residence (%) - Black or African American
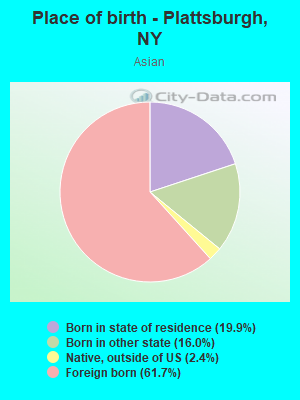
Place of birth - Born in state of residence (%) - Asian
Place of birth - Born in state of residence (%) - Hispanic or Latino
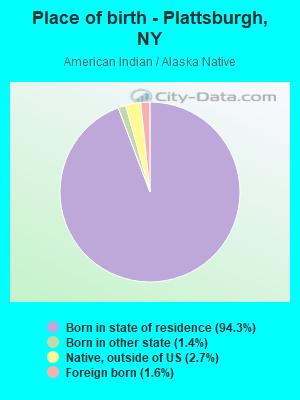
Place of birth - Born in state of residence (%) - American Indian and Alaska Native
Place of birth - Born in state of residence (%) - Multirace
Place of birth - Born in state of residence (%) - Other Race
Place of birth - Born in other state (%)
Place of birth - Born in other state (%) - White
Place of birth - Born in other state (%) - Black or African American
Place of birth - Born in other state (%) - Asian
Place of birth - Born in other state (%) - Hispanic or Latino
Place of birth - Born in other state (%) - American Indian and Alaska Native
Place of birth - Born in other state (%) - Multirace
Place of birth - Born in other state (%) - Other Race
Place of birth - Native, outside of US (%)
Place of birth - Native, outside of US (%) - White
Place of birth - Native, outside of US (%) - Black or African American
Place of birth - Native, outside of US (%) - Asian
Place of birth - Native, outside of US (%) - Hispanic or Latino
Place of birth - Native, outside of US (%) - American Indian and Alaska Native
Place of birth - Native, outside of US (%) - Multirace
Place of birth - Native, outside of US (%) - Other Race
Place of birth - Foreign born (%)
Place of birth - Foreign born (%) - White
Place of birth - Foreign born (%) - Black or African American
Place of birth - Foreign born (%) - Asian
Place of birth - Foreign born (%) - Hispanic or Latino
Place of birth - Foreign born (%) - American Indian and Alaska Native
Place of birth - Foreign born (%) - Multirace
Place of birth - Foreign born (%) - Other Race
Residents speaking English at home (%)
Residents speaking English at home - Born in the United States (%)
Residents speaking English at home - Native, born elsewhere (%)
Residents speaking English at home - Foreign born (%)
Residents speaking Spanish at home (%)
Residents speaking Spanish at home - Born in the United States (%)
Residents speaking Spanish at home - Native, born elsewhere (%)
Residents speaking Spanish at home - Foreign born (%)
Residents speaking other language at home (%)
Residents speaking other language at home - Born in the United States (%)
Residents speaking other language at home - Native, born elsewhere (%)
Residents speaking other language at home - Foreign born (%)
Marital status - Never married (%)
Marital status - Now married (%)
Marital status - Separated (%)
Marital status - Widowed (%)
Marital status - Divorced (%)
Ancestries Reported - Arab (%)
Ancestries Reported - Czech (%)
Ancestries Reported - Danish (%)
Ancestries Reported - Dutch (%)
Ancestries Reported - English (%)
Ancestries Reported - French (%)
Ancestries Reported - French Canadian (%)
Ancestries Reported - German (%)
Ancestries Reported - Greek (%)
Ancestries Reported - Hungarian (%)
Ancestries Reported - Irish (%)
Ancestries Reported - Italian (%)
Ancestries Reported - Lithuanian (%)
Ancestries Reported - Norwegian (%)
Ancestries Reported - Polish (%)
Ancestries Reported - Portuguese (%)
Ancestries Reported - Russian (%)
Ancestries Reported - Scotch-Irish (%)
Ancestries Reported - Scottish (%)
Ancestries Reported - Slovak (%)
Ancestries Reported - Subsaharan African (%)
Ancestries Reported - Swedish (%)
Ancestries Reported - Swiss (%)
Ancestries Reported - Ukrainian (%)
Ancestries Reported - United States (%)
Ancestries Reported - Welsh (%)
Ancestries Reported - West Indian (%)
Ancestries Reported - Other (%)
Geographical mobility - Same house 1 year ago (%)
Geographical mobility - Same house 1 year ago (%) - White
Geographical mobility - Same house 1 year ago (%) - Black or African American
Geographical mobility - Same house 1 year ago (%) - Asian
Geographical mobility - Same house 1 year ago (%) - Hispanic or Latino
Geographical mobility - Same house 1 year ago (%) - American Indian and Alaska Native
Geographical mobility - Same house 1 year ago (%) - Multirace
Geographical mobility - Same house 1 year ago (%) - Other Race
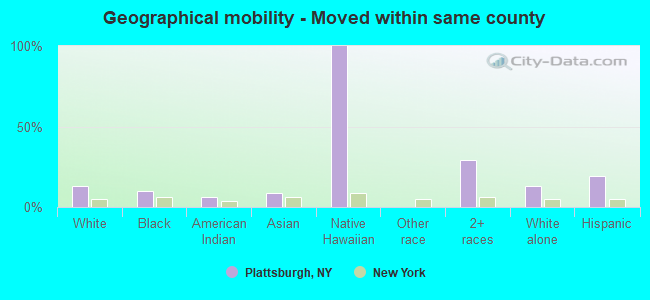
Geographical mobility - Moved within same county (%)
Geographical mobility - Moved within same county (%) - White
Geographical mobility - Moved within same county (%) - Black or African American
Geographical mobility - Moved within same county (%) - Asian
Geographical mobility - Moved within same county (%) - Hispanic or Latino
Geographical mobility - Moved within same county (%) - American Indian and Alaska Native
Geographical mobility - Moved within same county (%) - Multirace
Geographical mobility - Moved within same county (%) - Other Race
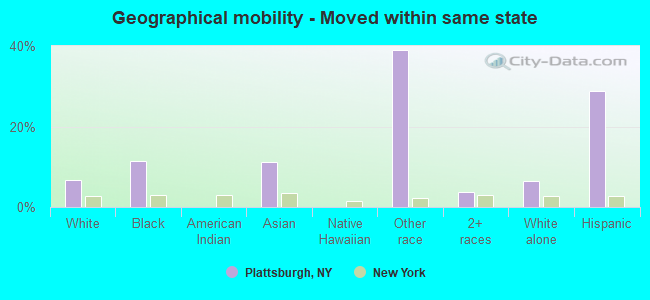
Geographical mobility - Moved from different county within same state (%)
Geographical mobility - Moved from different county within same state (%) - White
Geographical mobility - Moved from different county within same state (%) - Black or African American
Geographical mobility - Moved from different county within same state (%) - Asian
Geographical mobility - Moved from different county within same state (%) - Hispanic or Latino
Geographical mobility - Moved from different county within same state (%) - American Indian and Alaska Native
Geographical mobility - Moved from different county within same state (%) - Multirace
Geographical mobility - Moved from different county within same state (%) - Other Race
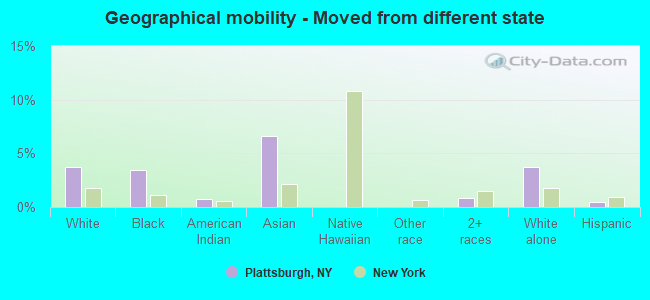
Geographical mobility - Moved from different state (%)
Geographical mobility - Moved from different state (%) - White
Geographical mobility - Moved from different state (%) - Black or African American
Geographical mobility - Moved from different state (%) - Asian
Geographical mobility - Moved from different state (%) - Hispanic or Latino
Geographical mobility - Moved from different state (%) - American Indian and Alaska Native
Geographical mobility - Moved from different state (%) - Multirace
Geographical mobility - Moved from different state (%) - Other Race
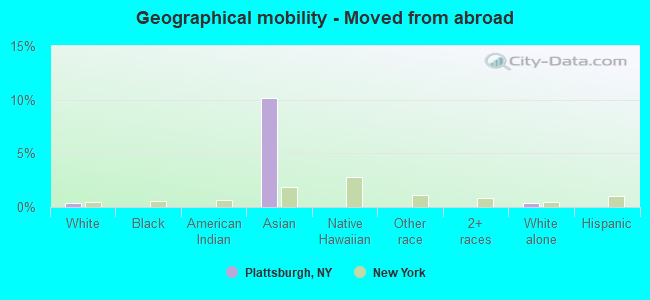
Geographical mobility - Moved from abroad (%)
Geographical mobility - Moved from abroad (%) - White
Geographical mobility - Moved from abroad (%) - Black or African American
Geographical mobility - Moved from abroad (%) - Asian
Geographical mobility - Moved from abroad (%) - Hispanic or Latino
Geographical mobility - Moved from abroad (%) - American Indian and Alaska Native
Geographical mobility - Moved from abroad (%) - Multirace
Geographical mobility - Moved from abroad (%) - Other Race
Place of birth for the foreign-born population - Ireland (%)
Place of birth for the foreign-born population - Denmark (%)
Place of birth for the foreign-born population - Norway (%)
Place of birth for the foreign-born population - Sweden (%)
Place of birth for the foreign-born population - United Kingdom (%)
Place of birth for the foreign-born population - England (%)
Place of birth for the foreign-born population - Scotland (%)
Place of birth for the foreign-born population - Other Northern Europe (%)
Place of birth for the foreign-born population - Austria (%)
Place of birth for the foreign-born population - Belgium (%)
Place of birth for the foreign-born population - France (%)
Place of birth for the foreign-born population - Germany (%)
Place of birth for the foreign-born population - Netherlands (%)
Place of birth for the foreign-born population - Switzerland (%)
Place of birth for the foreign-born population - Other Western Europe (%)
Place of birth for the foreign-born population - Greece (%)
Place of birth for the foreign-born population - Italy (%)
Place of birth for the foreign-born population - Portugal (%)
Place of birth for the foreign-born population - Spain (%)
Place of birth for the foreign-born population - Other Southern Europe (%)
Place of birth for the foreign-born population - Albania (%)
Place of birth for the foreign-born population - Belarus (%)
Place of birth for the foreign-born population - Bosnia and Herzegovina (%)
Place of birth for the foreign-born population - Bulgaria (%)
Place of birth for the foreign-born population - Croatia (%)
Place of birth for the foreign-born population - Czechoslovakia (%)
Place of birth for the foreign-born population - Hungary (%)
Place of birth for the foreign-born population - Latvia (%)
Place of birth for the foreign-born population - Lithuania (%)
Place of birth for the foreign-born population - North Macedonia (Macedonia) (%)
Place of birth for the foreign-born population - Moldova (%)
Place of birth for the foreign-born population - Poland (%)
Place of birth for the foreign-born population - Romania (%)
Place of birth for the foreign-born population - Russia (%)
Place of birth for the foreign-born population - Serbia (%)
Place of birth for the foreign-born population - Ukraine (%)
Place of birth for the foreign-born population - Other Eastern Europe (%)
Place of birth for the foreign-born population - China (%)
Place of birth for the foreign-born population - Hong Kong (%)
Place of birth for the foreign-born population - Taiwan (%)
Place of birth for the foreign-born population - Japan (%)
Place of birth for the foreign-born population - Korea (%)
Place of birth for the foreign-born population - Other Eastern Asia (%)
Place of birth for the foreign-born population - Afghanistan (%)
Place of birth for the foreign-born population - Bangladesh (%)
Place of birth for the foreign-born population - India (%)
Place of birth for the foreign-born population - Iran (%)
Place of birth for the foreign-born population - Kazakhstan (%)
Place of birth for the foreign-born population - Nepal (%)
Place of birth for the foreign-born population - Pakistan (%)
Place of birth for the foreign-born population - Sri Lanka (%)
Place of birth for the foreign-born population - Uzbekistan (%)
Place of birth for the foreign-born population - Other South Central Asia (%)
Place of birth for the foreign-born population - Burma (%)
Place of birth for the foreign-born population - Cambodia (%)
Place of birth for the foreign-born population - Indonesia (%)
Place of birth for the foreign-born population - Laos (%)
Place of birth for the foreign-born population - Malaysia (%)
Place of birth for the foreign-born population - Philippines (%)
Place of birth for the foreign-born population - Singapore (%)
Place of birth for the foreign-born population - Thailand (%)
Place of birth for the foreign-born population - Vietnam (%)
Place of birth for the foreign-born population - Other South Eastern Asia (%)
Place of birth for the foreign-born population - Armenia (%)
Place of birth for the foreign-born population - Iraq (%)
Place of birth for the foreign-born population - Israel (%)
Place of birth for the foreign-born population - Jordan (%)
Place of birth for the foreign-born population - Kuwait (%)
Place of birth for the foreign-born population - Lebanon (%)
Place of birth for the foreign-born population - Saudi Arabia (%)
Place of birth for the foreign-born population - Syria (%)
Place of birth for the foreign-born population - Turkey (%)
Place of birth for the foreign-born population - Yemen (%)
Place of birth for the foreign-born population - Other Western Asia (%)
Place of birth for the foreign-born population - Eritrea (%)
Place of birth for the foreign-born population - Ethiopia (%)
Place of birth for the foreign-born population - Kenya (%)
Place of birth for the foreign-born population - Somalia (%)
Place of birth for the foreign-born population - Uganda (%)
Place of birth for the foreign-born population - Zimbabwe (%)
Place of birth for the foreign-born population - Other Eastern Africa (%)
Place of birth for the foreign-born population - Cameroon (%)
Place of birth for the foreign-born population - Congo (%)
Place of birth for the foreign-born population - Democratic Republic of Congo (Zaire) (%)
Place of birth for the foreign-born population - Other Middle Africa (%)
Place of birth for the foreign-born population - Egypt (%)
Place of birth for the foreign-born population - Morocco (%)
Place of birth for the foreign-born population - Sudan (%)
Place of birth for the foreign-born population - Other Northern Africa (%)
Place of birth for the foreign-born population - South Africa (%)
Place of birth for the foreign-born population - Other Southern Africa (%)
Place of birth for the foreign-born population - Cabo Verde (%)
Place of birth for the foreign-born population - Ghana (%)
Place of birth for the foreign-born population - Liberia (%)
Place of birth for the foreign-born population - Nigeria (%)
Place of birth for the foreign-born population - Senegal (%)
Place of birth for the foreign-born population - Sierra Leone (%)
Place of birth for the foreign-born population - Other Western Africa (%)
Place of birth for the foreign-born population - Australia (%)
Place of birth for the foreign-born population - New Zealand (%)
Place of birth for the foreign-born population - Fiji (%)
Place of birth for the foreign-born population - Micronesia (%)
Place of birth for the foreign-born population - Bahamas (%)
Place of birth for the foreign-born population - Barbados (%)
Place of birth for the foreign-born population - Cuba (%)
Place of birth for the foreign-born population - Dominica (%)
Place of birth for the foreign-born population - Dominican Republic (%)
Place of birth for the foreign-born population - Grenada (%)
Place of birth for the foreign-born population - Haiti (%)
Place of birth for the foreign-born population - Jamaica (%)
Place of birth for the foreign-born population - St. Vincent and the Grenadines (%)
Place of birth for the foreign-born population - Trinidad and Tobago (%)
Place of birth for the foreign-born population - West Indies (%)
Place of birth for the foreign-born population - Other Caribbean (%)
Place of birth for the foreign-born population - Belize (%)
Place of birth for the foreign-born population - Costa Rica (%)
Place of birth for the foreign-born population - El Salvador (%)
Place of birth for the foreign-born population - Guatemala (%)
Place of birth for the foreign-born population - Honduras (%)
Place of birth for the foreign-born population - Mexico (%)
Place of birth for the foreign-born population - Nicaragua (%)
Place of birth for the foreign-born population - Panama (%)
Place of birth for the foreign-born population - Other Central America (%)
Place of birth for the foreign-born population - Argentina (%)
Place of birth for the foreign-born population - Bolivia (%)
Place of birth for the foreign-born population - Brazil (%)
Place of birth for the foreign-born population - Chile (%)
Place of birth for the foreign-born population - Colombia (%)
Place of birth for the foreign-born population - Ecuador (%)
Place of birth for the foreign-born population - Guyana (%)
Place of birth for the foreign-born population - Peru (%)
Place of birth for the foreign-born population - Uruguay (%)
Place of birth for the foreign-born population - Venezuela (%)
Place of birth for the foreign-born population - Other South America (%)
Place of birth for the foreign-born population - Canada (%)
Place of birth for the foreign-born population - Other Northern America (%)
Place of birth for the foreign-born population - Other (%)
Latest news about races in Plattsburgh, NY collected exclusively by city-data.com from local newspapers, TV, and radio stations
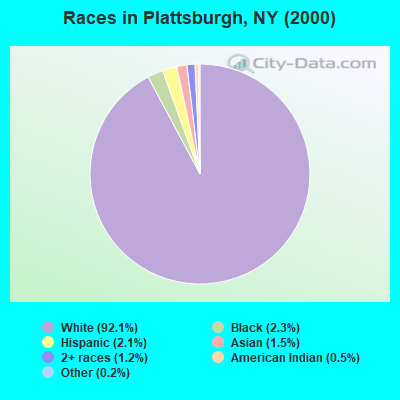
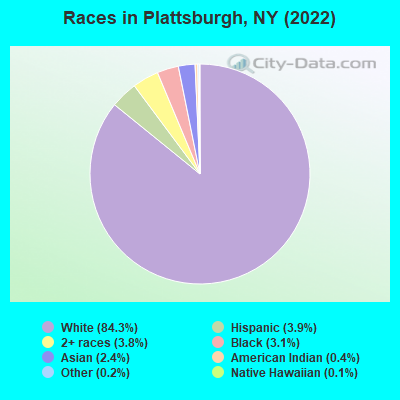
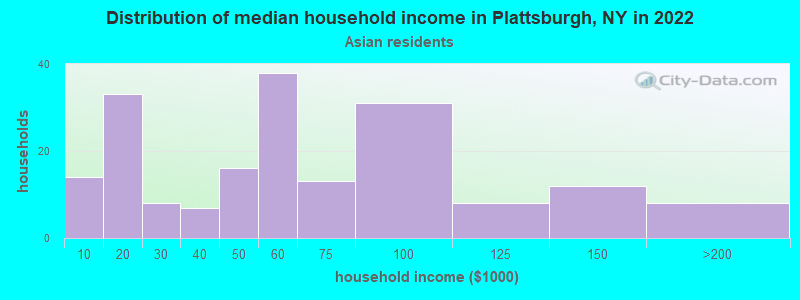
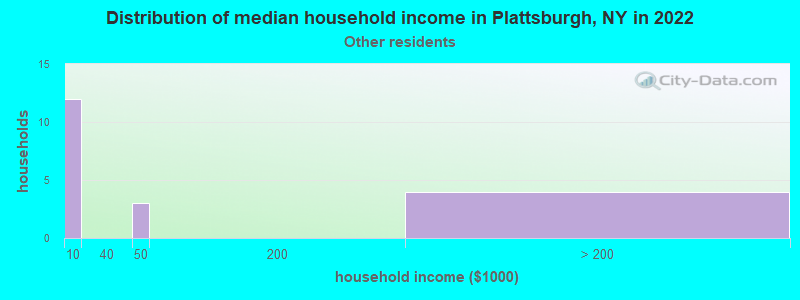
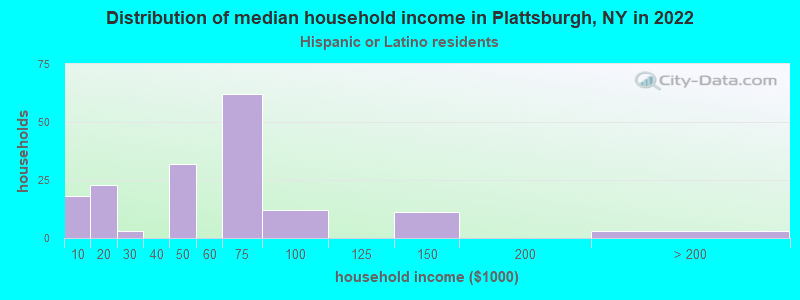
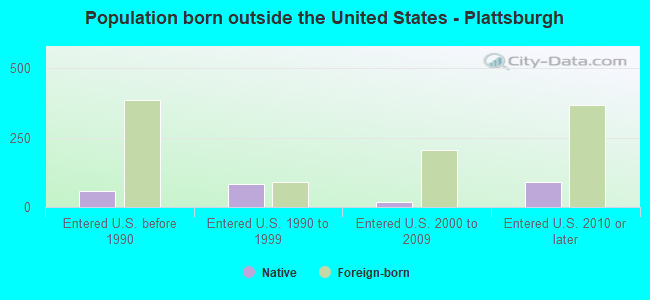
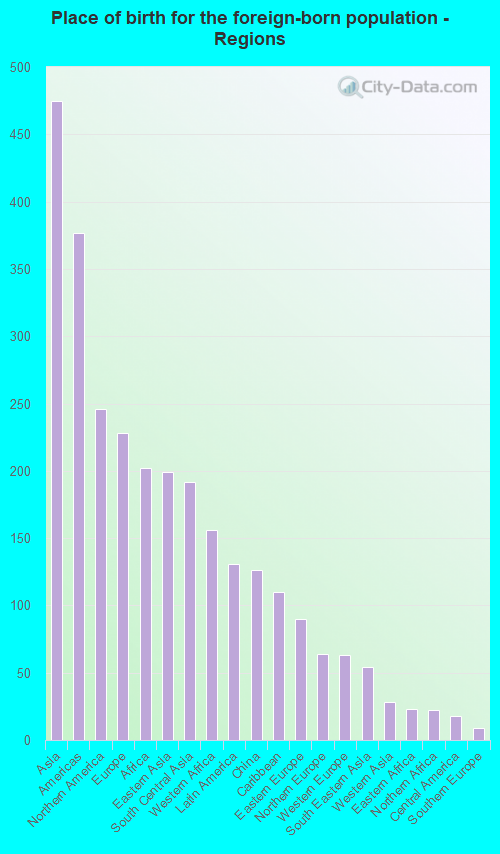
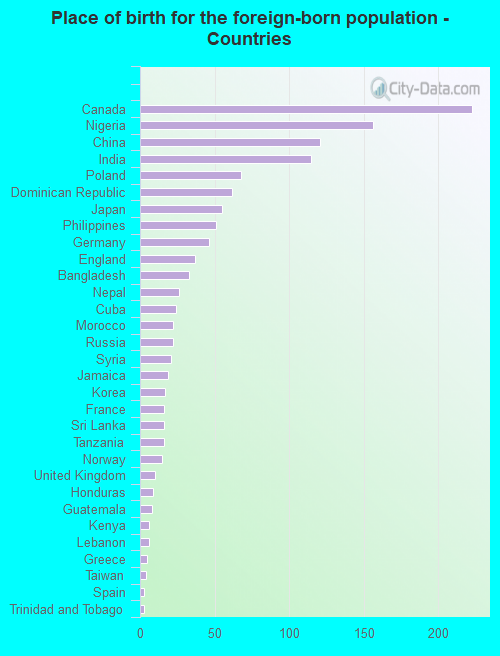
According to 2022 data, the most numerous races in Plattsburgh, NY are White alone (16,551 residents), Hispanic (769 residents), and Black alone (609 residents). 92.0% of Plattsburgh residents speak English at home. 6.5% of Plattsburgh, NY residents are foreign-born (2.4% born in Asia, 1.2% born in North America, 1.2% born in Europe, 1.0% born in Africa, 0.7% born in Latin America), which is 236.4% less than the foreign-born rate of 22.0% across the entire state of New York.
Race distribution in Plattsburgh
2000 2022
11,760,981 62.0% White alone 2,867,583 15.1% Hispanic 2,812,623 14.8% Black alone 1,035,926 5.5% Asian alone 366,116 1.9% Two or more races 75,499 0.4% Other race alone 52,499 0.3% American Indian alone 5,230 0.03% Native Hawaiian and Other
10,408,933 52.9% White alone 3,867,299 19.7% Hispanic 2,633,840 13.4% Black alone 1,776,286 9.0% Asian alone 732,670 3.7% Two or more races 216,110 1.1% Other race alone 35,082 0.2% American Indian alone 6,931 0.04% Native Hawaiian and Other
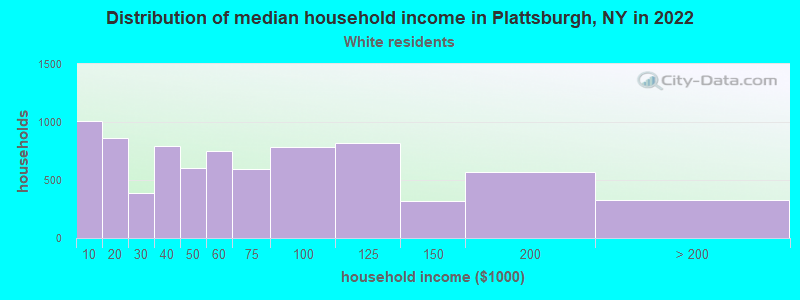
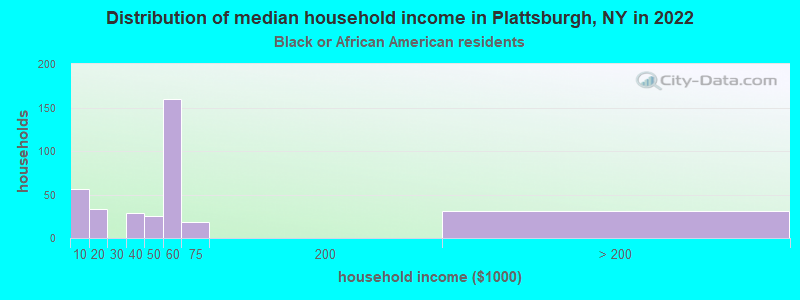
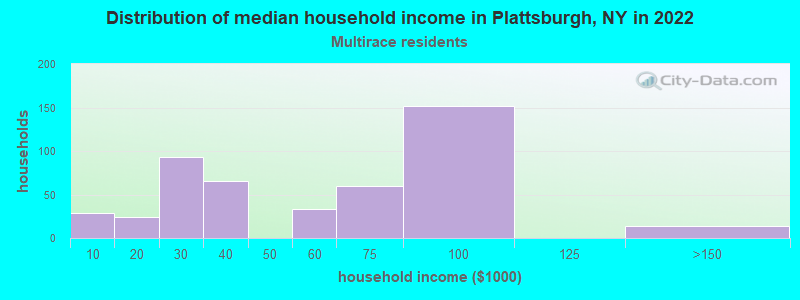
Income and house value in Plattsburgh Median household income in 2022 $54,918 White non-Hispanic householders$54,627 Black householders$56,852 Asian householders$2,534 Some other race householders$27,502 Two or more races householders$60,648 Hispanic or Latino race householdersMedian 2022 house value $196,032 White Non-Hispanic householders$166,214 Black or African American householders $199,054 Asian householders$205,098 Two or more races householders$327,392 Hispanic or Latino householders
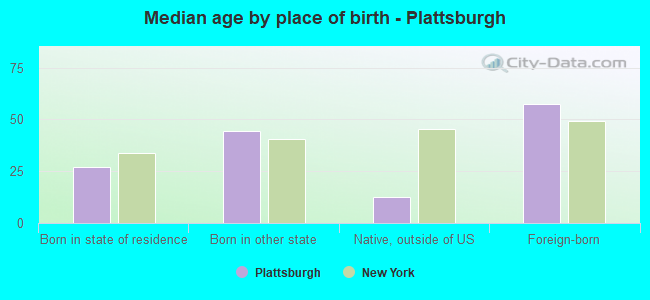
Median age by race in Plattsburgh
33.3 Median age for White residents32.0 35.3 26.8 Median age for Black or African American residents46.7 27.0 20.0 Median age for American Indian / Alaska Native residents24.2 18.8 18.5 Median age for Asian residents54.4 17.1 -666,666,666.0 Median age for Native Hawaiian / Pacific Islander residents-666,666,666.0 -666,666,666.0 21.0 Median age for Other race residents18.5 45.6 45.3 Median age for Two or more races residents40.1 42.9 33.2 Median age for White alone residents32.1 35.2 30.4 Median age for Hispanic or Latino residents32.8 27.1
Owner/renter occupied households by race in Plattsburgh
House owners and renters - White residents 3,200 40.3% Owner occupied4,739 59.7% Renter occupiedHouse owners and renters - Black or African American residents 43 12.1% Owner occupied313 87.9% Renter occupiedHouse owners and renters - American Indian / Alaska Native residents 17 100.0% Renter occupiedHouse owners and renters - Asian residents 75 40.4% Owner occupied111 59.6% Renter occupiedHouse owners and renters - Native Hawaiian / Pacific Islander residents 20 100.0% Renter occupiedHouse owners and renters - Other race residents 4 22.5% Owner occupied14 77.5% Renter occupiedHouse owners and renters - Two or more races residents 146 21.0% Owner occupied549 79.0% Renter occupiedHouse owners and renters - White alone residents 3,168 40.1% Owner occupied4,726 59.9% Renter occupiedHouse owners and renters - Hispanic or Latino residents 95 30.5% Owner occupied216 69.5% Renter occupied
Language usage in Plattsburgh
English speakers - Total 92.0% of residents of Plattsburgh speak English at home.
2.8% of residents speak Spanish at home 490 91.8% Speak English very well44 8.2% Speak English less than very well3.5% of residents speak other language at home 448 67.2% Speak English very well219 32.8% Speak English less than very well
English speakers - Born in the United States 95.7% of residents of Plattsburgh speak English at home.
1.5% of residents speak Spanish at home 43 84.3% Speak English very well8 15.7% Speak English less than very well2.4% of residents speak other language at home 84 100.0% Speak English very well
English speakers - Native, born elsewhere 41.9% of residents of Plattsburgh speak English at home.
30.5% of residents speak Spanish at home 87 95.6% Speak English very well4 4.4% Speak English less than very well6.0% of residents speak other language at home 18 100.0% Speak English very well
English speakers - Foreign-born 36.8% of residents of Plattsburgh speak English at home.
11.8% of residents speak Spanish at home 123 86.0% Speak English very well20 14.0% Speak English less than very well37.5% of residents speak other language at home 261 57.2% Speak English very well195 42.8% Speak English less than very well
White (Caucasian) - Speak only English Native:
97.2% (15,250)Foreign-born:
51.0% (224)
White (Caucasian) - Speak another language Native:
2.5% (400)Foreign-born:
45.6% (200)
Black or African American - Speak only English Native:
92.8% (499)Foreign-born:
11.1% (22)
Black or African American - Speak another language Native:
7.3% (39)Foreign-born:
91.9% (181)
American Indian / Alaska Native - Speak another language Native:
33.0% (61)Foreign-born:
100.0% (3)
Asian - Speak only English Native:
42.0% (91)Foreign-born:
17.3% (73)
Asian - Speak another language Native:
57.9% (125)Foreign-born:
82.3% (349)
Other race - Speak only English Native:
46.6% (122)Foreign-born:
61.2% (10)
Other race - Speak another language Native:
55.4% (145)Foreign-born:
39.9% (7)
Two or more races - Speak only English Native:
88.1% (729)Foreign-born:
4.5% (7)
Two or more races - Speak another language Native:
10.3% (85)Foreign-born:
96.7% (141)
White alone - Speak only English Native:
97.5% (15,216)Foreign-born:
55.1% (220)
White alone - Speak another language Native:
2.3% (359)Foreign-born:
42.0% (168)
Hispanic or Latino - Speak only English Native:
79.0% (387)Foreign-born:
9.2% (17)
Hispanic or Latino - Speak another language Native:
51.0% (250)Foreign-born:
83.0% (150)
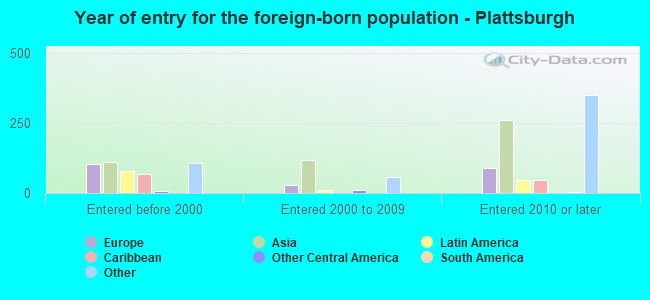
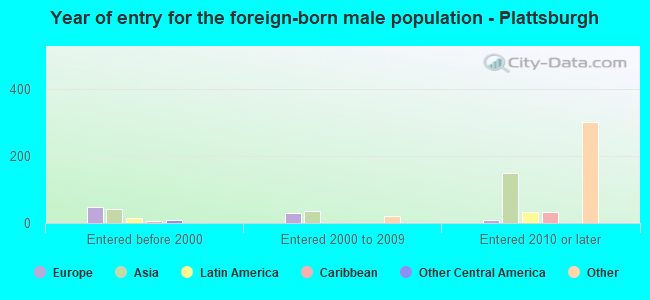
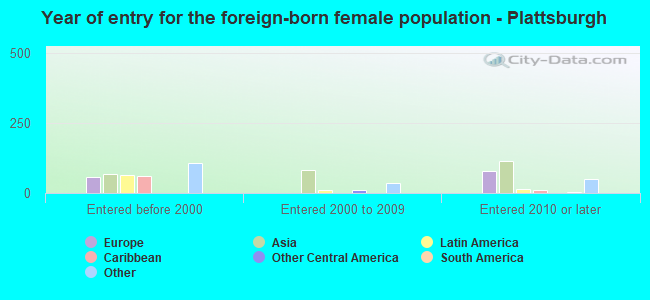
Foreign-born residents in Plattsburgh 1,284 residents are foreign born (2.4% Asia , 1.2% North America , 1.2% Europe , 1.0% Africa , 0.7% Latin America ).
This city:
6.5%New York:
22.6%
Marital status for residents in Plattsburgh Marital status - White (Caucasian) population 15 years and over
Males 51.0% Never married31.5% Now married3.6% Separated1.5% Widowed12.4% DivorcedFemales 46.3% Never married30.5% Now married3.0% Separated9.8% Widowed10.4% DivorcedWomen who gave birth in the past 12 months Now married:
31.2% (47)Unmarried:
68.8% (104)
Women who did not give birth in the past 12 months Now married:
23.5% (1,056)Unmarried:
76.5% (3,428)
Marital status - Black or African American population 15 years and over
Males 33.8% Never married62.5% Now married0.0% Separated0.0% Widowed3.7% DivorcedFemales 79.5% Never married14.5% Now married1.5% Separated2.4% Widowed2.1% DivorcedWomen who gave birth in the past 12 months Now married:
0.0% (0)Unmarried:
100.0% (15)
Women who did not give birth in the past 12 months Now married:
16.8% (44)Unmarried:
83.2% (217)
Marital status - American Indian / Alaska Native population 15 years and over
Males 100.0% Never married0.0% Now married0.0% Separated0.0% Widowed0.0% DivorcedFemales 98.3% Never married1.7% Now married0.0% Separated0.0% Widowed0.0% DivorcedWomen who did not give birth in the past 12 months Now married:
1.7% (3)Unmarried:
98.3% (164)
Marital status - Asian population 15 years and over
Males 62.1% Never married29.8% Now married2.9% Separated2.6% Widowed2.6% DivorcedFemales 71.3% Never married12.6% Now married3.1% Separated4.8% Widowed8.1% DivorcedWomen who gave birth in the past 12 months Now married:
0.0% (0)Unmarried:
100.0% (22)
Women who did not give birth in the past 12 months Now married:
5.4% (15)Unmarried:
94.6% (261)
Marital status - Other race population 15 years and over
Males 96.7% Never married3.3% Now married0.0% Separated0.0% Widowed0.0% DivorcedFemales 95.6% Never married0.0% Now married0.0% Separated4.4% Widowed0.0% DivorcedWomen who gave birth in the past 12 months Now married:
0.0% (0)Unmarried:
100.0% (2)
Women who did not give birth in the past 12 months Now married:
0.0% (0)Unmarried:
100.0% (163)
Marital status - Two or more races population 15 years and over
Males 64.8% Never married29.6% Now married4.1% Separated1.5% Widowed0.0% DivorcedFemales 71.6% Never married19.4% Now married0.0% Separated2.2% Widowed6.9% DivorcedWomen who did not give birth in the past 12 months Now married:
7.0% (32)Unmarried:
93.0% (424)
Marital status - White alone, not Hispanic / Latino population 15 years and over
Males 50.9% Never married31.5% Now married3.6% Separated1.5% Widowed12.5% DivorcedFemales 46.1% Never married30.7% Now married3.0% Separated9.7% Widowed10.5% DivorcedWomen who gave birth in the past 12 months Now married:
25.5% (36)Unmarried:
74.5% (105)
Women who did not give birth in the past 12 months Now married:
23.7% (1,048)Unmarried:
76.3% (3,367)
Marital status - Hispanic or Latino population 15 years and over
Males 90.2% Never married9.8% Now married0.0% Separated0.0% Widowed0.0% DivorcedFemales 74.6% Never married19.4% Now married0.0% Separated6.0% Widowed0.0% DivorcedWomen who gave birth in the past 12 months Now married:
85.7% (12)Unmarried:
14.3% (2)
Women who did not give birth in the past 12 months Now married:
4.3% (16)Unmarried:
95.7% (348)
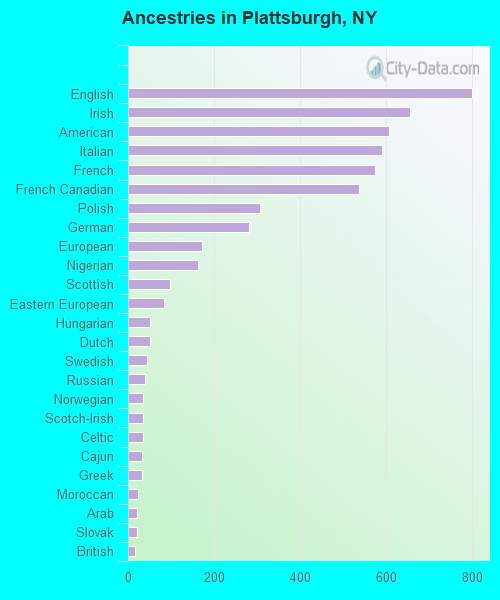
Ancestries in Plattsburgh
799 11.2% English655 9.2% Irish607 8.5% American590 8.3% Italian575 8.0% French537 7.5% French Canadian307 4.3% Polish282 3.9% German171 2.4% European162 2.3% Nigerian98 1.4% Scottish83 1.2% Eastern European51 0.7% Hungarian50 0.7% Dutch43 0.6% Swedish40 0.6% Russian34 0.5% Norwegian34 0.5% Scotch-Irish34 0.5% Celtic32 0.4% Cajun32 0.4% Greek23 0.3% Moroccan20 0.3% Arab20 0.3% Slovak17 0.2% British17 0.2% Haitian16 0.2% Israeli13 0.2% Scandinavian13 0.2% Jamaican11 0.2% Canadian11 0.2% African8 0.1% Lebanese7 0.10% Armenian7 0.10% Ghanaian7 0.10% Kenyan4 0.06% Guyanese4 0.06% Trinidadian and Tobagonian
Geographical mobility in Plattsburgh Same house 1 year ago 12,726 76.8% White (Caucasian)594 76.3% Black or African American187 93.2% American Indian / Alaska Native408 64.1% Asian187 60.4% Other race681 66.4% Two or more races12,705 77.2% White alone, not Hispanic / Latino392 51.7% Hispanic or LatinoMoved within same county 2,129 12.9% White / Caucasian75 9.6% Black or African American11 5.7% American Indian / Alaska Native60 9.4% Asian27 100.0% Native Hawaiian / Pacific Islander297 29.0% Two or more races2,081 12.6% White alone, not Hispanic / Latino141 18.6% Hispanic or LatinoMoved within same state 1,097 6.6% White / Caucasian90 11.5% Black or African American72 11.3% Asian120 38.9% Other race38 3.7% Two or more races1,081 6.6% White alone, not Hispanic / Latino219 28.9% Hispanic or LatinoMoved from different state 618 3.7% White / Caucasian27 3.4% Black or African American1 0.7% American Indian / Alaska Native42 6.6% Asian9 0.9% Two or more races618 3.8% White alone, not Hispanic / Latino4 0.5% Hispanic or LatinoMoved from abroad 60 0.4% White65 10.2% Asian67 0.4% White alone, not Hispanic / Latino
Children Nativity (place of birth) in Plattsburgh
Children under 6 years - Living with two parents Both parents native 358 100.0% NativeOne native, one foreign-born parent 28 100.0% NativeChildren under 6 years - Living with one parent Native parent 427 100.0% NativeChildren 6 to 17 years - Living with two parents Both parents native 663 98.4% Native11 1.6% Foreign-bornBoth parents foreign-born 19 72.0% Native7 28.0% Foreign-bornOne native, one foreign-born parent 163 100.0% NativeChildren 6 to 17 years - Living with one parent Native parent 1,033 100.0% Native
Grandparents responsible for own grandchildren in Plattsburgh
Grandparents (30 to 59 years) White / Caucasian 44 83.0% Responsible for grandchildren9 17.0% Not responsible for grandchildrenWhite alone, not Hispanic / Latino 47 81.5% Responsible for grandchildren11 18.5% Not responsible for grandchildrenGrandparents (60 years and over) White / Caucasian 53 58.4% Responsible for grandchildren38 41.6% Not responsible for grandchildrenWhite alone, not Hispanic / Latino 57 58.6% Responsible for grandchildren40 41.4% Not responsible for grandchildren