Races in Pleasant Lake, Minnesota (MN) Detailed Stats
Ancestries, Foreign-born residents, place of birth

Discuss Pleasant Lake, Minnesota races on our local forum with over 2,400,000 registered users
0.8% of Pleasant Lake, MN residents are foreign-born , which is 908.0% less than the foreign-born rate of 8.0% across the entire state of Minnesota.
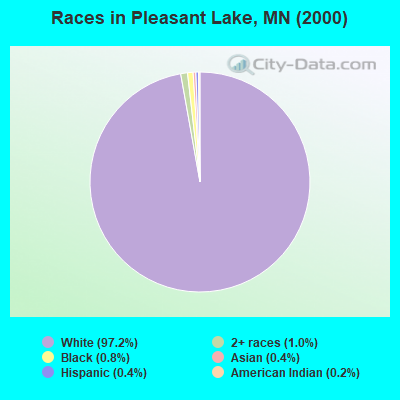
Race distribution in Pleasant Lake

- 49097.2%White alone
- 51.0%Two or more races
- 40.8%Black alone
- 20.4%Hispanic
- 20.4%Asian alone
- 10.2%American Indian alone
2000
2022
-
- 4,337,14388.2%White alone
- 168,8133.4%Black alone
- 143,3822.9%Hispanic
- 141,0832.9%Asian alone
- 70,3041.4%Two or more races
- 52,0091.1%American Indian alone
- 5,0310.1%Other race alone
- 1,7140.03%Native Hawaiian and Other
Pacific Islander alone

-
- 4,356,34776.2%White alone
- 395,1796.9%Black alone
- 333,8305.8%Hispanic
- 294,8005.2%Asian alone
- 259,6494.5%Two or more races
- 42,1250.7%American Indian alone
- 32,9760.6%Other race alone
- 2,2780.04%Native Hawaiian and Other
Pacific Islander alone

Income and house value in Pleasant Lake
- Median household income in 2022
- $96,641White non-Hispanic householders
- over $200,000Asian householders
- over $200,000Hispanic or Latino race householders
- Median 2022 house value
- $385,090White Non-Hispanic householders
- $586,630Asian householders
- $358,496Hispanic or Latino householders
Household income for White non-Hispanic householders

Household income for Asian householders

Household income for Hispanic or Latino race householders

Foreign-born residents in Pleasant Lake
4 residents are foreign born
| This city: | 0.8% |
| Minnesota: | 5.3% |
Ancestries in Pleasant Lake

- 29048.0%German
- 609.9%Polish
- 609.9%Swedish
- 457.5%Other
- 396.5%Norwegian
- 213.5%Irish
- 193.1%English
- 132.2%Czech
- 132.2%French
- 101.7%Slovak
- 91.5%United States
- 81.3%Dutch
- 50.8%Russian
- 50.8%Scotch-Irish
- 30.5%Swiss
- 20.3%Danish
- 20.3%Welsh

Zip codes: 56301.