Races in Pleasant View, Utah (UT) Detailed Stats
Data:
Races - White alone (%)
Races - White alone (% change since 2000)
Races - Black alone (%)
Races - Black alone (% change since 2000)
Races - American Indian alone (%)
Races - American Indian alone (% change since 2000)
Races - Asian alone (%)
Races - Asian alone (% change since 2000)
Races - Hispanic (%)
Races - Hispanic (% change since 2000)
Races - Native Hawaiian and Other Pacific Islander alone (%)
Races - Native Hawaiian and Other Pacific Islander alone (% change since 2000)
Races - Two or more races(%)
Races - Two or more races(% change since 2000)
Races - Other race alone (%)
Races - Other race alone (% change since 2000)
Racial diversity
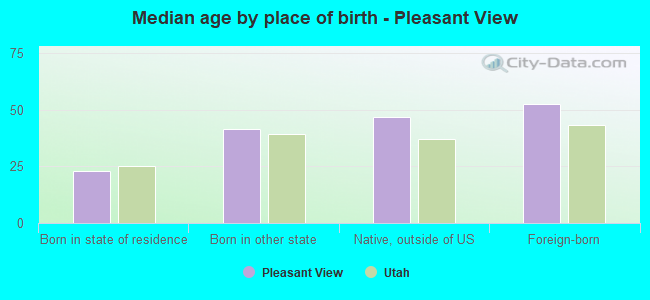
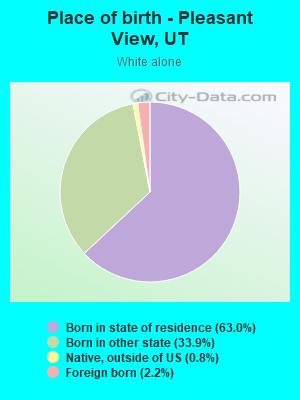
Place of birth - Born in state of residence (%)
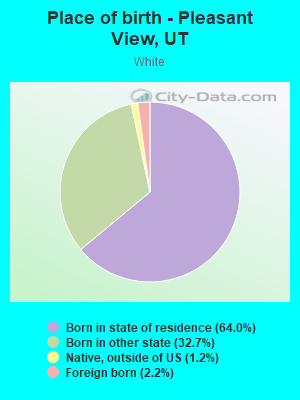
Place of birth - Born in state of residence (%) - White
Place of birth - Born in state of residence (%) - Black or African American
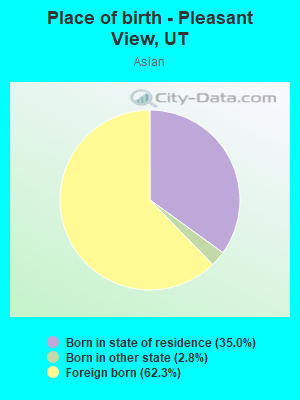
Place of birth - Born in state of residence (%) - Asian
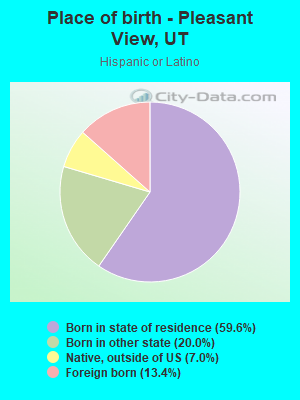
Place of birth - Born in state of residence (%) - Hispanic or Latino
Place of birth - Born in state of residence (%) - American Indian and Alaska Native
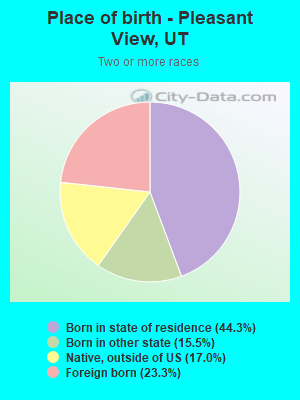
Place of birth - Born in state of residence (%) - Multirace
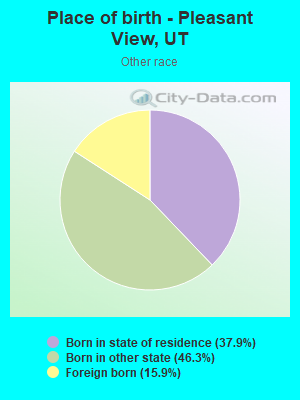
Place of birth - Born in state of residence (%) - Other Race
Place of birth - Born in other state (%)
Place of birth - Born in other state (%) - White
Place of birth - Born in other state (%) - Black or African American
Place of birth - Born in other state (%) - Asian
Place of birth - Born in other state (%) - Hispanic or Latino
Place of birth - Born in other state (%) - American Indian and Alaska Native
Place of birth - Born in other state (%) - Multirace
Place of birth - Born in other state (%) - Other Race
Place of birth - Native, outside of US (%)
Place of birth - Native, outside of US (%) - White
Place of birth - Native, outside of US (%) - Black or African American
Place of birth - Native, outside of US (%) - Asian
Place of birth - Native, outside of US (%) - Hispanic or Latino
Place of birth - Native, outside of US (%) - American Indian and Alaska Native
Place of birth - Native, outside of US (%) - Multirace
Place of birth - Native, outside of US (%) - Other Race
Place of birth - Foreign born (%)
Place of birth - Foreign born (%) - White
Place of birth - Foreign born (%) - Black or African American
Place of birth - Foreign born (%) - Asian
Place of birth - Foreign born (%) - Hispanic or Latino
Place of birth - Foreign born (%) - American Indian and Alaska Native
Place of birth - Foreign born (%) - Multirace
Place of birth - Foreign born (%) - Other Race
Residents speaking English at home (%)
Residents speaking English at home - Born in the United States (%)
Residents speaking English at home - Native, born elsewhere (%)
Residents speaking English at home - Foreign born (%)
Residents speaking Spanish at home (%)
Residents speaking Spanish at home - Born in the United States (%)
Residents speaking Spanish at home - Native, born elsewhere (%)
Residents speaking Spanish at home - Foreign born (%)
Residents speaking other language at home (%)
Residents speaking other language at home - Born in the United States (%)
Residents speaking other language at home - Native, born elsewhere (%)
Residents speaking other language at home - Foreign born (%)
Marital status - Never married (%)
Marital status - Now married (%)
Marital status - Separated (%)
Marital status - Widowed (%)
Marital status - Divorced (%)
Ancestries Reported - Arab (%)
Ancestries Reported - Czech (%)
Ancestries Reported - Danish (%)
Ancestries Reported - Dutch (%)
Ancestries Reported - English (%)
Ancestries Reported - French (%)
Ancestries Reported - French Canadian (%)
Ancestries Reported - German (%)
Ancestries Reported - Greek (%)
Ancestries Reported - Hungarian (%)
Ancestries Reported - Irish (%)
Ancestries Reported - Italian (%)
Ancestries Reported - Lithuanian (%)
Ancestries Reported - Norwegian (%)
Ancestries Reported - Polish (%)
Ancestries Reported - Portuguese (%)
Ancestries Reported - Russian (%)
Ancestries Reported - Scotch-Irish (%)
Ancestries Reported - Scottish (%)
Ancestries Reported - Slovak (%)
Ancestries Reported - Subsaharan African (%)
Ancestries Reported - Swedish (%)
Ancestries Reported - Swiss (%)
Ancestries Reported - Ukrainian (%)
Ancestries Reported - United States (%)
Ancestries Reported - Welsh (%)
Ancestries Reported - West Indian (%)
Ancestries Reported - Other (%)
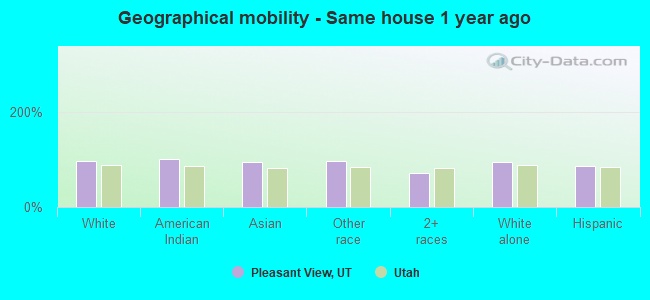
Geographical mobility - Same house 1 year ago (%)
Geographical mobility - Same house 1 year ago (%) - White
Geographical mobility - Same house 1 year ago (%) - Black or African American
Geographical mobility - Same house 1 year ago (%) - Asian
Geographical mobility - Same house 1 year ago (%) - Hispanic or Latino
Geographical mobility - Same house 1 year ago (%) - American Indian and Alaska Native
Geographical mobility - Same house 1 year ago (%) - Multirace
Geographical mobility - Same house 1 year ago (%) - Other Race
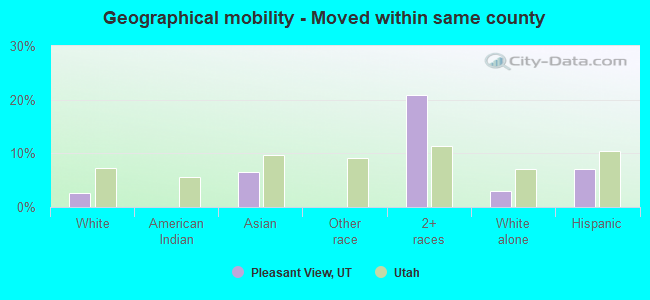
Geographical mobility - Moved within same county (%)
Geographical mobility - Moved within same county (%) - White
Geographical mobility - Moved within same county (%) - Black or African American
Geographical mobility - Moved within same county (%) - Asian
Geographical mobility - Moved within same county (%) - Hispanic or Latino
Geographical mobility - Moved within same county (%) - American Indian and Alaska Native
Geographical mobility - Moved within same county (%) - Multirace
Geographical mobility - Moved within same county (%) - Other Race
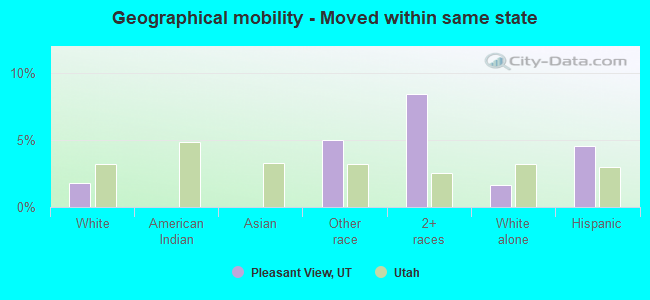
Geographical mobility - Moved from different county within same state (%)
Geographical mobility - Moved from different county within same state (%) - White
Geographical mobility - Moved from different county within same state (%) - Black or African American
Geographical mobility - Moved from different county within same state (%) - Asian
Geographical mobility - Moved from different county within same state (%) - Hispanic or Latino
Geographical mobility - Moved from different county within same state (%) - American Indian and Alaska Native
Geographical mobility - Moved from different county within same state (%) - Multirace
Geographical mobility - Moved from different county within same state (%) - Other Race
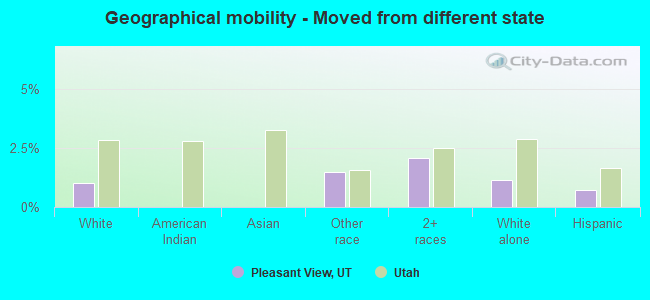
Geographical mobility - Moved from different state (%)
Geographical mobility - Moved from different state (%) - White
Geographical mobility - Moved from different state (%) - Black or African American
Geographical mobility - Moved from different state (%) - Asian
Geographical mobility - Moved from different state (%) - Hispanic or Latino
Geographical mobility - Moved from different state (%) - American Indian and Alaska Native
Geographical mobility - Moved from different state (%) - Multirace
Geographical mobility - Moved from different state (%) - Other Race
Geographical mobility - Moved from abroad (%)
Geographical mobility - Moved from abroad (%) - White
Geographical mobility - Moved from abroad (%) - Black or African American
Geographical mobility - Moved from abroad (%) - Asian
Geographical mobility - Moved from abroad (%) - Hispanic or Latino
Geographical mobility - Moved from abroad (%) - American Indian and Alaska Native
Geographical mobility - Moved from abroad (%) - Multirace
Geographical mobility - Moved from abroad (%) - Other Race
Place of birth for the foreign-born population - Ireland (%)
Place of birth for the foreign-born population - Denmark (%)
Place of birth for the foreign-born population - Norway (%)
Place of birth for the foreign-born population - Sweden (%)
Place of birth for the foreign-born population - United Kingdom (%)
Place of birth for the foreign-born population - England (%)
Place of birth for the foreign-born population - Scotland (%)
Place of birth for the foreign-born population - Other Northern Europe (%)
Place of birth for the foreign-born population - Austria (%)
Place of birth for the foreign-born population - Belgium (%)
Place of birth for the foreign-born population - France (%)
Place of birth for the foreign-born population - Germany (%)
Place of birth for the foreign-born population - Netherlands (%)
Place of birth for the foreign-born population - Switzerland (%)
Place of birth for the foreign-born population - Other Western Europe (%)
Place of birth for the foreign-born population - Greece (%)
Place of birth for the foreign-born population - Italy (%)
Place of birth for the foreign-born population - Portugal (%)
Place of birth for the foreign-born population - Spain (%)
Place of birth for the foreign-born population - Other Southern Europe (%)
Place of birth for the foreign-born population - Albania (%)
Place of birth for the foreign-born population - Belarus (%)
Place of birth for the foreign-born population - Bosnia and Herzegovina (%)
Place of birth for the foreign-born population - Bulgaria (%)
Place of birth for the foreign-born population - Croatia (%)
Place of birth for the foreign-born population - Czechoslovakia (%)
Place of birth for the foreign-born population - Hungary (%)
Place of birth for the foreign-born population - Latvia (%)
Place of birth for the foreign-born population - Lithuania (%)
Place of birth for the foreign-born population - North Macedonia (Macedonia) (%)
Place of birth for the foreign-born population - Moldova (%)
Place of birth for the foreign-born population - Poland (%)
Place of birth for the foreign-born population - Romania (%)
Place of birth for the foreign-born population - Russia (%)
Place of birth for the foreign-born population - Serbia (%)
Place of birth for the foreign-born population - Ukraine (%)
Place of birth for the foreign-born population - Other Eastern Europe (%)
Place of birth for the foreign-born population - China (%)
Place of birth for the foreign-born population - Hong Kong (%)
Place of birth for the foreign-born population - Taiwan (%)
Place of birth for the foreign-born population - Japan (%)
Place of birth for the foreign-born population - Korea (%)
Place of birth for the foreign-born population - Other Eastern Asia (%)
Place of birth for the foreign-born population - Afghanistan (%)
Place of birth for the foreign-born population - Bangladesh (%)
Place of birth for the foreign-born population - India (%)
Place of birth for the foreign-born population - Iran (%)
Place of birth for the foreign-born population - Kazakhstan (%)
Place of birth for the foreign-born population - Nepal (%)
Place of birth for the foreign-born population - Pakistan (%)
Place of birth for the foreign-born population - Sri Lanka (%)
Place of birth for the foreign-born population - Uzbekistan (%)
Place of birth for the foreign-born population - Other South Central Asia (%)
Place of birth for the foreign-born population - Burma (%)
Place of birth for the foreign-born population - Cambodia (%)
Place of birth for the foreign-born population - Indonesia (%)
Place of birth for the foreign-born population - Laos (%)
Place of birth for the foreign-born population - Malaysia (%)
Place of birth for the foreign-born population - Philippines (%)
Place of birth for the foreign-born population - Singapore (%)
Place of birth for the foreign-born population - Thailand (%)
Place of birth for the foreign-born population - Vietnam (%)
Place of birth for the foreign-born population - Other South Eastern Asia (%)
Place of birth for the foreign-born population - Armenia (%)
Place of birth for the foreign-born population - Iraq (%)
Place of birth for the foreign-born population - Israel (%)
Place of birth for the foreign-born population - Jordan (%)
Place of birth for the foreign-born population - Kuwait (%)
Place of birth for the foreign-born population - Lebanon (%)
Place of birth for the foreign-born population - Saudi Arabia (%)
Place of birth for the foreign-born population - Syria (%)
Place of birth for the foreign-born population - Turkey (%)
Place of birth for the foreign-born population - Yemen (%)
Place of birth for the foreign-born population - Other Western Asia (%)
Place of birth for the foreign-born population - Eritrea (%)
Place of birth for the foreign-born population - Ethiopia (%)
Place of birth for the foreign-born population - Kenya (%)
Place of birth for the foreign-born population - Somalia (%)
Place of birth for the foreign-born population - Uganda (%)
Place of birth for the foreign-born population - Zimbabwe (%)
Place of birth for the foreign-born population - Other Eastern Africa (%)
Place of birth for the foreign-born population - Cameroon (%)
Place of birth for the foreign-born population - Congo (%)
Place of birth for the foreign-born population - Democratic Republic of Congo (Zaire) (%)
Place of birth for the foreign-born population - Other Middle Africa (%)
Place of birth for the foreign-born population - Egypt (%)
Place of birth for the foreign-born population - Morocco (%)
Place of birth for the foreign-born population - Sudan (%)
Place of birth for the foreign-born population - Other Northern Africa (%)
Place of birth for the foreign-born population - South Africa (%)
Place of birth for the foreign-born population - Other Southern Africa (%)
Place of birth for the foreign-born population - Cabo Verde (%)
Place of birth for the foreign-born population - Ghana (%)
Place of birth for the foreign-born population - Liberia (%)
Place of birth for the foreign-born population - Nigeria (%)
Place of birth for the foreign-born population - Senegal (%)
Place of birth for the foreign-born population - Sierra Leone (%)
Place of birth for the foreign-born population - Other Western Africa (%)
Place of birth for the foreign-born population - Australia (%)
Place of birth for the foreign-born population - New Zealand (%)
Place of birth for the foreign-born population - Fiji (%)
Place of birth for the foreign-born population - Micronesia (%)
Place of birth for the foreign-born population - Bahamas (%)
Place of birth for the foreign-born population - Barbados (%)
Place of birth for the foreign-born population - Cuba (%)
Place of birth for the foreign-born population - Dominica (%)
Place of birth for the foreign-born population - Dominican Republic (%)
Place of birth for the foreign-born population - Grenada (%)
Place of birth for the foreign-born population - Haiti (%)
Place of birth for the foreign-born population - Jamaica (%)
Place of birth for the foreign-born population - St. Vincent and the Grenadines (%)
Place of birth for the foreign-born population - Trinidad and Tobago (%)
Place of birth for the foreign-born population - West Indies (%)
Place of birth for the foreign-born population - Other Caribbean (%)
Place of birth for the foreign-born population - Belize (%)
Place of birth for the foreign-born population - Costa Rica (%)
Place of birth for the foreign-born population - El Salvador (%)
Place of birth for the foreign-born population - Guatemala (%)
Place of birth for the foreign-born population - Honduras (%)
Place of birth for the foreign-born population - Mexico (%)
Place of birth for the foreign-born population - Nicaragua (%)
Place of birth for the foreign-born population - Panama (%)
Place of birth for the foreign-born population - Other Central America (%)
Place of birth for the foreign-born population - Argentina (%)
Place of birth for the foreign-born population - Bolivia (%)
Place of birth for the foreign-born population - Brazil (%)
Place of birth for the foreign-born population - Chile (%)
Place of birth for the foreign-born population - Colombia (%)
Place of birth for the foreign-born population - Ecuador (%)
Place of birth for the foreign-born population - Guyana (%)
Place of birth for the foreign-born population - Peru (%)
Place of birth for the foreign-born population - Uruguay (%)
Place of birth for the foreign-born population - Venezuela (%)
Place of birth for the foreign-born population - Other South America (%)
Place of birth for the foreign-born population - Canada (%)
Place of birth for the foreign-born population - Other Northern America (%)
Place of birth for the foreign-born population - Other (%)
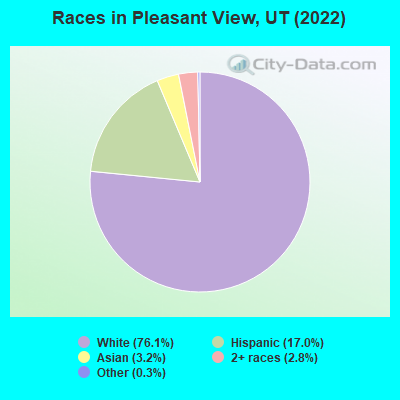
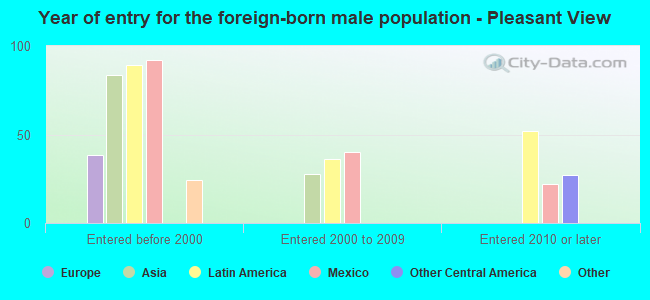
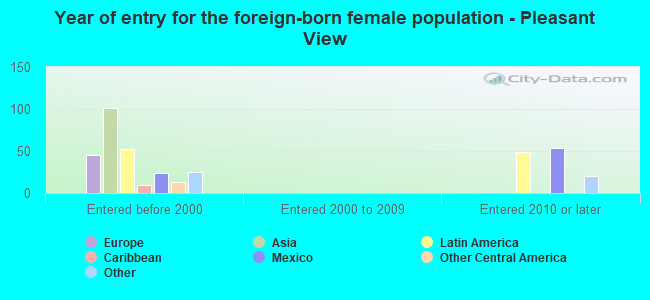
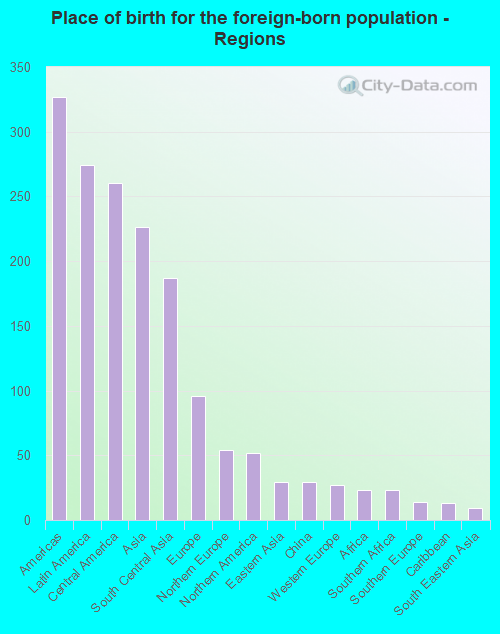
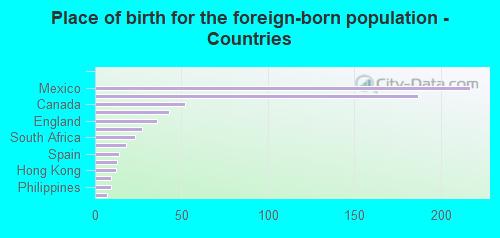
According to 2022 data, the most numerous races in Pleasant View, UT are White alone (8,539 residents), Hispanic (1,910 residents), and Two or more races (315 residents). 84.7% of Pleasant View residents speak English at home. 6.0% of Pleasant View, UT residents are foreign-born (2.4% born in Latin America, 2.0% born in Asia, 0.8% born in Europe), which is 33.3% less than the foreign-born rate of 8.0% across the entire state of Utah.
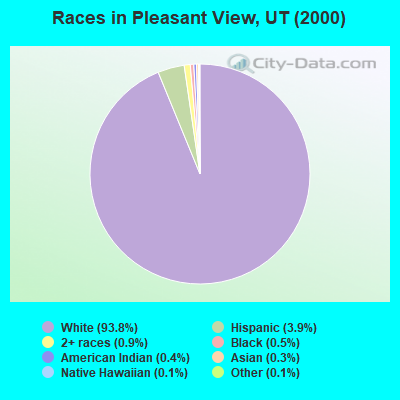
Race distribution in Pleasant View
2000 2022
1,904,265 85.3% White alone 201,559 9.0% Hispanic 36,483 1.6% Asian alone 31,308 1.4% Two or more races 26,663 1.2% American Indian alone 14,806 0.7% Native Hawaiian and Other 16,137 0.7% Black alone 1,948 0.09% Other race alone
2,557,466 75.6% White alone 512,086 15.1% Hispanic 119,308 3.5% Two or more races 82,388 2.4% Asian alone 36,978 1.1% Native Hawaiian and Other 34,873 1.0% Black alone 22,803 0.7% American Indian alone 14,898 0.4% Other race alone
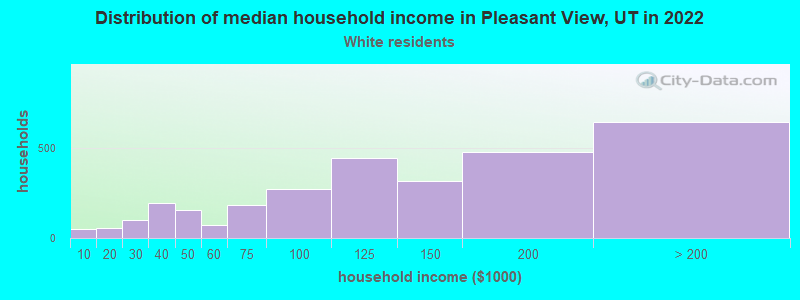
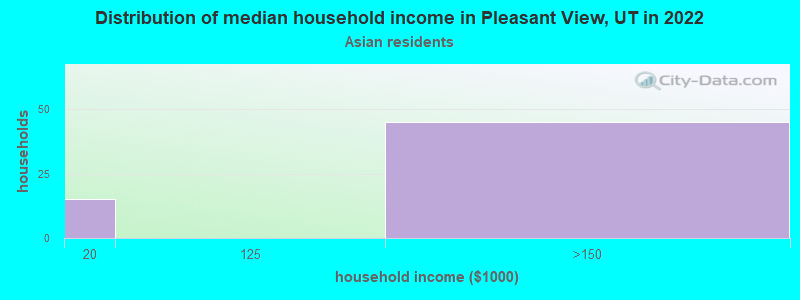
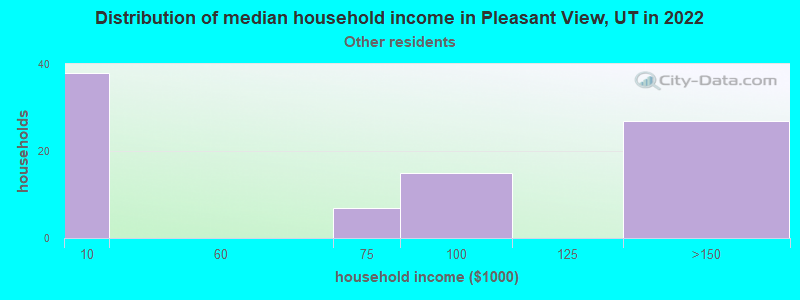
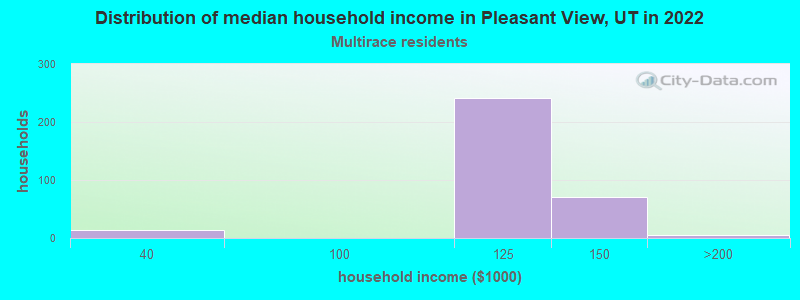
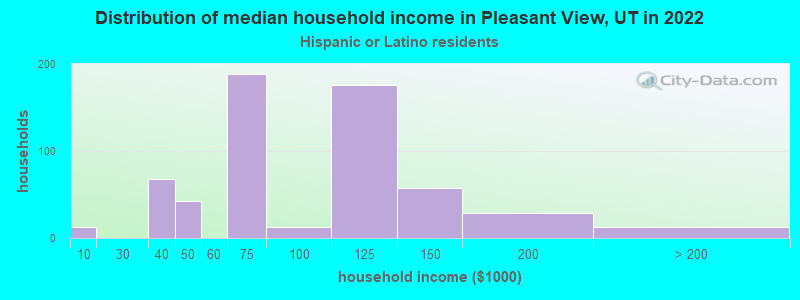
Income and house value in Pleasant View Median household income in 2022 $131,906 White non-Hispanic householders$89,985 Asian householders$129,952 Two or more races householders$72,466 Hispanic or Latino race householdersMedian 2022 house value $674,985 White Non-Hispanic householders$671,760 Black or African American householders$806,112 Some other race householders$577,176 Hispanic or Latino householders
Median age by race in Pleasant View
35.2 Median age for White residents36.6 32.6 -680,351,905.5 Median age for Black or African American residents-682,839,172.7 -745,098,038.5 -692,982,455.4 Median age for American Indian / Alaska Native residents-673,245,613.4 -688,311,687.6 28.5 Median age for Asian residents21.8 30.8 -1,217,647,057.6 Median age for Native Hawaiian / Pacific Islander residents-1,563,046,190.7 -664,285,713.6 29.6 Median age for Other race residents29.3 11.1 23.9 Median age for Two or more races residents19.2 36.1 39.8 Median age for White alone residents42.0 36.2 19.4 Median age for Hispanic or Latino residents17.3 30.3
Owner/renter occupied households by race in Pleasant View
House owners and renters - White residents 2,554 87.3% Owner occupied370 12.7% Renter occupiedHouse owners and renters - Asian residents 46 100.0% Owner occupiedHouse owners and renters - Other race residents 35 57.6% Owner occupied26 42.4% Renter occupiedHouse owners and renters - Two or more races residents 228 61.9% Owner occupied140 38.1% Renter occupiedHouse owners and renters - White alone residents 2,380 90.3% Owner occupied256 9.7% Renter occupiedHouse owners and renters - Hispanic or Latino residents 356 56.7% Owner occupied271 43.3% Renter occupied
Language usage in Pleasant View
English speakers - Total 84.7% of residents of Pleasant View speak English at home.
10.0% of residents speak Spanish at home 903 85.2% Speak English very well157 14.8% Speak English less than very well4.8% of residents speak other language at home 364 72.5% Speak English very well138 27.5% Speak English less than very well
English speakers - Born in the United States 88.8% of residents of Pleasant View speak English at home.
10.0% of residents speak Spanish at home 280 82.1% Speak English very well61 17.9% Speak English less than very well0.3% of residents speak other language at home 10 100.0% Speak English very well
English speakers - Native, born elsewhere 87.0% of residents of Pleasant View speak English at home.
English speakers - Foreign-born 20.8% of residents of Pleasant View speak English at home.
40.4% of residents speak Spanish at home 182 67.9% Speak English very well86 32.1% Speak English less than very well37.7% of residents speak other language at home 143 57.2% Speak English very well107 42.8% Speak English less than very well
White (Caucasian) - Speak only English Native:
93.1% (8,070)Foreign-born:
52.8% (110)
White (Caucasian) - Speak another language Native:
6.8% (592)Foreign-born:
57.4% (120)
Asian - Speak only English Native:
4.9% (7)Foreign-born:
17.6% (36)
Asian - Speak another language Native:
92.0% (128)Foreign-born:
81.5% (169)
Other race - Speak another language Native:
47.8% (124)Foreign-born:
99.0% (57)
Two or more races - Speak another language Native:
20.8% (155)Foreign-born:
100.0% (241)
White alone - Speak only English Native:
93.6% (7,580)Foreign-born:
68.5% (129)
White alone - Speak another language Native:
5.9% (479)Foreign-born:
32.8% (62)
Hispanic or Latino - Speak another language Native:
25.8% (313)Foreign-born:
100.0% (263)
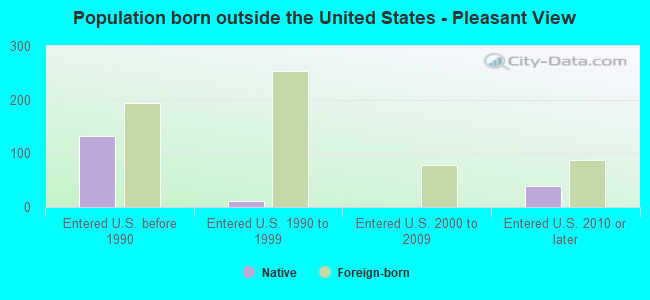
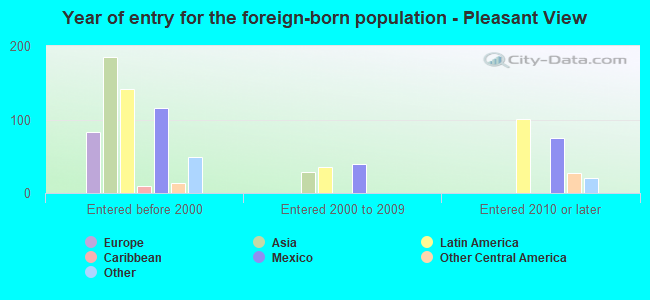
Foreign-born residents in Pleasant View 673 residents are foreign born (2.4% Latin America , 2.0% Asia , 0.8% Europe ).
Marital status for residents in Pleasant View Marital status - White (Caucasian) population 15 years and over
Males 23.3% Never married70.3% Now married0.5% Separated0.9% Widowed5.0% DivorcedFemales 20.7% Never married64.9% Now married0.0% Separated5.3% Widowed9.1% DivorcedWomen who gave birth in the past 12 months Now married:
100.0% (141)Unmarried:
0.0% (0)
Women who did not give birth in the past 12 months Now married:
55.5% (1,128)Unmarried:
44.5% (904)
Marital status - Asian population 15 years and over
Males 50.4% Never married49.6% Now married0.0% Separated0.0% Widowed0.0% DivorcedFemales 54.3% Never married38.2% Now married0.0% Separated0.0% Widowed7.5% DivorcedWomen who did not give birth in the past 12 months Now married:
25.0% (51)Unmarried:
75.0% (153)
Marital status - Other race population 15 years and over
Males 65.3% Never married0.0% Now married11.0% Separated17.9% Widowed5.8% DivorcedFemales 39.4% Never married0.0% Now married60.6% Separated0.0% Widowed0.0% DivorcedWomen who did not give birth in the past 12 months Now married:
60.6% (22)Unmarried:
39.4% (14)
Marital status - Two or more races population 15 years and over
Males 51.1% Never married48.9% Now married0.0% Separated0.0% Widowed0.0% DivorcedFemales 23.2% Never married71.2% Now married5.5% Separated0.0% Widowed0.0% DivorcedWomen who gave birth in the past 12 months Now married:
100.0% (64)Unmarried:
0.0% (0)
Women who did not give birth in the past 12 months Now married:
49.6% (74)Unmarried:
50.4% (76)
Marital status - White alone, not Hispanic / Latino population 15 years and over
Males 23.3% Never married69.8% Now married0.5% Separated1.0% Widowed5.4% DivorcedFemales 20.4% Never married64.3% Now married0.0% Separated5.6% Widowed9.8% DivorcedWomen who gave birth in the past 12 months Now married:
100.0% (93)Unmarried:
0.0% (0)
Women who did not give birth in the past 12 months Now married:
55.5% (1,070)Unmarried:
44.5% (857)
Marital status - Hispanic or Latino population 15 years and over
Males 41.9% Never married48.2% Now married3.1% Separated5.1% Widowed1.7% DivorcedFemales 21.6% Never married73.6% Now married4.7% Separated0.0% Widowed0.0% DivorcedWomen who gave birth in the past 12 months Now married:
100.0% (106)Unmarried:
0.0% (0)
Women who did not give birth in the past 12 months Now married:
56.0% (122)Unmarried:
44.0% (96)
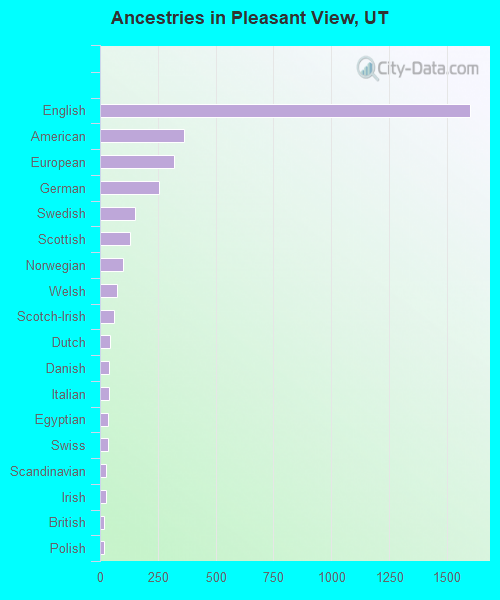
Ancestries in Pleasant View
1,602 30.2% English365 6.9% American322 6.1% European257 4.9% German150 2.8% Swedish130 2.5% Scottish101 1.9% Norwegian73 1.4% Welsh59 1.1% Scotch-Irish43 0.8% Dutch41 0.8% Danish38 0.7% Italian35 0.7% Egyptian33 0.6% Swiss27 0.5% Scandinavian26 0.5% Irish16 0.3% British16 0.3% Polish7 0.1% Finnish6 0.1% French3 0.06% Canadian
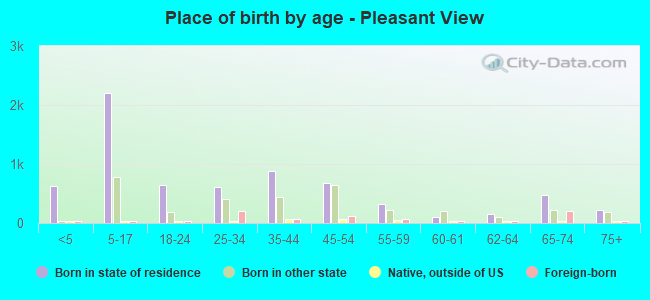
Children Nativity (place of birth) in Pleasant View
Children under 6 years - Living with two parents Both parents native 585 100.0% NativeBoth parents foreign-born 39 100.0% NativeOne native, one foreign-born parent 111 100.0% NativeChildren under 6 years - Living with one parent Native parent 165 100.0% Native
Children 6 to 17 years - Living with two parents Both parents native 2,260 100.0% NativeBoth parents foreign-born 49 100.0% NativeOne native, one foreign-born parent 148 100.0% NativeChildren 6 to 17 years - Living with one parent Native parent 228 100.0% Native
Grandparents responsible for own grandchildren in Pleasant View
Grandparents (30 to 59 years) White / Caucasian 15 16.8% Responsible for grandchildren75 83.2% Not responsible for grandchildrenWhite alone, not Hispanic / Latino 14 17.1% Responsible for grandchildren70 82.9% Not responsible for grandchildren
Grandparents (60 years and over) White / Caucasian 94 100.0% Not responsible for grandchildrenWhite alone, not Hispanic / Latino 105 100.0% Not responsible for grandchildren