Races in Plymouth, Indiana (IN) Detailed Stats
Data:
Races - White alone (%)
Races - White alone (% change since 2000)
Races - Black alone (%)
Races - Black alone (% change since 2000)
Races - American Indian alone (%)
Races - American Indian alone (% change since 2000)
Races - Asian alone (%)
Races - Asian alone (% change since 2000)
Races - Hispanic (%)
Races - Hispanic (% change since 2000)
Races - Native Hawaiian and Other Pacific Islander alone (%)
Races - Native Hawaiian and Other Pacific Islander alone (% change since 2000)
Races - Two or more races(%)
Races - Two or more races(% change since 2000)
Races - Other race alone (%)
Races - Other race alone (% change since 2000)
Racial diversity
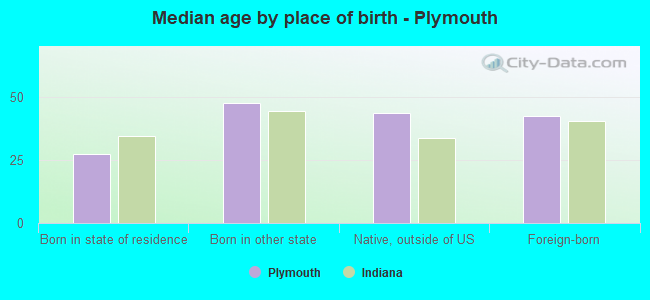
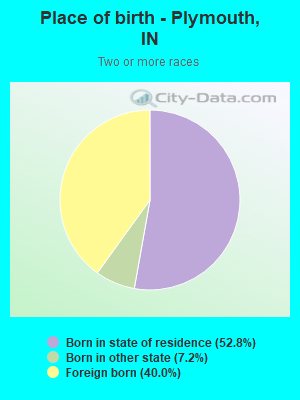
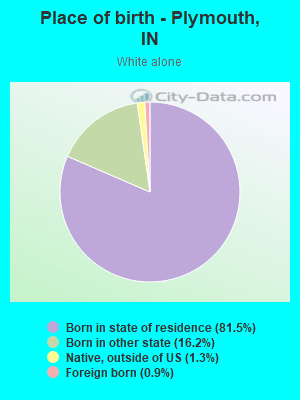
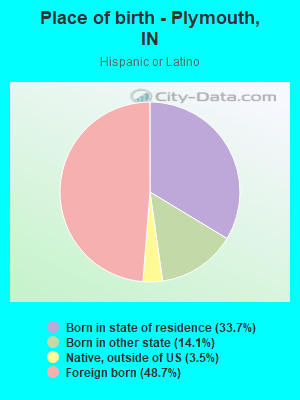
Place of birth - Born in state of residence (%)
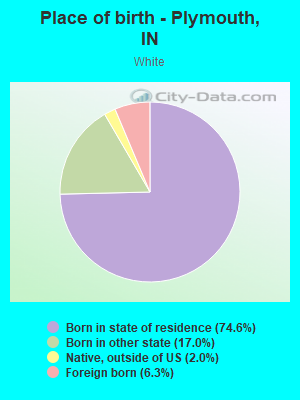
Place of birth - Born in state of residence (%) - White
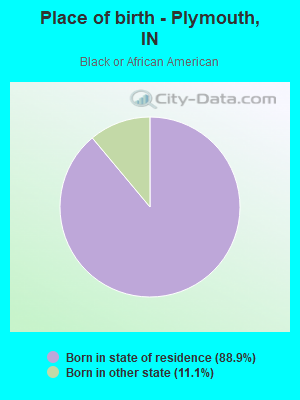
Place of birth - Born in state of residence (%) - Black or African American
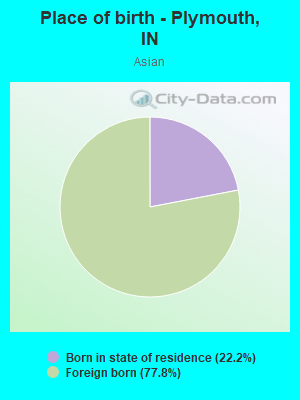
Place of birth - Born in state of residence (%) - Asian
Place of birth - Born in state of residence (%) - Hispanic or Latino
Place of birth - Born in state of residence (%) - American Indian and Alaska Native
Place of birth - Born in state of residence (%) - Multirace
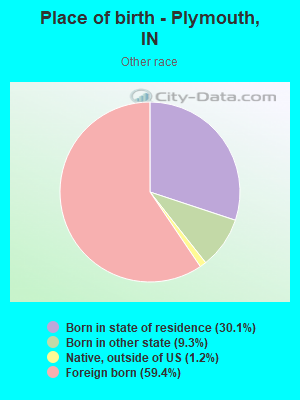
Place of birth - Born in state of residence (%) - Other Race
Place of birth - Born in other state (%)
Place of birth - Born in other state (%) - White
Place of birth - Born in other state (%) - Black or African American
Place of birth - Born in other state (%) - Asian
Place of birth - Born in other state (%) - Hispanic or Latino
Place of birth - Born in other state (%) - American Indian and Alaska Native
Place of birth - Born in other state (%) - Multirace
Place of birth - Born in other state (%) - Other Race
Place of birth - Native, outside of US (%)
Place of birth - Native, outside of US (%) - White
Place of birth - Native, outside of US (%) - Black or African American
Place of birth - Native, outside of US (%) - Asian
Place of birth - Native, outside of US (%) - Hispanic or Latino
Place of birth - Native, outside of US (%) - American Indian and Alaska Native
Place of birth - Native, outside of US (%) - Multirace
Place of birth - Native, outside of US (%) - Other Race
Place of birth - Foreign born (%)
Place of birth - Foreign born (%) - White
Place of birth - Foreign born (%) - Black or African American
Place of birth - Foreign born (%) - Asian
Place of birth - Foreign born (%) - Hispanic or Latino
Place of birth - Foreign born (%) - American Indian and Alaska Native
Place of birth - Foreign born (%) - Multirace
Place of birth - Foreign born (%) - Other Race
Residents speaking English at home (%)
Residents speaking English at home - Born in the United States (%)
Residents speaking English at home - Native, born elsewhere (%)
Residents speaking English at home - Foreign born (%)
Residents speaking Spanish at home (%)
Residents speaking Spanish at home - Born in the United States (%)
Residents speaking Spanish at home - Native, born elsewhere (%)
Residents speaking Spanish at home - Foreign born (%)
Residents speaking other language at home (%)
Residents speaking other language at home - Born in the United States (%)
Residents speaking other language at home - Native, born elsewhere (%)
Residents speaking other language at home - Foreign born (%)
Marital status - Never married (%)
Marital status - Now married (%)
Marital status - Separated (%)
Marital status - Widowed (%)
Marital status - Divorced (%)
Ancestries Reported - Arab (%)
Ancestries Reported - Czech (%)
Ancestries Reported - Danish (%)
Ancestries Reported - Dutch (%)
Ancestries Reported - English (%)
Ancestries Reported - French (%)
Ancestries Reported - French Canadian (%)
Ancestries Reported - German (%)
Ancestries Reported - Greek (%)
Ancestries Reported - Hungarian (%)
Ancestries Reported - Irish (%)
Ancestries Reported - Italian (%)
Ancestries Reported - Lithuanian (%)
Ancestries Reported - Norwegian (%)
Ancestries Reported - Polish (%)
Ancestries Reported - Portuguese (%)
Ancestries Reported - Russian (%)
Ancestries Reported - Scotch-Irish (%)
Ancestries Reported - Scottish (%)
Ancestries Reported - Slovak (%)
Ancestries Reported - Subsaharan African (%)
Ancestries Reported - Swedish (%)
Ancestries Reported - Swiss (%)
Ancestries Reported - Ukrainian (%)
Ancestries Reported - United States (%)
Ancestries Reported - Welsh (%)
Ancestries Reported - West Indian (%)
Ancestries Reported - Other (%)
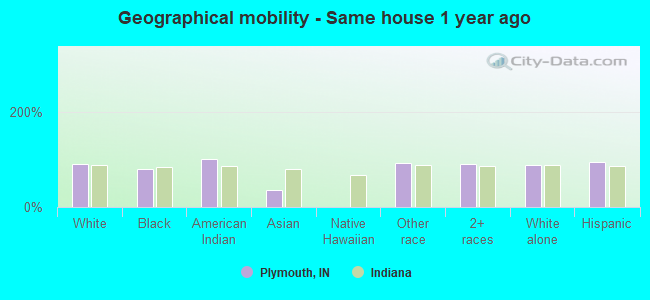
Geographical mobility - Same house 1 year ago (%)
Geographical mobility - Same house 1 year ago (%) - White
Geographical mobility - Same house 1 year ago (%) - Black or African American
Geographical mobility - Same house 1 year ago (%) - Asian
Geographical mobility - Same house 1 year ago (%) - Hispanic or Latino
Geographical mobility - Same house 1 year ago (%) - American Indian and Alaska Native
Geographical mobility - Same house 1 year ago (%) - Multirace
Geographical mobility - Same house 1 year ago (%) - Other Race
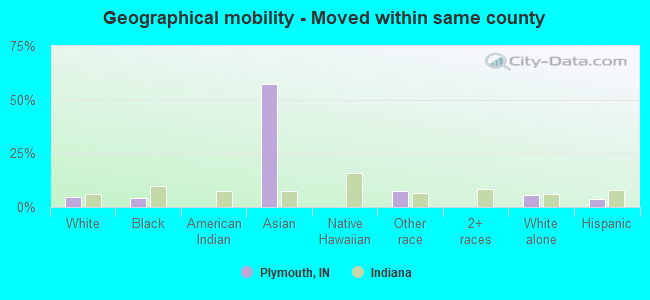
Geographical mobility - Moved within same county (%)
Geographical mobility - Moved within same county (%) - White
Geographical mobility - Moved within same county (%) - Black or African American
Geographical mobility - Moved within same county (%) - Asian
Geographical mobility - Moved within same county (%) - Hispanic or Latino
Geographical mobility - Moved within same county (%) - American Indian and Alaska Native
Geographical mobility - Moved within same county (%) - Multirace
Geographical mobility - Moved within same county (%) - Other Race
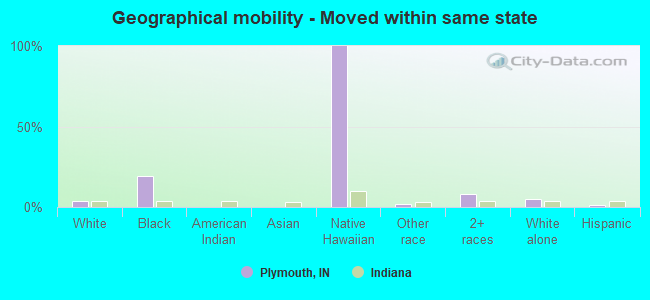
Geographical mobility - Moved from different county within same state (%)
Geographical mobility - Moved from different county within same state (%) - White
Geographical mobility - Moved from different county within same state (%) - Black or African American
Geographical mobility - Moved from different county within same state (%) - Asian
Geographical mobility - Moved from different county within same state (%) - Hispanic or Latino
Geographical mobility - Moved from different county within same state (%) - American Indian and Alaska Native
Geographical mobility - Moved from different county within same state (%) - Multirace
Geographical mobility - Moved from different county within same state (%) - Other Race
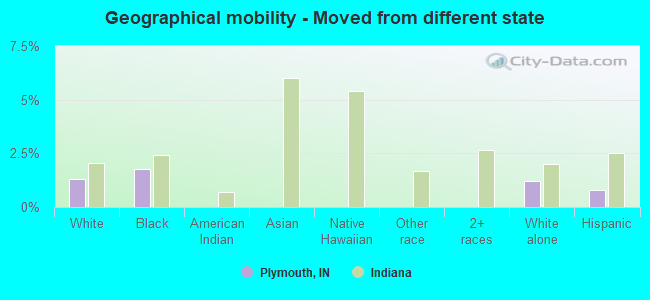
Geographical mobility - Moved from different state (%)
Geographical mobility - Moved from different state (%) - White
Geographical mobility - Moved from different state (%) - Black or African American
Geographical mobility - Moved from different state (%) - Asian
Geographical mobility - Moved from different state (%) - Hispanic or Latino
Geographical mobility - Moved from different state (%) - American Indian and Alaska Native
Geographical mobility - Moved from different state (%) - Multirace
Geographical mobility - Moved from different state (%) - Other Race
Geographical mobility - Moved from abroad (%)
Geographical mobility - Moved from abroad (%) - White
Geographical mobility - Moved from abroad (%) - Black or African American
Geographical mobility - Moved from abroad (%) - Asian
Geographical mobility - Moved from abroad (%) - Hispanic or Latino
Geographical mobility - Moved from abroad (%) - American Indian and Alaska Native
Geographical mobility - Moved from abroad (%) - Multirace
Geographical mobility - Moved from abroad (%) - Other Race
Place of birth for the foreign-born population - Ireland (%)
Place of birth for the foreign-born population - Denmark (%)
Place of birth for the foreign-born population - Norway (%)
Place of birth for the foreign-born population - Sweden (%)
Place of birth for the foreign-born population - United Kingdom (%)
Place of birth for the foreign-born population - England (%)
Place of birth for the foreign-born population - Scotland (%)
Place of birth for the foreign-born population - Other Northern Europe (%)
Place of birth for the foreign-born population - Austria (%)
Place of birth for the foreign-born population - Belgium (%)
Place of birth for the foreign-born population - France (%)
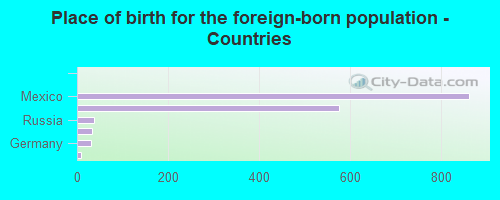
Place of birth for the foreign-born population - Germany (%)
Place of birth for the foreign-born population - Netherlands (%)
Place of birth for the foreign-born population - Switzerland (%)
Place of birth for the foreign-born population - Other Western Europe (%)
Place of birth for the foreign-born population - Greece (%)
Place of birth for the foreign-born population - Italy (%)
Place of birth for the foreign-born population - Portugal (%)
Place of birth for the foreign-born population - Spain (%)
Place of birth for the foreign-born population - Other Southern Europe (%)
Place of birth for the foreign-born population - Albania (%)
Place of birth for the foreign-born population - Belarus (%)
Place of birth for the foreign-born population - Bosnia and Herzegovina (%)
Place of birth for the foreign-born population - Bulgaria (%)
Place of birth for the foreign-born population - Croatia (%)
Place of birth for the foreign-born population - Czechoslovakia (%)
Place of birth for the foreign-born population - Hungary (%)
Place of birth for the foreign-born population - Latvia (%)
Place of birth for the foreign-born population - Lithuania (%)
Place of birth for the foreign-born population - North Macedonia (Macedonia) (%)
Place of birth for the foreign-born population - Moldova (%)
Place of birth for the foreign-born population - Poland (%)
Place of birth for the foreign-born population - Romania (%)
Place of birth for the foreign-born population - Russia (%)
Place of birth for the foreign-born population - Serbia (%)
Place of birth for the foreign-born population - Ukraine (%)
Place of birth for the foreign-born population - Other Eastern Europe (%)
Place of birth for the foreign-born population - China (%)
Place of birth for the foreign-born population - Hong Kong (%)
Place of birth for the foreign-born population - Taiwan (%)
Place of birth for the foreign-born population - Japan (%)
Place of birth for the foreign-born population - Korea (%)
Place of birth for the foreign-born population - Other Eastern Asia (%)
Place of birth for the foreign-born population - Afghanistan (%)
Place of birth for the foreign-born population - Bangladesh (%)
Place of birth for the foreign-born population - India (%)
Place of birth for the foreign-born population - Iran (%)
Place of birth for the foreign-born population - Kazakhstan (%)
Place of birth for the foreign-born population - Nepal (%)
Place of birth for the foreign-born population - Pakistan (%)
Place of birth for the foreign-born population - Sri Lanka (%)
Place of birth for the foreign-born population - Uzbekistan (%)
Place of birth for the foreign-born population - Other South Central Asia (%)
Place of birth for the foreign-born population - Burma (%)
Place of birth for the foreign-born population - Cambodia (%)
Place of birth for the foreign-born population - Indonesia (%)
Place of birth for the foreign-born population - Laos (%)
Place of birth for the foreign-born population - Malaysia (%)
Place of birth for the foreign-born population - Philippines (%)
Place of birth for the foreign-born population - Singapore (%)
Place of birth for the foreign-born population - Thailand (%)
Place of birth for the foreign-born population - Vietnam (%)
Place of birth for the foreign-born population - Other South Eastern Asia (%)
Place of birth for the foreign-born population - Armenia (%)
Place of birth for the foreign-born population - Iraq (%)
Place of birth for the foreign-born population - Israel (%)
Place of birth for the foreign-born population - Jordan (%)
Place of birth for the foreign-born population - Kuwait (%)
Place of birth for the foreign-born population - Lebanon (%)
Place of birth for the foreign-born population - Saudi Arabia (%)
Place of birth for the foreign-born population - Syria (%)
Place of birth for the foreign-born population - Turkey (%)
Place of birth for the foreign-born population - Yemen (%)
Place of birth for the foreign-born population - Other Western Asia (%)
Place of birth for the foreign-born population - Eritrea (%)
Place of birth for the foreign-born population - Ethiopia (%)
Place of birth for the foreign-born population - Kenya (%)
Place of birth for the foreign-born population - Somalia (%)
Place of birth for the foreign-born population - Uganda (%)
Place of birth for the foreign-born population - Zimbabwe (%)
Place of birth for the foreign-born population - Other Eastern Africa (%)
Place of birth for the foreign-born population - Cameroon (%)
Place of birth for the foreign-born population - Congo (%)
Place of birth for the foreign-born population - Democratic Republic of Congo (Zaire) (%)
Place of birth for the foreign-born population - Other Middle Africa (%)
Place of birth for the foreign-born population - Egypt (%)
Place of birth for the foreign-born population - Morocco (%)
Place of birth for the foreign-born population - Sudan (%)
Place of birth for the foreign-born population - Other Northern Africa (%)
Place of birth for the foreign-born population - South Africa (%)
Place of birth for the foreign-born population - Other Southern Africa (%)
Place of birth for the foreign-born population - Cabo Verde (%)
Place of birth for the foreign-born population - Ghana (%)
Place of birth for the foreign-born population - Liberia (%)
Place of birth for the foreign-born population - Nigeria (%)
Place of birth for the foreign-born population - Senegal (%)
Place of birth for the foreign-born population - Sierra Leone (%)
Place of birth for the foreign-born population - Other Western Africa (%)
Place of birth for the foreign-born population - Australia (%)
Place of birth for the foreign-born population - New Zealand (%)
Place of birth for the foreign-born population - Fiji (%)
Place of birth for the foreign-born population - Micronesia (%)
Place of birth for the foreign-born population - Bahamas (%)
Place of birth for the foreign-born population - Barbados (%)
Place of birth for the foreign-born population - Cuba (%)
Place of birth for the foreign-born population - Dominica (%)
Place of birth for the foreign-born population - Dominican Republic (%)
Place of birth for the foreign-born population - Grenada (%)
Place of birth for the foreign-born population - Haiti (%)
Place of birth for the foreign-born population - Jamaica (%)
Place of birth for the foreign-born population - St. Vincent and the Grenadines (%)
Place of birth for the foreign-born population - Trinidad and Tobago (%)
Place of birth for the foreign-born population - West Indies (%)
Place of birth for the foreign-born population - Other Caribbean (%)
Place of birth for the foreign-born population - Belize (%)
Place of birth for the foreign-born population - Costa Rica (%)
Place of birth for the foreign-born population - El Salvador (%)
Place of birth for the foreign-born population - Guatemala (%)
Place of birth for the foreign-born population - Honduras (%)
Place of birth for the foreign-born population - Mexico (%)
Place of birth for the foreign-born population - Nicaragua (%)
Place of birth for the foreign-born population - Panama (%)
Place of birth for the foreign-born population - Other Central America (%)
Place of birth for the foreign-born population - Argentina (%)
Place of birth for the foreign-born population - Bolivia (%)
Place of birth for the foreign-born population - Brazil (%)
Place of birth for the foreign-born population - Chile (%)
Place of birth for the foreign-born population - Colombia (%)
Place of birth for the foreign-born population - Ecuador (%)
Place of birth for the foreign-born population - Guyana (%)
Place of birth for the foreign-born population - Peru (%)
Place of birth for the foreign-born population - Uruguay (%)
Place of birth for the foreign-born population - Venezuela (%)
Place of birth for the foreign-born population - Other South America (%)
Place of birth for the foreign-born population - Canada (%)
Place of birth for the foreign-born population - Other Northern America (%)
Place of birth for the foreign-born population - Other (%)
Latest news about races in Plymouth, IN collected exclusively by city-data.com from local newspapers, TV, and radio stations
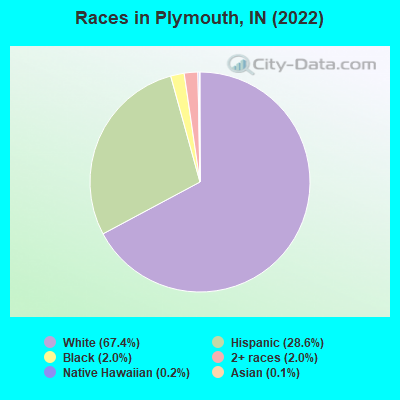
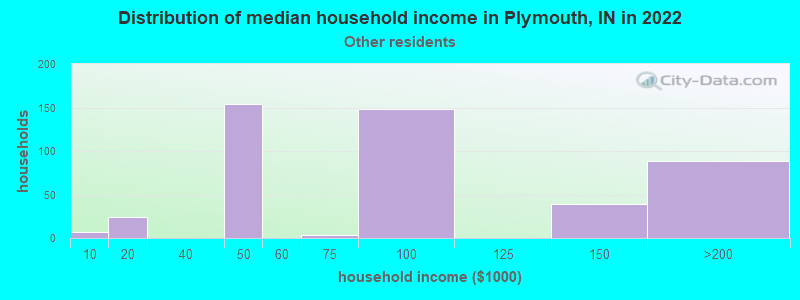
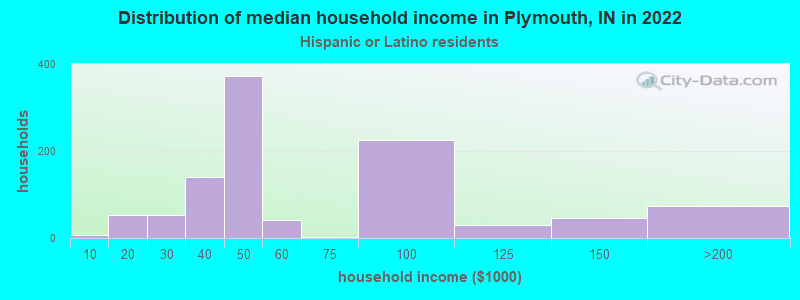
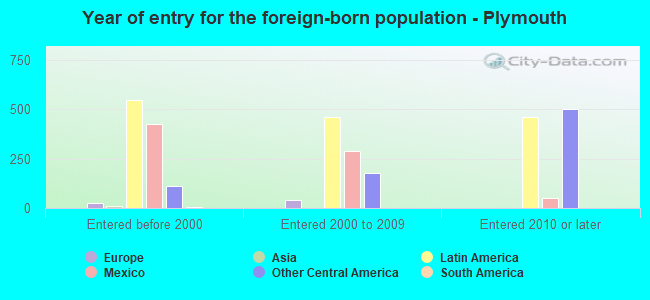
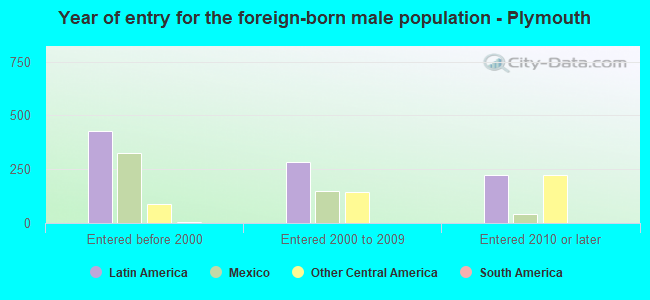
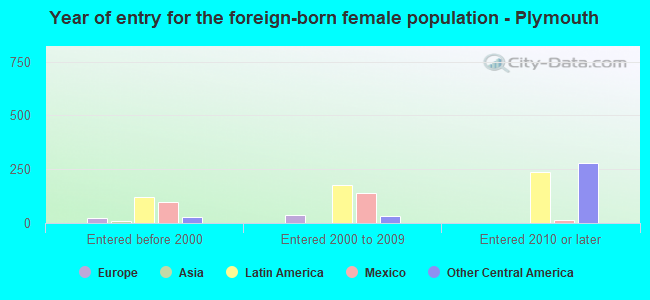
According to 2022 data, the most numerous races in Plymouth, IN are White alone (7,040 residents), Black alone (213 residents), and Hispanic (2,986 residents). 74.9% of Plymouth residents speak English at home. 14.9% of Plymouth, IN residents are foreign-born (13.0% born in Latin America), which is 59.7% greater than the foreign-born rate of 6.0% across the entire state of Indiana.
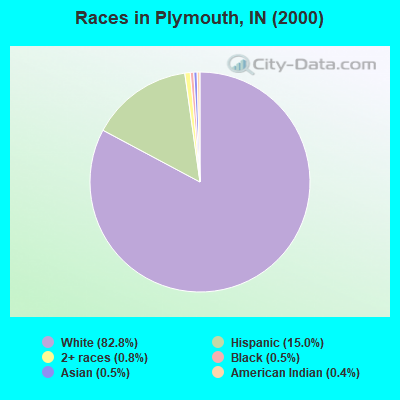
Race distribution in Plymouth
2000 2022
5,219,373 85.8% White alone 505,462 8.3% Black alone 214,536 3.5% Hispanic 61,115 1.0% Two or more races 58,424 1.0% Asian alone 13,654 0.2% American Indian alone 6,348 0.1% Other race alone 1,573 0.03% Native Hawaiian and Other
5,192,455 76.0% White alone 628,054 9.2% Black alone 534,528 7.8% Hispanic 263,242 3.9% Two or more races 172,880 2.5% Asian alone 33,467 0.5% Other race alone 5,866 0.09% American Indian alone 2,545 0.04% Native Hawaiian and Other
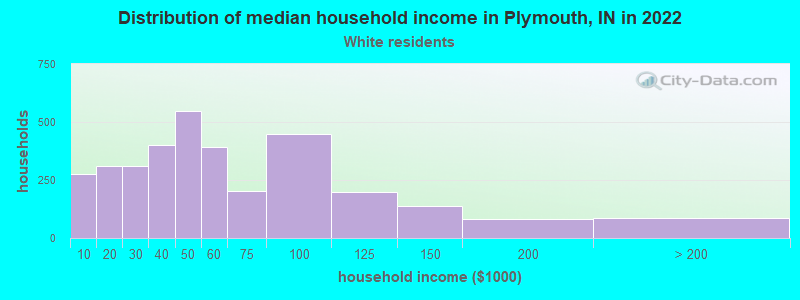
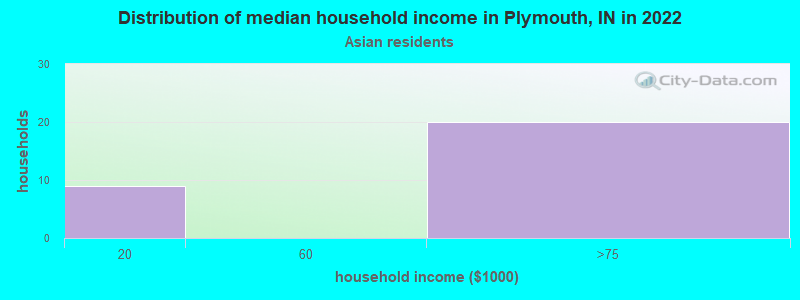
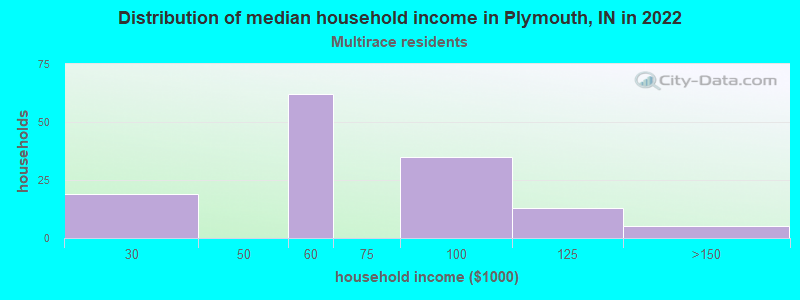
Income and house value in Plymouth Median household income in 2022 $50,911 White non-Hispanic householders$82,227 Some other race householders$56,291 Two or more races householders$43,002 Hispanic or Latino race householdersMedian 2022 house value $141,140 White Non-Hispanic householders$84,347 American Indian or Alaska Native householders$159,322 Some other race householders$119,960 Hispanic or Latino householders
Median age by race in Plymouth
37.2 Median age for White residents34.2 40.1 15.9 Median age for Black or African American residents16.4 15.7 -558,797,523.8 Median age for American Indian / Alaska Native residents-654,255,318.5 -491,600,353.2 81.5 Median age for Asian residents-693,422,518.8 -670,756,645.5 -664,335,663.7 Median age for Native Hawaiian / Pacific Islander residents-644,025,156.6 -664,437,011.6 28.6 Median age for Other race residents35.6 28.9 24.7 Median age for Two or more races residents17.2 53.0 39.5 Median age for White alone residents35.5 42.9 30.3 Median age for Hispanic or Latino residents29.9 28.6
Owner/renter occupied households by race in Plymouth
House owners and renters - White residents 1,996 59.7% Owner occupied1,350 40.3% Renter occupiedHouse owners and renters - American Indian / Alaska Native residents 24 100.0% Renter occupiedHouse owners and renters - Asian residents 3 28.1% Owner occupied8 71.9% Renter occupiedHouse owners and renters - Other race residents 187 41.1% Owner occupied268 58.9% Renter occupiedHouse owners and renters - Two or more races residents 111 82.2% Owner occupied24 17.8% Renter occupiedHouse owners and renters - White alone residents 1,828 64.4% Owner occupied1,009 35.6% Renter occupiedHouse owners and renters - Hispanic or Latino residents 393 37.6% Owner occupied653 62.4% Renter occupied
Language usage in Plymouth
English speakers - Total 74.9% of residents of Plymouth speak English at home.
24.9% of residents speak Spanish at home 1,500 62.0% Speak English very well919 38.0% Speak English less than very well1.1% of residents speak other language at home 111 100.0% Speak English very well
English speakers - Born in the United States 76.7% of residents of Plymouth speak English at home.
23.9% of residents speak Spanish at home 320 82.1% Speak English very well70 17.9% Speak English less than very well0.7% of residents speak other language at home 12 100.0% Speak English very well
English speakers - Native, born elsewhere 45.5% of residents of Plymouth speak English at home.
52.5% of residents speak Spanish at home 38 35.8% Speak English very well68 64.2% Speak English less than very well
English speakers - Foreign-born 21.5% of residents of Plymouth speak English at home.
74.6% of residents speak Spanish at home 528 45.4% Speak English very well635 54.6% Speak English less than very well0.9% of residents speak other language at home 14 100.0% Speak English very well
White (Caucasian) - Speak only English Native:
88.0% (6,504)Foreign-born:
14.9% (80)
White (Caucasian) - Speak another language Native:
11.3% (835)Foreign-born:
81.1% (438)
Asian - Speak only English Native:
94.8% (3)Foreign-born:
18.5% (2)
Other race - Speak only English Native:
9.3% (37)Foreign-born:
47.8% (328)
Other race - Speak another language Native:
84.1% (338)Foreign-born:
59.3% (407)
Two or more races - Speak another language Native:
19.9% (38)Foreign-born:
99.0% (166)
White alone - Speak only English Native:
97.8% (6,402)Foreign-born:
87.2% (57)
White alone - Speak another language Native:
2.2% (143)Foreign-born:
6.7% (4)
Hispanic or Latino - Speak only English Native:
13.7% (184)Foreign-born:
20.1% (297)
Hispanic or Latino - Speak another language Native:
88.8% (1,194)Foreign-born:
80.3% (1,184)
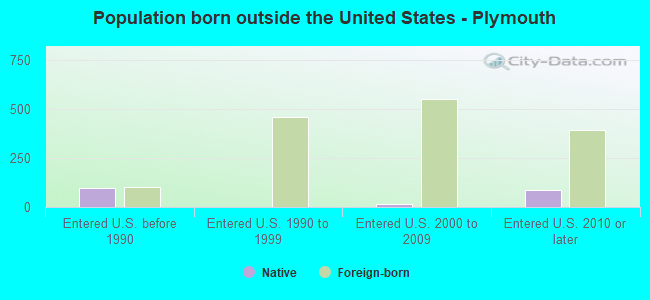
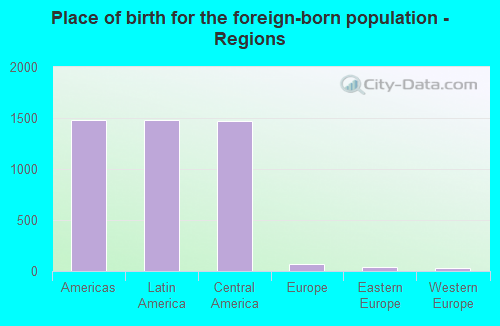
Foreign-born residents in Plymouth 1,555 residents are foreign born (13.0% Latin America ).
This city:
14.9%Indiana:
5.6%
Marital status for residents in Plymouth Marital status - White (Caucasian) population 15 years and over
Males 40.2% Never married39.6% Now married2.0% Separated1.8% Widowed16.4% DivorcedFemales 27.8% Never married35.4% Now married3.2% Separated14.5% Widowed19.2% DivorcedWomen who gave birth in the past 12 months Now married:
100.0% (47)Unmarried:
0.0% (0)
Women who did not give birth in the past 12 months Now married:
39.9% (686)Unmarried:
60.1% (1,032)
Marital status - Black or African American population 15 years and over
Males 86.2% Never married13.8% Now married0.0% Separated0.0% Widowed0.0% DivorcedFemales 100.0% Never married0.0% Now married0.0% Separated0.0% Widowed0.0% DivorcedWomen who did not give birth in the past 12 months Now married:
0.0% (0)Unmarried:
100.0% (45)
Marital status - Asian population 15 years and over
Males 0.0% Never married100.0% Now married0.0% Separated0.0% Widowed0.0% DivorcedFemales 25.0% Never married0.0% Now married0.0% Separated75.0% Widowed0.0% DivorcedWomen who gave birth in the past 12 months Now married:
0.0% (0)Unmarried:
100.0% (3)
Marital status - Other race population 15 years and over
Males 43.5% Never married54.9% Now married1.6% Separated0.0% Widowed0.0% DivorcedFemales 46.6% Never married39.6% Now married0.0% Separated0.0% Widowed13.8% DivorcedWomen who gave birth in the past 12 months Now married:
100.0% (5)Unmarried:
0.0% (0)
Women who did not give birth in the past 12 months Now married:
39.3% (141)Unmarried:
60.7% (217)
Marital status - Two or more races population 15 years and over
Males 83.8% Never married0.0% Now married0.0% Separated16.2% Widowed0.0% DivorcedFemales 30.3% Never married21.2% Now married0.0% Separated0.0% Widowed48.5% DivorcedWomen who did not give birth in the past 12 months Now married:
21.3% (14)Unmarried:
78.7% (51)
Marital status - White alone, not Hispanic / Latino population 15 years and over
Males 43.1% Never married38.5% Now married1.9% Separated2.4% Widowed14.2% DivorcedFemales 27.3% Never married33.3% Now married3.1% Separated16.3% Widowed20.1% DivorcedWomen who gave birth in the past 12 months Now married:
100.0% (37)Unmarried:
0.0% (0)
Women who did not give birth in the past 12 months Now married:
35.0% (481)Unmarried:
65.0% (895)
Marital status - Hispanic or Latino population 15 years and over
Males 39.5% Never married44.9% Now married1.9% Separated0.3% Widowed13.5% DivorcedFemales 39.1% Never married44.2% Now married2.0% Separated1.6% Widowed13.1% DivorcedWomen who gave birth in the past 12 months Now married:
100.0% (16)Unmarried:
0.0% (0)
Women who did not give birth in the past 12 months Now married:
49.3% (371)Unmarried:
50.7% (382)
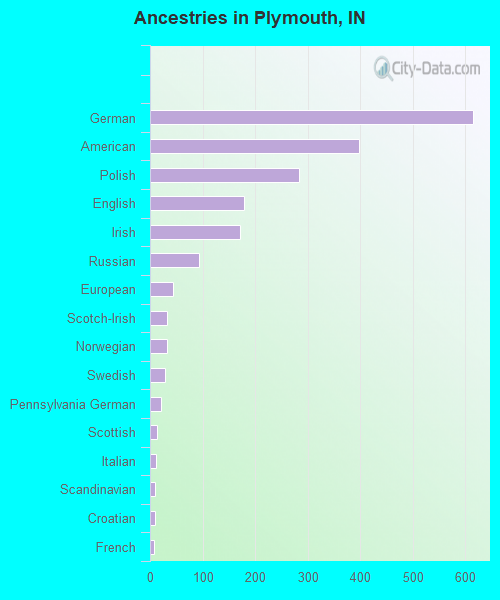
Ancestries in Plymouth
614 12.9% German398 8.4% American283 6.0% Polish179 3.8% English172 3.6% Irish94 2.0% Russian43 0.9% European33 0.7% Scotch-Irish32 0.7% Norwegian28 0.6% Swedish20 0.4% Pennsylvania German14 0.3% Scottish11 0.2% Italian10 0.2% Scandinavian9 0.2% Croatian8 0.2% French1 0.02% West Indian
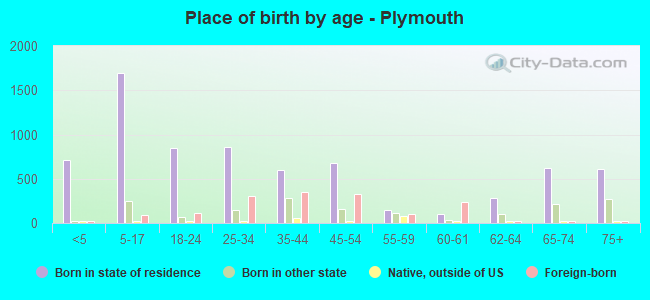
Children Nativity (place of birth) in Plymouth
Children under 6 years - Living with two parents Both parents native 92 100.0% NativeBoth parents foreign-born 171 100.0% NativeOne native, one foreign-born parent 22 100.0% NativeChildren under 6 years - Living with one parent Native parent 442 100.0% NativeChildren 6 to 17 years - Living with two parents Both parents native 635 100.0% NativeBoth parents foreign-born 244 86.5% Native38 13.5% Foreign-bornOne native, one foreign-born parent 125 100.0% NativeChildren 6 to 17 years - Living with one parent Native parent 595 100.0% NativeForeign-born parent 81 52.0% Native75 48.0% Foreign-born
Grandparents responsible for own grandchildren in Plymouth
Grandparents (30 to 59 years) White / Caucasian 105 100.0% Not responsible for grandchildrenBlack or African American 22 100.0% Responsible for grandchildrenWhite alone, not Hispanic / Latino 89 100.0% Not responsible for grandchildrenHispanic or Latino 25 100.0% Not responsible for grandchildrenGrandparents (60 years and over) White / Caucasian 23 20.2% Responsible for grandchildren92 79.8% Not responsible for grandchildrenWhite alone, not Hispanic / Latino 24 20.1% Responsible for grandchildren93 79.9% Not responsible for grandchildren