Races in Plymouth Meeting, Pennsylvania (PA) Detailed Stats
Data:
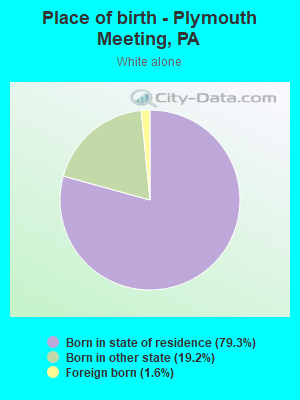
Races - White alone (%)
Races - White alone (% change since 2000)
Races - Black alone (%)
Races - Black alone (% change since 2000)
Races - American Indian alone (%)
Races - American Indian alone (% change since 2000)
Races - Asian alone (%)
Races - Asian alone (% change since 2000)
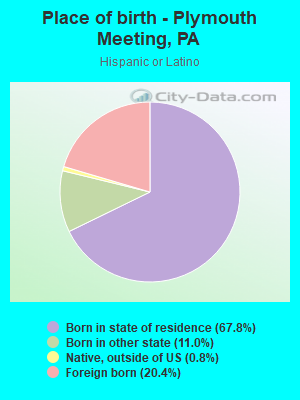
Races - Hispanic (%)
Races - Hispanic (% change since 2000)
Races - Native Hawaiian and Other Pacific Islander alone (%)
Races - Native Hawaiian and Other Pacific Islander alone (% change since 2000)
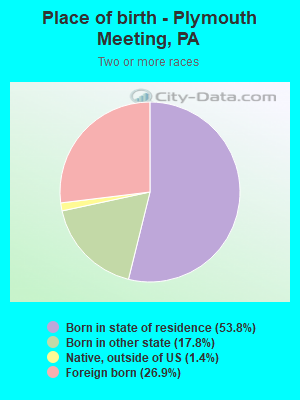
Races - Two or more races(%)
Races - Two or more races(% change since 2000)
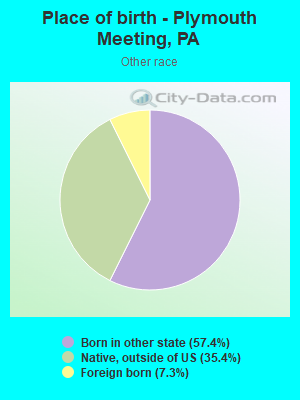
Races - Other race alone (%)
Races - Other race alone (% change since 2000)
Racial diversity
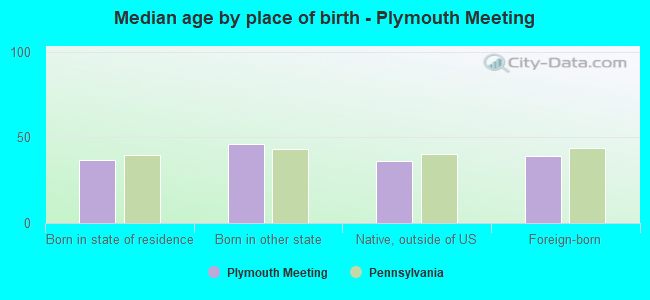
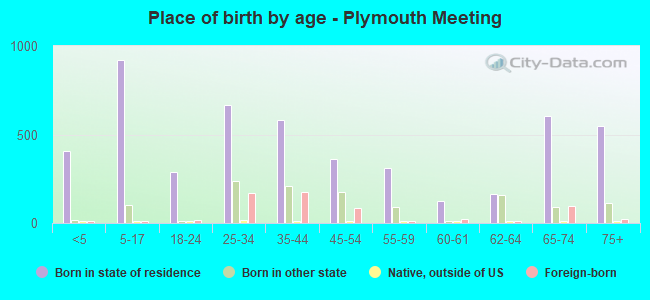
Place of birth - Born in state of residence (%)
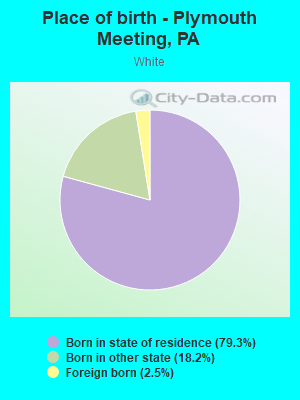
Place of birth - Born in state of residence (%) - White
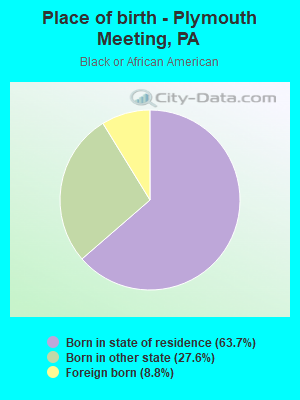
Place of birth - Born in state of residence (%) - Black or African American
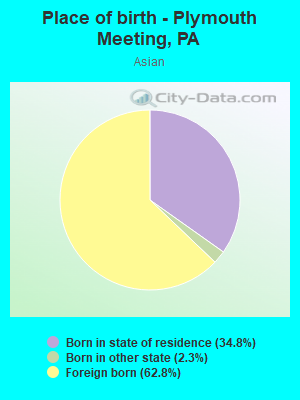
Place of birth - Born in state of residence (%) - Asian
Place of birth - Born in state of residence (%) - Hispanic or Latino
Place of birth - Born in state of residence (%) - American Indian and Alaska Native
Place of birth - Born in state of residence (%) - Multirace
Place of birth - Born in state of residence (%) - Other Race
Place of birth - Born in other state (%)
Place of birth - Born in other state (%) - White
Place of birth - Born in other state (%) - Black or African American
Place of birth - Born in other state (%) - Asian
Place of birth - Born in other state (%) - Hispanic or Latino
Place of birth - Born in other state (%) - American Indian and Alaska Native
Place of birth - Born in other state (%) - Multirace
Place of birth - Born in other state (%) - Other Race
Place of birth - Native, outside of US (%)
Place of birth - Native, outside of US (%) - White
Place of birth - Native, outside of US (%) - Black or African American
Place of birth - Native, outside of US (%) - Asian
Place of birth - Native, outside of US (%) - Hispanic or Latino
Place of birth - Native, outside of US (%) - American Indian and Alaska Native
Place of birth - Native, outside of US (%) - Multirace
Place of birth - Native, outside of US (%) - Other Race
Place of birth - Foreign born (%)
Place of birth - Foreign born (%) - White
Place of birth - Foreign born (%) - Black or African American
Place of birth - Foreign born (%) - Asian
Place of birth - Foreign born (%) - Hispanic or Latino
Place of birth - Foreign born (%) - American Indian and Alaska Native
Place of birth - Foreign born (%) - Multirace
Place of birth - Foreign born (%) - Other Race
Residents speaking English at home (%)
Residents speaking English at home - Born in the United States (%)
Residents speaking English at home - Native, born elsewhere (%)
Residents speaking English at home - Foreign born (%)
Residents speaking Spanish at home (%)
Residents speaking Spanish at home - Born in the United States (%)
Residents speaking Spanish at home - Native, born elsewhere (%)
Residents speaking Spanish at home - Foreign born (%)
Residents speaking other language at home (%)
Residents speaking other language at home - Born in the United States (%)
Residents speaking other language at home - Native, born elsewhere (%)
Residents speaking other language at home - Foreign born (%)
Marital status - Never married (%)
Marital status - Now married (%)
Marital status - Separated (%)
Marital status - Widowed (%)
Marital status - Divorced (%)
Ancestries Reported - Arab (%)
Ancestries Reported - Czech (%)
Ancestries Reported - Danish (%)
Ancestries Reported - Dutch (%)
Ancestries Reported - English (%)
Ancestries Reported - French (%)
Ancestries Reported - French Canadian (%)
Ancestries Reported - German (%)
Ancestries Reported - Greek (%)
Ancestries Reported - Hungarian (%)
Ancestries Reported - Irish (%)
Ancestries Reported - Italian (%)
Ancestries Reported - Lithuanian (%)
Ancestries Reported - Norwegian (%)
Ancestries Reported - Polish (%)
Ancestries Reported - Portuguese (%)
Ancestries Reported - Russian (%)
Ancestries Reported - Scotch-Irish (%)
Ancestries Reported - Scottish (%)
Ancestries Reported - Slovak (%)
Ancestries Reported - Subsaharan African (%)
Ancestries Reported - Swedish (%)
Ancestries Reported - Swiss (%)
Ancestries Reported - Ukrainian (%)
Ancestries Reported - United States (%)
Ancestries Reported - Welsh (%)
Ancestries Reported - West Indian (%)
Ancestries Reported - Other (%)
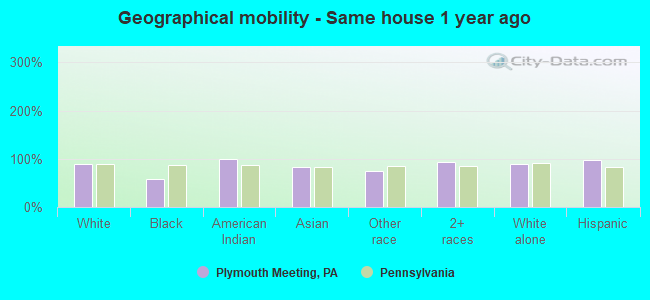
Geographical mobility - Same house 1 year ago (%)
Geographical mobility - Same house 1 year ago (%) - White
Geographical mobility - Same house 1 year ago (%) - Black or African American
Geographical mobility - Same house 1 year ago (%) - Asian
Geographical mobility - Same house 1 year ago (%) - Hispanic or Latino
Geographical mobility - Same house 1 year ago (%) - American Indian and Alaska Native
Geographical mobility - Same house 1 year ago (%) - Multirace
Geographical mobility - Same house 1 year ago (%) - Other Race
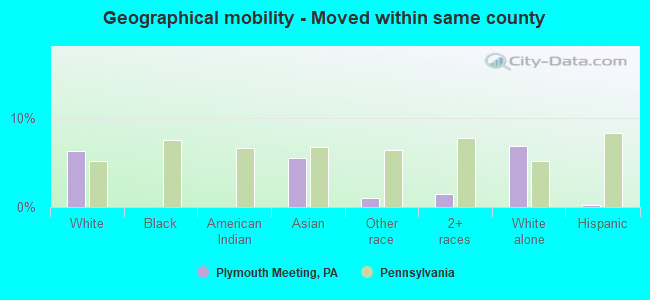
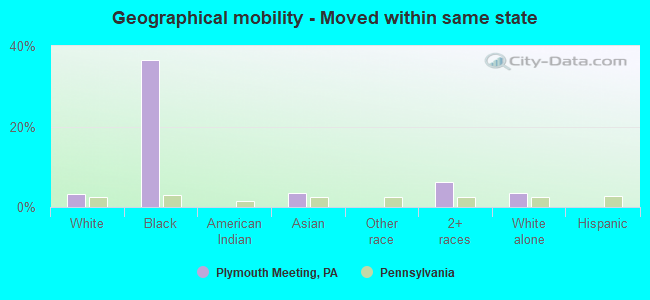
Geographical mobility - Moved within same county (%)
Geographical mobility - Moved within same county (%) - White
Geographical mobility - Moved within same county (%) - Black or African American
Geographical mobility - Moved within same county (%) - Asian
Geographical mobility - Moved within same county (%) - Hispanic or Latino
Geographical mobility - Moved within same county (%) - American Indian and Alaska Native
Geographical mobility - Moved within same county (%) - Multirace
Geographical mobility - Moved within same county (%) - Other Race
Geographical mobility - Moved from different county within same state (%)
Geographical mobility - Moved from different county within same state (%) - White
Geographical mobility - Moved from different county within same state (%) - Black or African American
Geographical mobility - Moved from different county within same state (%) - Asian
Geographical mobility - Moved from different county within same state (%) - Hispanic or Latino
Geographical mobility - Moved from different county within same state (%) - American Indian and Alaska Native
Geographical mobility - Moved from different county within same state (%) - Multirace
Geographical mobility - Moved from different county within same state (%) - Other Race
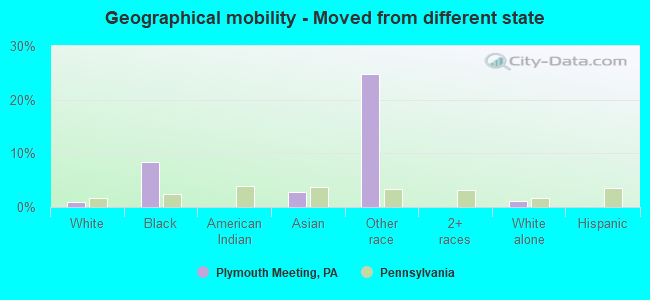
Geographical mobility - Moved from different state (%)
Geographical mobility - Moved from different state (%) - White
Geographical mobility - Moved from different state (%) - Black or African American
Geographical mobility - Moved from different state (%) - Asian
Geographical mobility - Moved from different state (%) - Hispanic or Latino
Geographical mobility - Moved from different state (%) - American Indian and Alaska Native
Geographical mobility - Moved from different state (%) - Multirace
Geographical mobility - Moved from different state (%) - Other Race
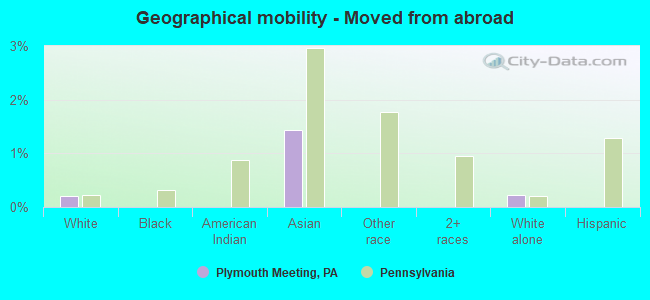
Geographical mobility - Moved from abroad (%)
Geographical mobility - Moved from abroad (%) - White
Geographical mobility - Moved from abroad (%) - Black or African American
Geographical mobility - Moved from abroad (%) - Asian
Geographical mobility - Moved from abroad (%) - Hispanic or Latino
Geographical mobility - Moved from abroad (%) - American Indian and Alaska Native
Geographical mobility - Moved from abroad (%) - Multirace
Geographical mobility - Moved from abroad (%) - Other Race
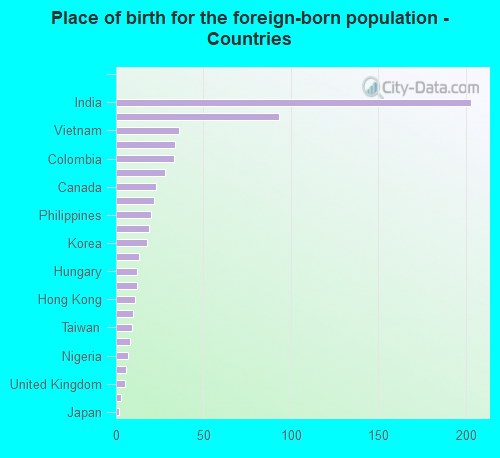
Place of birth for the foreign-born population - Ireland (%)
Place of birth for the foreign-born population - Denmark (%)
Place of birth for the foreign-born population - Norway (%)
Place of birth for the foreign-born population - Sweden (%)
Place of birth for the foreign-born population - United Kingdom (%)
Place of birth for the foreign-born population - England (%)
Place of birth for the foreign-born population - Scotland (%)
Place of birth for the foreign-born population - Other Northern Europe (%)
Place of birth for the foreign-born population - Austria (%)
Place of birth for the foreign-born population - Belgium (%)
Place of birth for the foreign-born population - France (%)
Place of birth for the foreign-born population - Germany (%)
Place of birth for the foreign-born population - Netherlands (%)
Place of birth for the foreign-born population - Switzerland (%)
Place of birth for the foreign-born population - Other Western Europe (%)
Place of birth for the foreign-born population - Greece (%)
Place of birth for the foreign-born population - Italy (%)
Place of birth for the foreign-born population - Portugal (%)
Place of birth for the foreign-born population - Spain (%)
Place of birth for the foreign-born population - Other Southern Europe (%)
Place of birth for the foreign-born population - Albania (%)
Place of birth for the foreign-born population - Belarus (%)
Place of birth for the foreign-born population - Bosnia and Herzegovina (%)
Place of birth for the foreign-born population - Bulgaria (%)
Place of birth for the foreign-born population - Croatia (%)
Place of birth for the foreign-born population - Czechoslovakia (%)
Place of birth for the foreign-born population - Hungary (%)
Place of birth for the foreign-born population - Latvia (%)
Place of birth for the foreign-born population - Lithuania (%)
Place of birth for the foreign-born population - North Macedonia (Macedonia) (%)
Place of birth for the foreign-born population - Moldova (%)
Place of birth for the foreign-born population - Poland (%)
Place of birth for the foreign-born population - Romania (%)
Place of birth for the foreign-born population - Russia (%)
Place of birth for the foreign-born population - Serbia (%)
Place of birth for the foreign-born population - Ukraine (%)
Place of birth for the foreign-born population - Other Eastern Europe (%)
Place of birth for the foreign-born population - China (%)
Place of birth for the foreign-born population - Hong Kong (%)
Place of birth for the foreign-born population - Taiwan (%)
Place of birth for the foreign-born population - Japan (%)
Place of birth for the foreign-born population - Korea (%)
Place of birth for the foreign-born population - Other Eastern Asia (%)
Place of birth for the foreign-born population - Afghanistan (%)
Place of birth for the foreign-born population - Bangladesh (%)
Place of birth for the foreign-born population - India (%)
Place of birth for the foreign-born population - Iran (%)
Place of birth for the foreign-born population - Kazakhstan (%)
Place of birth for the foreign-born population - Nepal (%)
Place of birth for the foreign-born population - Pakistan (%)
Place of birth for the foreign-born population - Sri Lanka (%)
Place of birth for the foreign-born population - Uzbekistan (%)
Place of birth for the foreign-born population - Other South Central Asia (%)
Place of birth for the foreign-born population - Burma (%)
Place of birth for the foreign-born population - Cambodia (%)
Place of birth for the foreign-born population - Indonesia (%)
Place of birth for the foreign-born population - Laos (%)
Place of birth for the foreign-born population - Malaysia (%)
Place of birth for the foreign-born population - Philippines (%)
Place of birth for the foreign-born population - Singapore (%)
Place of birth for the foreign-born population - Thailand (%)
Place of birth for the foreign-born population - Vietnam (%)
Place of birth for the foreign-born population - Other South Eastern Asia (%)
Place of birth for the foreign-born population - Armenia (%)
Place of birth for the foreign-born population - Iraq (%)
Place of birth for the foreign-born population - Israel (%)
Place of birth for the foreign-born population - Jordan (%)
Place of birth for the foreign-born population - Kuwait (%)
Place of birth for the foreign-born population - Lebanon (%)
Place of birth for the foreign-born population - Saudi Arabia (%)
Place of birth for the foreign-born population - Syria (%)
Place of birth for the foreign-born population - Turkey (%)
Place of birth for the foreign-born population - Yemen (%)
Place of birth for the foreign-born population - Other Western Asia (%)
Place of birth for the foreign-born population - Eritrea (%)
Place of birth for the foreign-born population - Ethiopia (%)
Place of birth for the foreign-born population - Kenya (%)
Place of birth for the foreign-born population - Somalia (%)
Place of birth for the foreign-born population - Uganda (%)
Place of birth for the foreign-born population - Zimbabwe (%)
Place of birth for the foreign-born population - Other Eastern Africa (%)
Place of birth for the foreign-born population - Cameroon (%)
Place of birth for the foreign-born population - Congo (%)
Place of birth for the foreign-born population - Democratic Republic of Congo (Zaire) (%)
Place of birth for the foreign-born population - Other Middle Africa (%)
Place of birth for the foreign-born population - Egypt (%)
Place of birth for the foreign-born population - Morocco (%)
Place of birth for the foreign-born population - Sudan (%)
Place of birth for the foreign-born population - Other Northern Africa (%)
Place of birth for the foreign-born population - South Africa (%)
Place of birth for the foreign-born population - Other Southern Africa (%)
Place of birth for the foreign-born population - Cabo Verde (%)
Place of birth for the foreign-born population - Ghana (%)
Place of birth for the foreign-born population - Liberia (%)
Place of birth for the foreign-born population - Nigeria (%)
Place of birth for the foreign-born population - Senegal (%)
Place of birth for the foreign-born population - Sierra Leone (%)
Place of birth for the foreign-born population - Other Western Africa (%)
Place of birth for the foreign-born population - Australia (%)
Place of birth for the foreign-born population - New Zealand (%)
Place of birth for the foreign-born population - Fiji (%)
Place of birth for the foreign-born population - Micronesia (%)
Place of birth for the foreign-born population - Bahamas (%)
Place of birth for the foreign-born population - Barbados (%)
Place of birth for the foreign-born population - Cuba (%)
Place of birth for the foreign-born population - Dominica (%)
Place of birth for the foreign-born population - Dominican Republic (%)
Place of birth for the foreign-born population - Grenada (%)
Place of birth for the foreign-born population - Haiti (%)
Place of birth for the foreign-born population - Jamaica (%)
Place of birth for the foreign-born population - St. Vincent and the Grenadines (%)
Place of birth for the foreign-born population - Trinidad and Tobago (%)
Place of birth for the foreign-born population - West Indies (%)
Place of birth for the foreign-born population - Other Caribbean (%)
Place of birth for the foreign-born population - Belize (%)
Place of birth for the foreign-born population - Costa Rica (%)
Place of birth for the foreign-born population - El Salvador (%)
Place of birth for the foreign-born population - Guatemala (%)
Place of birth for the foreign-born population - Honduras (%)
Place of birth for the foreign-born population - Mexico (%)
Place of birth for the foreign-born population - Nicaragua (%)
Place of birth for the foreign-born population - Panama (%)
Place of birth for the foreign-born population - Other Central America (%)
Place of birth for the foreign-born population - Argentina (%)
Place of birth for the foreign-born population - Bolivia (%)
Place of birth for the foreign-born population - Brazil (%)
Place of birth for the foreign-born population - Chile (%)
Place of birth for the foreign-born population - Colombia (%)
Place of birth for the foreign-born population - Ecuador (%)
Place of birth for the foreign-born population - Guyana (%)
Place of birth for the foreign-born population - Peru (%)
Place of birth for the foreign-born population - Uruguay (%)
Place of birth for the foreign-born population - Venezuela (%)
Place of birth for the foreign-born population - Other South America (%)
Place of birth for the foreign-born population - Canada (%)
Place of birth for the foreign-born population - Other Northern America (%)
Place of birth for the foreign-born population - Other (%)
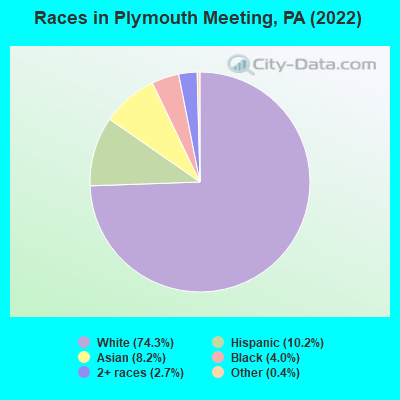
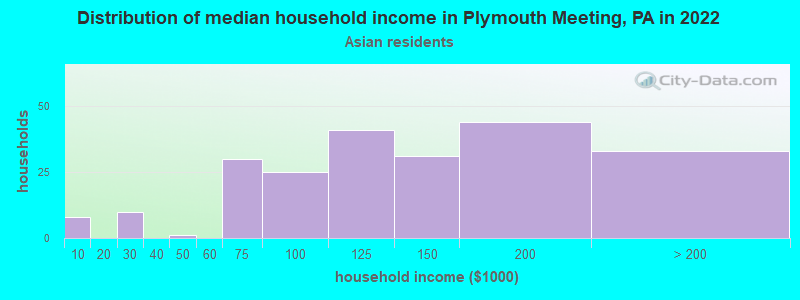
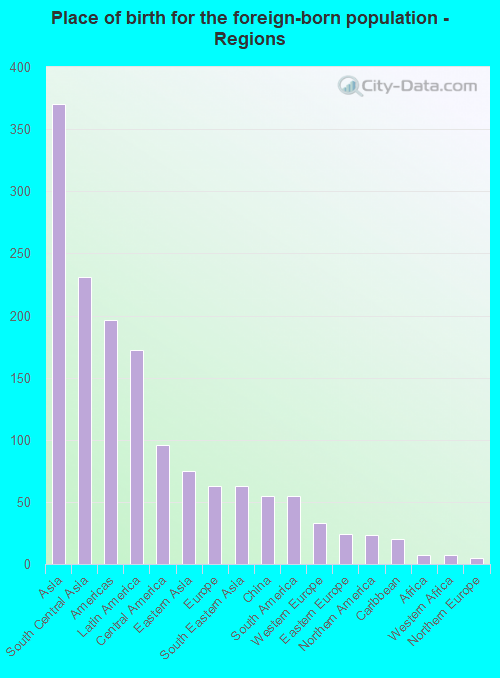
According to 2022 data, the most numerous races in Plymouth Meeting, PA are White alone (5,069 residents), Black alone (271 residents), and Hispanic (694 residents). 86.6% of Plymouth Meeting residents speak English at home. 9.3% of Plymouth Meeting, PA residents are foreign-born (5.3% born in Asia, 2.4% born in Latin America), which is 25.0% greater than the foreign-born rate of 7.0% across the entire state of Pennsylvania.
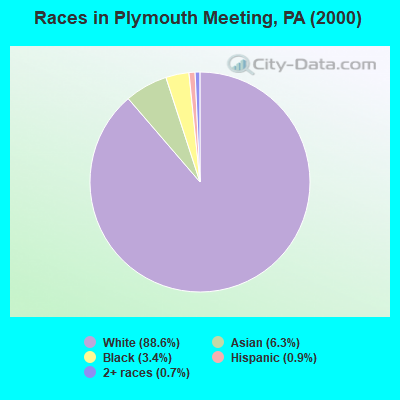
Race distribution in Plymouth Meeting
2000 2022
10,322,455 84.1% White alone 1,202,437 9.8% Black alone 394,088 3.2% Hispanic 218,296 1.8% Asian alone 113,097 0.9% Two or more races 13,086 0.1% Other race alone 14,904 0.1% American Indian alone 2,691 0.02% Native Hawaiian and Other
9,487,228 73.1% White alone 1,311,581 10.1% Black alone 1,115,997 8.6% Hispanic 493,942 3.8% Two or more races 487,124 3.8% Asian alone 63,582 0.5% Other race alone 10,130 0.08% American Indian alone 2,424 0.02% Native Hawaiian and Other
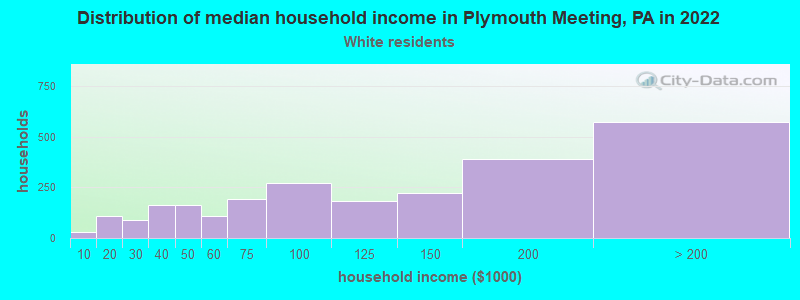
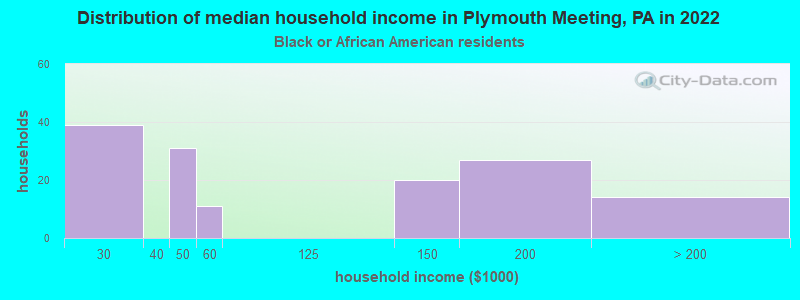
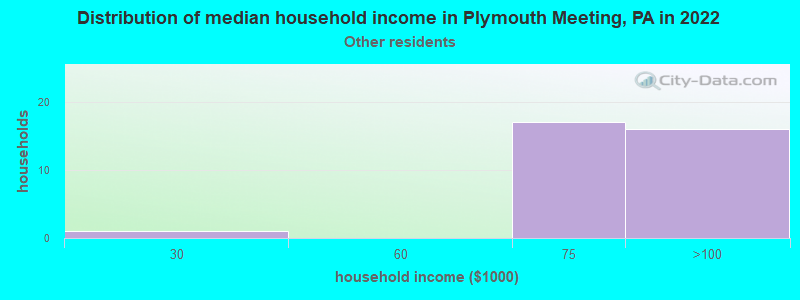
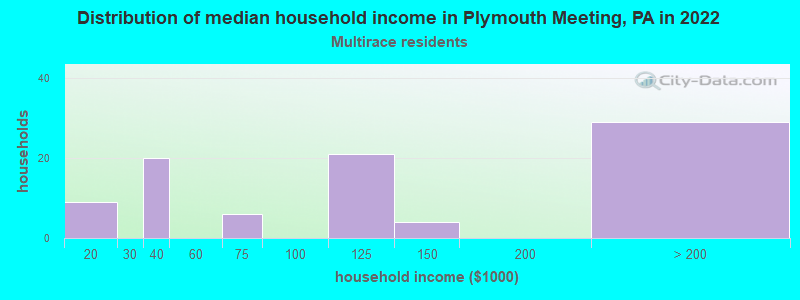
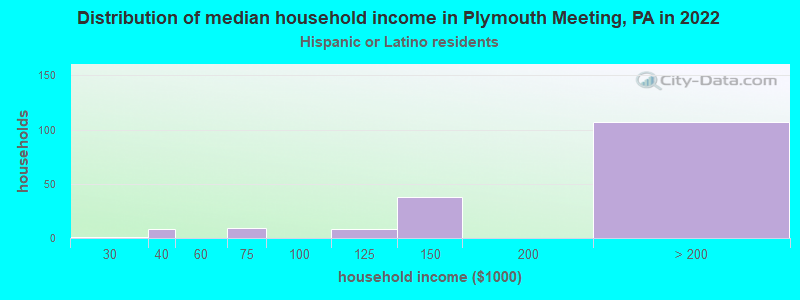
Income and house value in Plymouth Meeting Median household income in 2022 $112,000 White non-Hispanic householders$130,177 Asian householders$100,550 Some other race householders$121,036 Two or more races householders$193,805 Hispanic or Latino race householdersMedian 2022 house value $496,428 White Non-Hispanic householders$495,838 Black or African American householders $753,038 Asian householders$419,828 Two or more races householders$486,116 Hispanic or Latino householders
Median age by race in Plymouth Meeting
41.4 Median age for White residents41.1 42.6 36.7 Median age for Black or African American residents35.0 48.8 -626,180,836.1 Median age for American Indian / Alaska Native residents-1,098,934,549.9 -577,519,379.3 30.7 Median age for Asian residents32.7 29.3 -680,432,644.4 Median age for Native Hawaiian / Pacific Islander residents-649,523,808.9 -747,474,746.7 40.0 Median age for Other race residents37.0 36.9 28.5 Median age for Two or more races residents43.9 10.4 46.9 Median age for White alone residents45.0 48.3 20.3 Median age for Hispanic or Latino residents18.1 33.4
Owner/renter occupied households by race in Plymouth Meeting
House owners and renters - White residents 1,735 69.3% Owner occupied767 30.7% Renter occupiedHouse owners and renters - Black or African American residents 42 31.9% Owner occupied89 68.1% Renter occupiedHouse owners and renters - Asian residents 81 36.2% Owner occupied143 63.8% Renter occupiedHouse owners and renters - Other race residents 1 4.4% Owner occupied25 95.6% Renter occupiedHouse owners and renters - Two or more races residents 58 67.7% Owner occupied28 32.3% Renter occupiedHouse owners and renters - White alone residents 1,624 67.3% Owner occupied790 32.7% Renter occupiedHouse owners and renters - Hispanic or Latino residents 143 88.5% Owner occupied19 11.5% Renter occupied
Language usage in Plymouth Meeting
English speakers - Total 86.6% of residents of Plymouth Meeting speak English at home.
4.9% of residents speak Spanish at home 257 81.3% Speak English very well59 18.7% Speak English less than very well8.2% of residents speak other language at home 389 74.5% Speak English very well133 25.5% Speak English less than very well
English speakers - Born in the United States 96.6% of residents of Plymouth Meeting speak English at home.
2.3% of residents speak Spanish at home 20 74.1% Speak English very well7 25.9% Speak English less than very well0.5% of residents speak other language at home 6 100.0% Speak English very well
English speakers - Native, born elsewhere 65.0% of residents of Plymouth Meeting speak English at home.
25.0% of residents speak Spanish at home 1 20.0% Speak English very well4 80.0% Speak English less than very well
English speakers - Foreign-born 19.6% of residents of Plymouth Meeting speak English at home.
21.9% of residents speak Spanish at home 90 67.2% Speak English very well44 32.8% Speak English less than very well55.6% of residents speak other language at home 211 62.1% Speak English very well129 37.9% Speak English less than very well
White (Caucasian) - Speak only English Native:
96.3% (4,833)Foreign-born:
32.3% (44)
White (Caucasian) - Speak another language Native:
3.6% (182)Foreign-born:
67.5% (92)
Black or African American - Speak only English Native:
98.8% (236)Foreign-born:
100.0% (24)
Asian - Speak only English Native:
39.1% (68)Foreign-born:
13.5% (50)
Asian - Speak another language Native:
61.9% (107)Foreign-born:
86.7% (319)
Other race - Speak another language Native:
53.7% (35)Foreign-born:
100.0% (5)
Two or more races - Speak only English Native:
89.9% (190)Foreign-born:
7.9% (7)
Two or more races - Speak another language Native:
9.3% (20)Foreign-born:
92.5% (87)
White alone - Speak only English Native:
97.5% (4,578)Foreign-born:
58.0% (45)
White alone - Speak another language Native:
2.5% (116)Foreign-born:
41.1% (32)
Hispanic or Latino - Speak another language Native:
27.2% (141)Foreign-born:
100.0% (139)
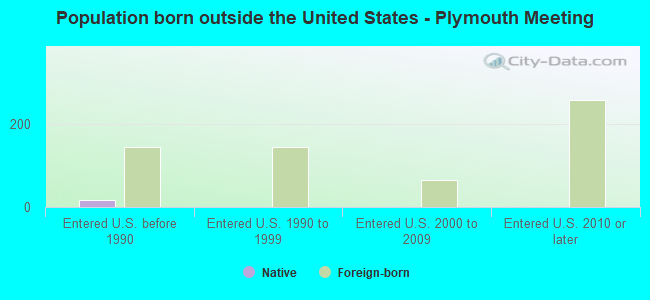
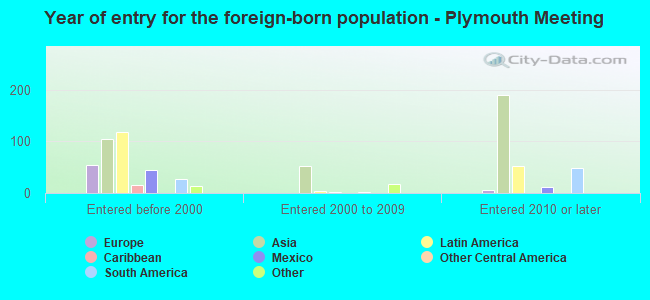
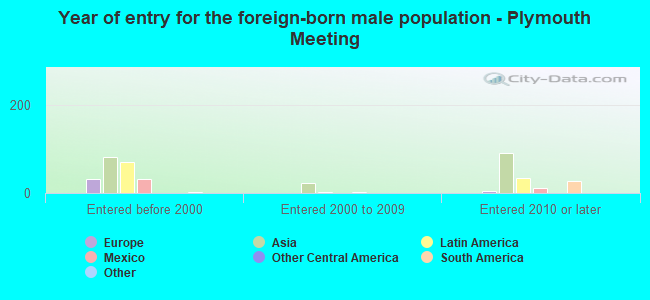
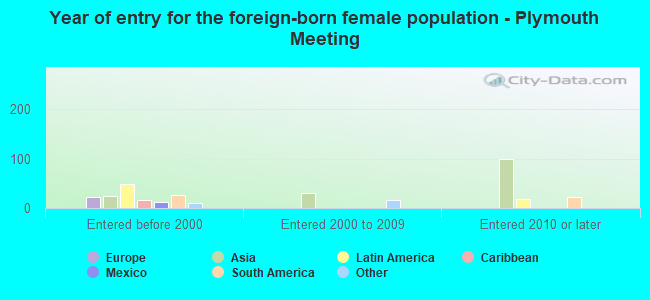
Foreign-born residents in Plymouth Meeting 637 residents are foreign born (5.3% Asia , 2.4% Latin America ).
This city:
9.3%Pennsylvania:
7.3%
Marital status for residents in Plymouth Meeting Marital status - White (Caucasian) population 15 years and over
Males 24.7% Never married62.2% Now married0.0% Separated6.1% Widowed6.9% DivorcedFemales 25.9% Never married48.5% Now married1.4% Separated10.7% Widowed13.5% DivorcedWomen who gave birth in the past 12 months Now married:
100.0% (88)Unmarried:
0.0% (0)
Women who did not give birth in the past 12 months Now married:
44.3% (502)Unmarried:
55.7% (632)
Marital status - Black or African American population 15 years and over
Males 19.7% Never married42.6% Now married0.0% Separated0.0% Widowed37.7% DivorcedFemales 16.1% Never married27.1% Now married0.0% Separated34.7% Widowed22.0% DivorcedWomen who gave birth in the past 12 months Now married:
100.0% (20)Unmarried:
0.0% (0)
Women who did not give birth in the past 12 months Now married:
0.0% (0)Unmarried:
100.0% (36)
Marital status - Asian population 15 years and over
Males 25.2% Never married60.0% Now married3.0% Separated7.0% Widowed4.8% DivorcedFemales 9.4% Never married81.3% Now married4.4% Separated0.0% Widowed5.0% DivorcedWomen who gave birth in the past 12 months Now married:
100.0% (18)Unmarried:
0.0% (0)
Women who did not give birth in the past 12 months Now married:
80.2% (95)Unmarried:
19.8% (24)
Marital status - Other race population 15 years and over
Males 0.0% Never married94.4% Now married5.6% Separated0.0% Widowed0.0% DivorcedFemales 0.0% Never married53.6% Now married46.4% Separated0.0% Widowed0.0% DivorcedWomen who did not give birth in the past 12 months Now married:
100.0% (35)Unmarried:
0.0% (0)
Marital status - Two or more races population 15 years and over
Males 33.0% Never married51.8% Now married0.0% Separated0.0% Widowed15.2% DivorcedFemales 33.9% Never married32.3% Now married0.0% Separated9.7% Widowed24.2% DivorcedWomen who did not give birth in the past 12 months Now married:
27.7% (17)Unmarried:
72.3% (46)
Marital status - White alone, not Hispanic / Latino population 15 years and over
Males 24.4% Never married61.9% Now married0.0% Separated6.4% Widowed7.3% DivorcedFemales 27.4% Never married46.6% Now married1.5% Separated11.3% Widowed13.3% DivorcedWomen who gave birth in the past 12 months Now married:
100.0% (79)Unmarried:
0.0% (0)
Women who did not give birth in the past 12 months Now married:
40.0% (412)Unmarried:
60.0% (618)
Marital status - Hispanic or Latino population 15 years and over
Males 31.1% Never married61.6% Now married0.6% Separated0.0% Widowed6.8% DivorcedFemales 1.1% Never married80.4% Now married0.0% Separated0.0% Widowed18.5% DivorcedWomen who gave birth in the past 12 months Now married:
100.0% (12)Unmarried:
0.0% (0)
Women who did not give birth in the past 12 months Now married:
79.0% (137)Unmarried:
21.0% (36)
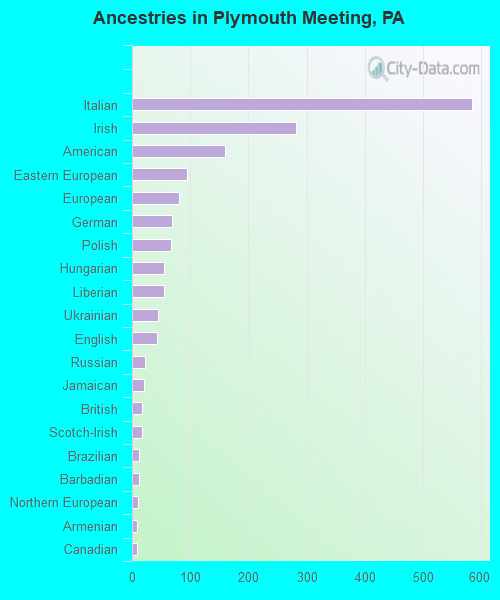
Ancestries in Plymouth Meeting
584 22.4% Italian281 10.8% Irish160 6.1% American95 3.7% Eastern European81 3.1% European68 2.6% German67 2.6% Polish55 2.1% Hungarian55 2.1% Liberian45 1.7% Ukrainian43 1.7% English23 0.9% Russian20 0.8% Jamaican18 0.7% British17 0.7% Scotch-Irish12 0.5% Brazilian12 0.5% Barbadian11 0.4% Northern European9 0.3% Armenian9 0.3% Canadian5 0.2% Greek
Children Nativity (place of birth) in Plymouth Meeting
Children under 6 years - Living with two parents Both parents native 372 100.0% NativeBoth parents foreign-born 56 100.0% NativeOne native, one foreign-born parent 16 100.0% NativeChildren under 6 years - Living with one parent Native parent 78 100.0% NativeChildren 6 to 17 years - Living with two parents Both parents native 436 100.0% NativeBoth parents foreign-born 70 89.1% Native9 10.9% Foreign-bornOne native, one foreign-born parent 139 100.0% NativeChildren 6 to 17 years - Living with one parent Native parent 165 100.0% NativeForeign-born parent 35 56.2% Native27 43.8% Foreign-born
Grandparents responsible for own grandchildren in Plymouth Meeting
Grandparents (30 to 59 years) Black or African American 8 100.0% Not responsible for grandchildrenOther race 2 100.0% Not responsible for grandchildrenHispanic or Latino 1 100.0% Not responsible for grandchildren
Grandparents (60 years and over)