Races in Plymouth, Michigan (MI) Detailed Stats
Ancestries, Foreign-born residents, place of birth
Settings
X


Recent posts about races in Plymouth, Michigan on our local forum with over 2,400,000 registered users:
 | Where are most ASIANS in the DETROIT metro area? (30 replies) |
| Please recommend a Detroit area to a mid 30s native couple who have been spoiled by the west coast! (35 replies) |
| Van Buren School to Plymouth Canton Schools (4 replies) |
| The First Thing That Comes To Mind… (4 replies) |
| Considering moving to WWC from Allen Park (6 replies) |
| Moving to Detroit/Ann Arbor (19 replies) |
Latest news about races in Plymouth, MI collected exclusively by city-data.com from local newspapers, TV, and radio stations
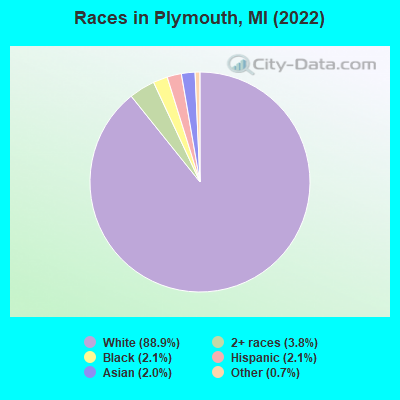
According to 2022 data, the most numerous races in Plymouth, MI are White alone (8,151 residents), Black alone (197 residents), and Hispanic (192 residents). 94.4% of Plymouth residents speak English at home. 4.5% of Plymouth, MI residents are foreign-born (2.0% born in Europe, 0.9% born in Asia, 0.9% born in North America, 0.6% born in Latin America), which is 34.6% less than the foreign-born rate of 6.0% across the entire state of Michigan.
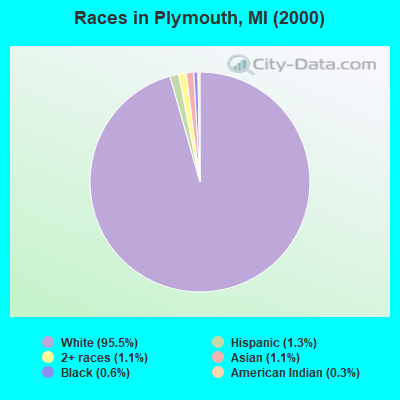
Race distribution in Plymouth
2000
2022

- 8,61695.5%White alone
- 1181.3%Hispanic
- 1001.1%Two or more races
- 951.1%Asian alone
- 510.6%Black alone
- 310.3%American Indian alone
- 60.07%Other race alone
- 50.06%Native Hawaiian and Other
Pacific Islander alone
-
- 8,15188.9%White alone
- 3483.8%Two or more races
- 1972.1%Black alone
- 1922.1%Hispanic
- 1842.0%Asian alone
- 630.7%Other race alone
- 40.04%American Indian alone
2000
2022
-
- 7,806,69178.6%White alone
- 1,402,04714.1%Black alone
- 323,8773.3%Hispanic
- 175,3111.8%Asian alone
- 163,4871.6%Two or more races
- 53,4210.5%American Indian alone
- 11,4650.1%Other race alone
- 2,1450.02%Native Hawaiian and Other
Pacific Islander alone

-
- 7,289,05172.6%White alone
- 1,310,46413.1%Black alone
- 572,4055.7%Hispanic
- 450,0314.5%Two or more races
- 335,7323.3%Asian alone
- 45,2170.5%Other race alone
- 29,0110.3%American Indian alone
- 2,2070.02%Native Hawaiian and Other
Pacific Islander alone

Income and house value in Plymouth
- Median household income in 2022
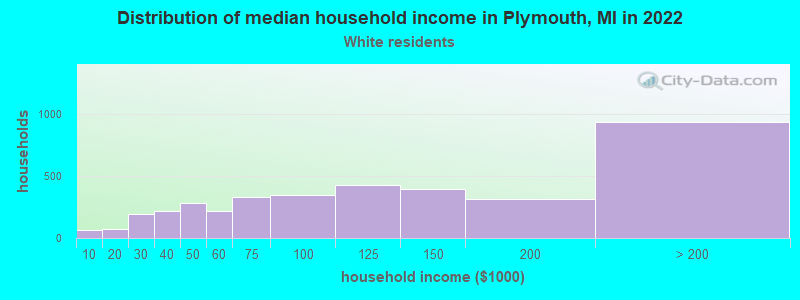
- $106,540White non-Hispanic householders
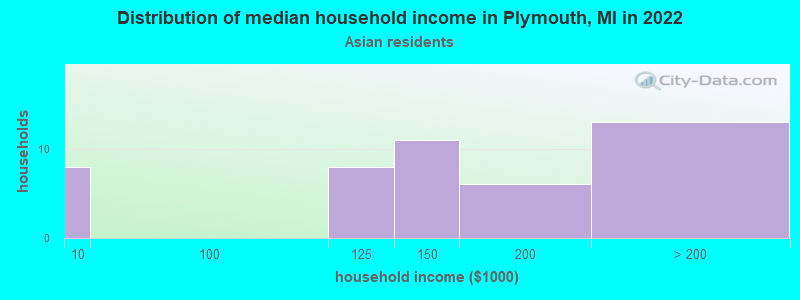
- $113,720Asian householders
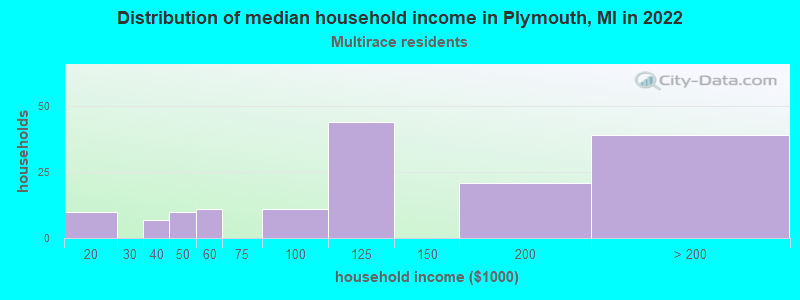
- $91,257Two or more races householders
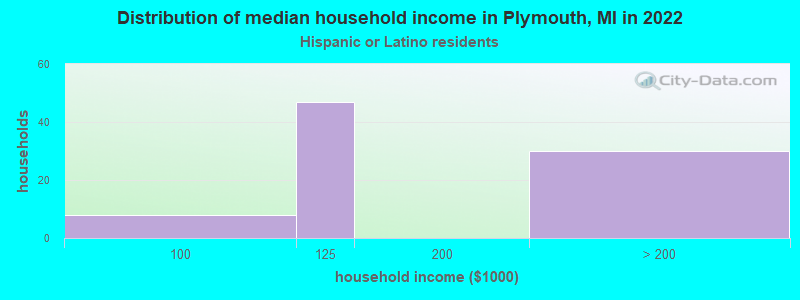
- $99,723Hispanic or Latino race householders
- Median 2022 house value
- $464,088White Non-Hispanic householders
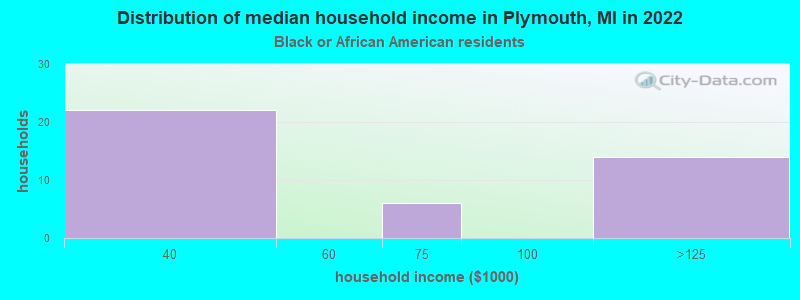
- $356,293Black or African American householders
- $97,170American Indian or Alaska Native householders
- $842,147Asian householders
- $421,073Some other race householders
- $529,128Two or more races householders
- $246,166Hispanic or Latino householders
Household income for White non-Hispanic householders
Household income for Black householders
Household income for Asian householders
Household income for Two or more races householders
Household income for Hispanic or Latino race householders
Median age by race in Plymouth
- 46.2Median age for White residents
- 45.7Males
- 46.3Females
- 56.4Median age for Black or African American residents
- 57.0Males
- 55.7Females
- -738,693,466.6Median age for American Indian / Alaska Native residents
- -795,074,757.3Males
- -684,380,031.5Females
- 26.7Median age for Asian residents
- 48.7Males
- 21.4Females
- -934,108,526.2Median age for Native Hawaiian / Pacific Islander residents
- -674,772,035.8Males
- -699,588,476.7Females
- 58.7Median age for Other race residents
- -747,549,018.9Males
- 56.7Females
- 23.0Median age for Two or more races residents
- 22.7Males
- 17.0Females
- 45.9Median age for White alone residents
- 45.7Males
- 46.1Females
- 29.4Median age for Hispanic or Latino residents
- 29.7Males
- 18.2Females
Owner/renter occupied households by race in Plymouth
- House owners and renters - White residents
- 2,63168.9%Owner occupied
- 1,19031.1%Renter occupied
- House owners and renters - Black or African American residents
- 1332.7%Owner occupied
- 2767.3%Renter occupied
- House owners and renters - American Indian / Alaska Native residents
- 7100.0%Owner occupied
- House owners and renters - Asian residents
- 59100.0%Owner occupied
- House owners and renters - Other race residents
- 35100.0%Renter occupied
- House owners and renters - Two or more races residents
- 8149.6%Owner occupied
- 8250.4%Renter occupied
- House owners and renters - White alone residents
- 2,65468.7%Owner occupied
- 1,21131.3%Renter occupied
- House owners and renters - Hispanic or Latino residents
- 4049.1%Owner occupied
- 4150.9%Renter occupied
Language usage in Plymouth
- English speakers - Total
- 94.4% of residents of Plymouth speak English at home.
- 2.5% of residents speak Spanish at home
- 215100.0%Speak English very well
- 2.9% of residents speak other language at home
- 16364.4%Speak English very well
- 9035.6%Speak English less than very well
- English speakers - Born in the United States
- 93.8% of residents of Plymouth speak English at home.
- 5.6% of residents speak Spanish at home
- 100100.0%Speak English very well
All residents speak only English at home
- English speakers - Foreign-born
- 52.8% of residents of Plymouth speak English at home.
- 4.4% of residents speak Spanish at home
- 18100.0%Speak English very well
- 39.8% of residents speak other language at home
- 10967.3%Speak English very well
- 5332.7%Speak English less than very well
White (Caucasian) - Speak only English
| Native: | 97.3% (7,223) |
| Foreign-born: | 57.9% (162) |
White (Caucasian) - Speak another language
| Native: | 3.4% (251) |
| Foreign-born: | 42.9% (120) |
American Indian / Alaska Native - Speak only English
| Native: | 82.8% (5) |
| Foreign-born: | 24.8% (4) |
Asian - Speak only English
| Native: | 94.1% (74) |
| Foreign-born: | 57.4% (55) |
White alone - Speak only English
| Native: | 96.7% (7,262) |
| Foreign-born: | 54.7% (161) |
White alone - Speak another language
| Native: | 3.6% (270) |
| Foreign-born: | 43.9% (129) |
Hispanic or Latino - Speak only English
| Native: | 98.2% (149) |
| Foreign-born: | 31.2% (9) |
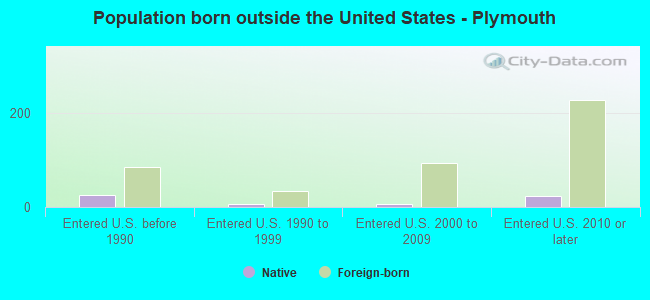
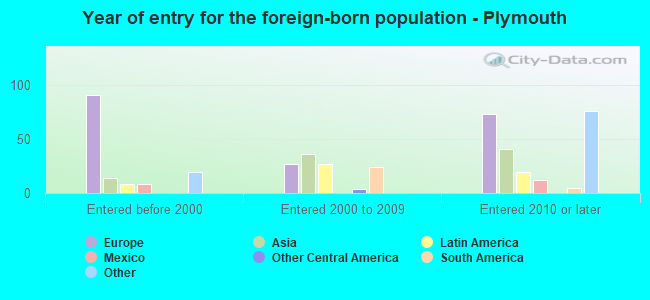
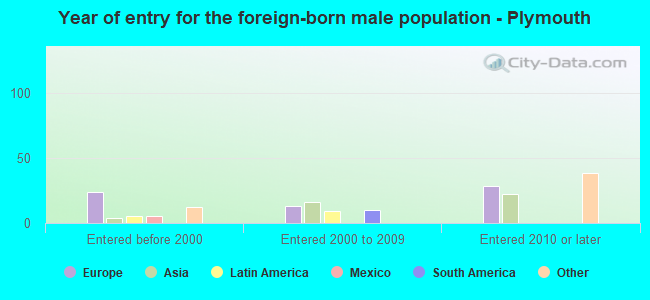
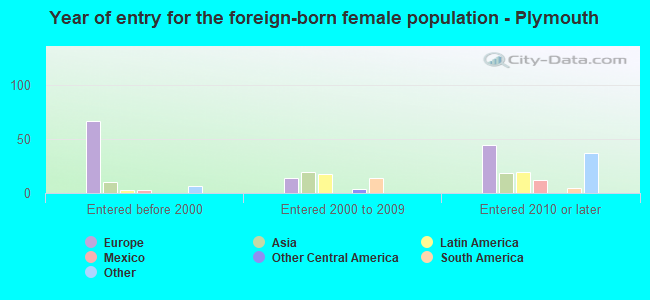
Foreign-born residents in Plymouth
409 residents are foreign born (2.0% Europe, 0.9% Asia, 0.9% North America, 0.6% Latin America).
| This city: | 4.5% |
| Michigan: | 6.9% |
Marital status for residents in Plymouth
Marital status - White (Caucasian) population 15 years and over
- Males
- 31.9%Never married
- 51.2%Now married
- 0.0%Separated
- 2.6%Widowed
- 14.3%Divorced
- Females
- 29.4%Never married
- 46.2%Now married
- 0.4%Separated
- 13.2%Widowed
- 10.8%Divorced
Women who gave birth in the past 12 months
| Now married: | 100.0% (83) |
| Unmarried: | 0.0% (0) |
Women who did not give birth in the past 12 months
| Now married: | 43.4% (755) |
| Unmarried: | 56.6% (985) |
Marital status - Black or African American population 15 years and over
- Males
- 45.0%Never married
- 5.0%Now married
- 0.0%Separated
- 8.3%Widowed
- 41.7%Divorced
- Females
- 22.0%Never married
- 38.1%Now married
- 5.1%Separated
- 30.5%Widowed
- 4.2%Divorced
Women who did not give birth in the past 12 months
| Now married: | 77.6% (43) |
| Unmarried: | 22.4% (12) |
Marital status - American Indian / Alaska Native population 15 years and over
- Males
- 0.0%Never married
- 100.0%Now married
- 0.0%Separated
- 0.0%Widowed
- 0.0%Divorced
- Females
- 100.0%Never married
- 0.0%Now married
- 0.0%Separated
- 0.0%Widowed
- 0.0%Divorced
Women who did not give birth in the past 12 months
| Now married: | 0.0% (0) |
| Unmarried: | 100.0% (8) |
Marital status - Asian population 15 years and over
- Males
- 0.0%Never married
- 63.6%Now married
- 0.0%Separated
- 0.0%Widowed
- 36.4%Divorced
- Females
- 21.7%Never married
- 65.1%Now married
- 0.0%Separated
- 0.0%Widowed
- 13.3%Divorced
Women who did not give birth in the past 12 months
| Now married: | 75.0% (53) |
| Unmarried: | 25.0% (18) |
Marital status - Other race population 15 years and over
- Males
- 0.0%Never married
- 100.0%Now married
- 0.0%Separated
- 0.0%Widowed
- 0.0%Divorced
- Females
- 16.3%Never married
- 83.7%Now married
- 0.0%Separated
- 0.0%Widowed
- 0.0%Divorced
Women who did not give birth in the past 12 months
| Now married: | 46.7% (8) |
| Unmarried: | 53.3% (9) |
Marital status - Two or more races population 15 years and over
- Males
- 52.0%Never married
- 32.7%Now married
- 15.3%Separated
- 0.0%Widowed
- 0.0%Divorced
- Females
- 38.5%Never married
- 34.6%Now married
- 0.0%Separated
- 0.0%Widowed
- 26.9%Divorced
Women who did not give birth in the past 12 months
| Now married: | 36.2% (24) |
| Unmarried: | 63.8% (42) |
Marital status - White alone, not Hispanic / Latino population 15 years and over
- Males
- 31.8%Never married
- 51.3%Now married
- 0.0%Separated
- 2.6%Widowed
- 14.4%Divorced
- Females
- 29.4%Never married
- 46.2%Now married
- 0.4%Separated
- 13.3%Widowed
- 10.8%Divorced
Women who gave birth in the past 12 months
| Now married: | 100.0% (85) |
| Unmarried: | 0.0% (0) |
Women who did not give birth in the past 12 months
| Now married: | 43.4% (771) |
| Unmarried: | 56.6% (1,006) |
Marital status - Hispanic or Latino population 15 years and over
- Males
- 63.5%Never married
- 9.4%Now married
- 27.1%Separated
- 0.0%Widowed
- 0.0%Divorced
- Females
- 50.8%Never married
- 29.2%Now married
- 0.0%Separated
- 20.0%Widowed
- 0.0%Divorced
Women who did not give birth in the past 12 months
| Now married: | 39.6% (20) |
| Unmarried: | 60.4% (30) |
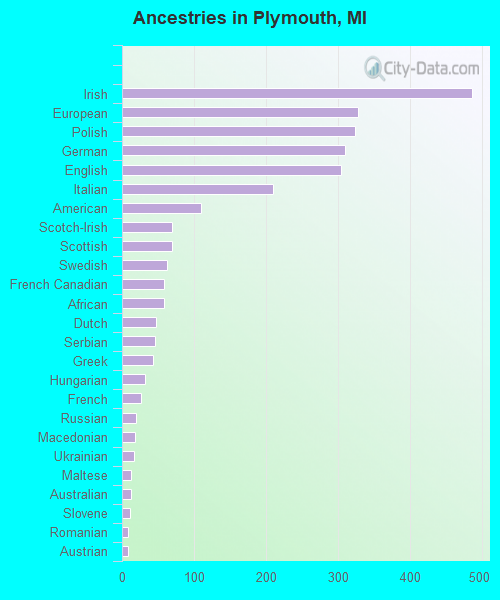
Ancestries in Plymouth

- 48514.0%Irish
- 3279.4%European
- 3239.3%Polish
- 3098.9%German
- 3048.8%English
- 2106.1%Italian
- 1103.2%American
- 702.0%Scotch-Irish
- 692.0%Scottish
- 621.8%Swedish
- 581.7%French Canadian
- 581.7%African
- 471.4%Dutch
- 461.3%Serbian
- 431.2%Greek
- 320.9%Hungarian
- 270.8%French
- 190.5%Russian
- 180.5%Macedonian
- 160.5%Ukrainian
- 130.4%Maltese
- 120.3%Australian
- 110.3%Slovene
- 90.3%Romanian
- 80.2%Austrian
- 70.2%British
- 70.2%Turkish
- 60.2%Eastern European
- 60.2%Lithuanian
- 60.2%Slovak
- 40.1%Scandinavian
- 30.09%Jordanian
- 30.09%Arab
- 30.09%Assyrian
- 30.09%Croatian
- 20.06%Belgian
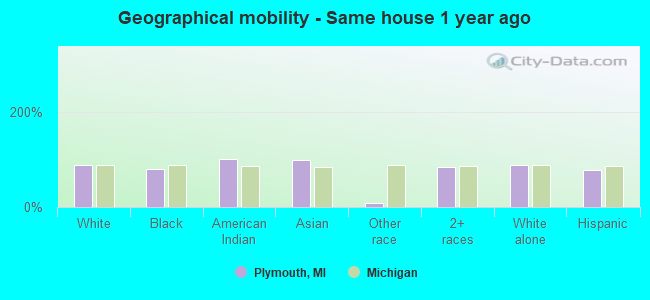
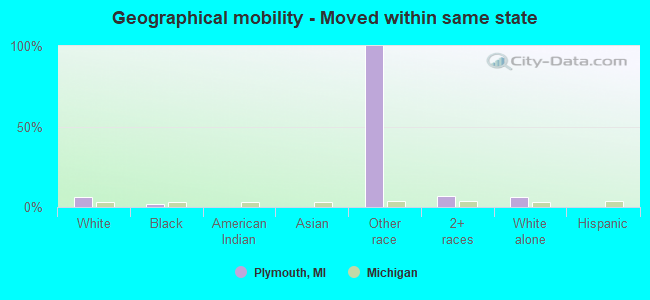
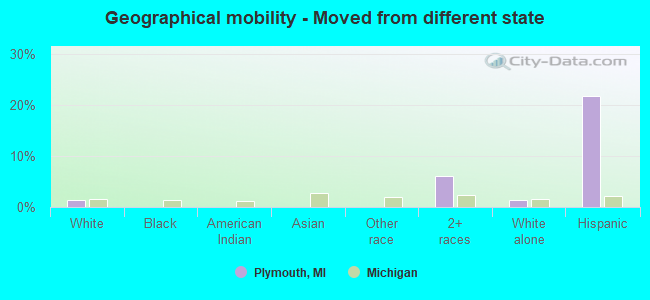
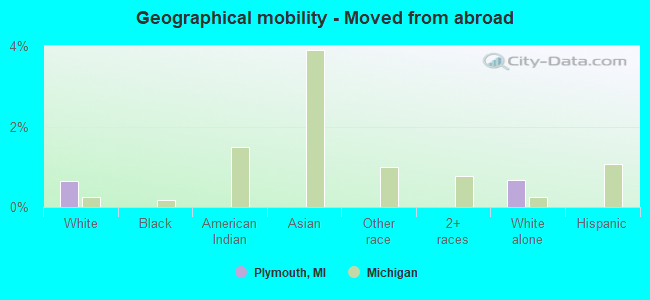
Geographical mobility in Plymouth

- Same house 1 year ago
- 6,99887.8%White (Caucasian)
- 19079.5%Black or African American
- 16100.0%American Indian / Alaska Native
- 18299.0%Asian
- 78.1%Other race
- 41783.0%Two or more races
- 7,09087.5%White alone, not Hispanic / Latino
- 15077.5%Hispanic or Latino
-
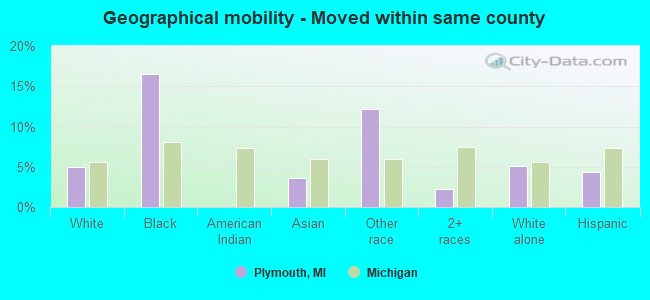
- Moved within same county
- 3934.9%White / Caucasian
- 3916.5%Black or African American
- 73.6%Asian
- 1112.2%Other race
- 112.3%Two or more races
- 4165.1%White alone, not Hispanic / Latino
- 84.3%Hispanic or Latino
-
- Moved within same state
- 4585.7%White / Caucasian
- 52.2%Black or African American
- 110100.0%Other race
- 346.7%Two or more races
- 4675.8%White alone, not Hispanic / Latino
-
- Moved from different state
- 1061.3%White / Caucasian
- 306.0%Two or more races
- 1051.3%White alone, not Hispanic / Latino
- 4221.8%Hispanic or Latino
-
- Moved from abroad
- 510.6%White
- 540.7%White alone, not Hispanic / Latino
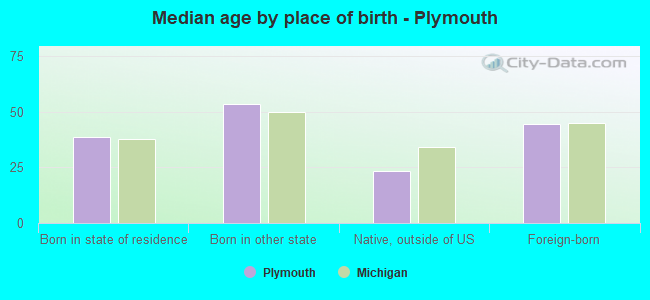
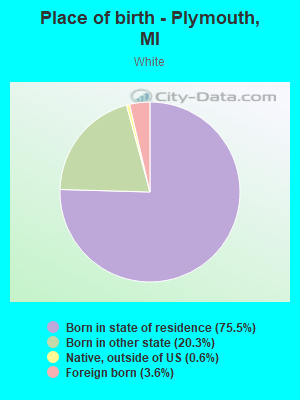
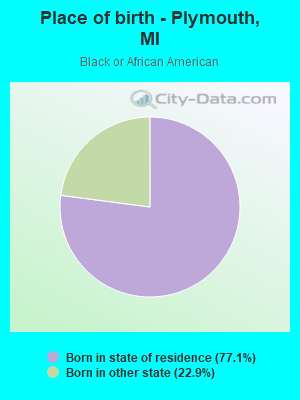
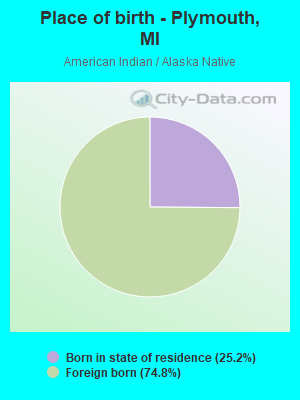
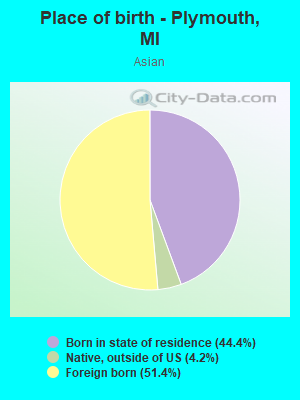
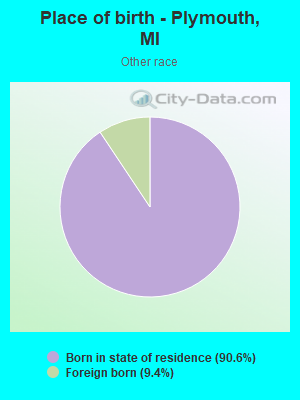
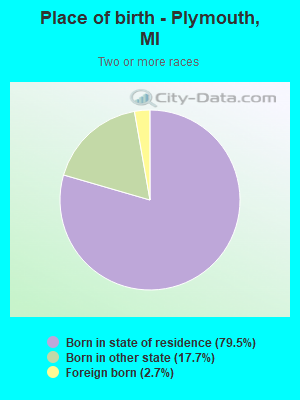
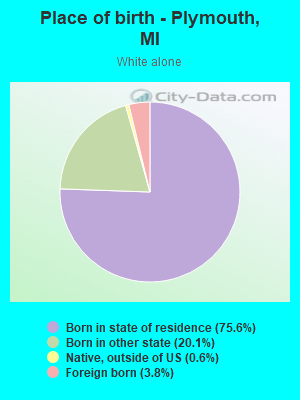
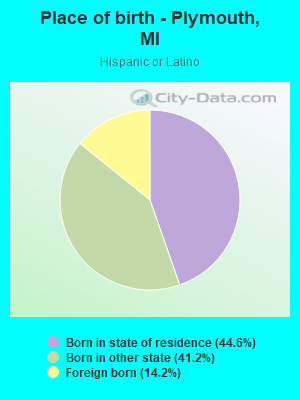
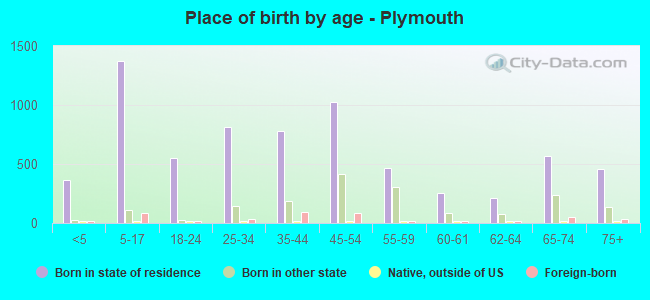
Children Nativity (place of birth) in Plymouth
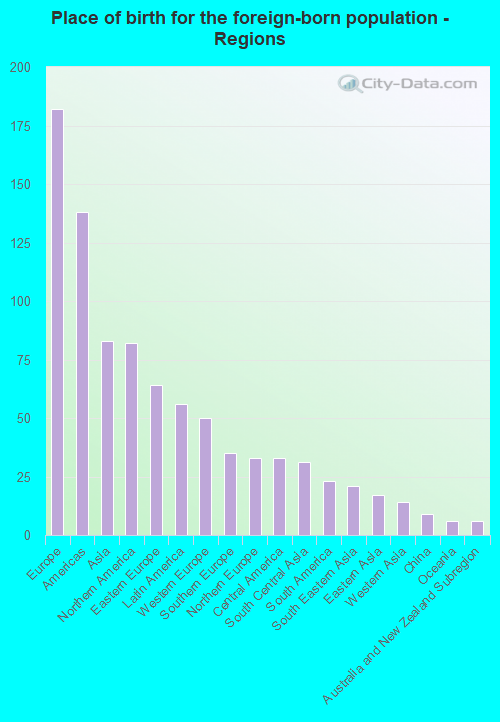
Place of birth for residents in Plymouth
![Place of birth for the foreign-born population - Regions]()
- 182Europe
- 138Americas
- 83Asia
- 82Northern America
- 64Eastern Europe
- 56Latin America
- 50Western Europe
- 35Southern Europe
- 33Northern Europe
- 33Central America
- 31South Central Asia
- 23South America
- 21South Eastern Asia
- 17Eastern Asia
- 14Western Asia
- 9China
- 6Oceania
- 6Australia and New Zealand Subregion
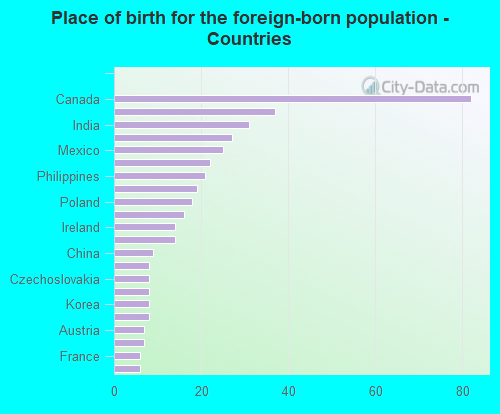
![Place of birth for the foreign-born population - Countries]()
- 82Canada
- 37Germany
- 31India
- 27Italy
- 25Mexico
- 22North Macedonia (Macedonia)
- 21Philippines
- 19United Kingdom
- 18Poland
- 16Brazil
- 14Ireland
- 14Turkey
- 9China
- 8Greece
- 8Czechoslovakia
- 8Hungary
- 8Korea
- 8Guatemala
- 7Austria
- 7Peru
- 6France
- 6Australia
Grandparents responsible for own grandchildren in Plymouth
Zip codes: 48170.