Races in Plymouth, Minnesota (MN) Detailed Stats
Data:
Races - White alone (%)
Races - White alone (% change since 2000)
Races - Black alone (%)
Races - Black alone (% change since 2000)
Races - American Indian alone (%)
Races - American Indian alone (% change since 2000)
Races - Asian alone (%)
Races - Asian alone (% change since 2000)
Races - Hispanic (%)
Races - Hispanic (% change since 2000)
Races - Native Hawaiian and Other Pacific Islander alone (%)
Races - Native Hawaiian and Other Pacific Islander alone (% change since 2000)
Races - Two or more races(%)
Races - Two or more races(% change since 2000)
Races - Other race alone (%)
Races - Other race alone (% change since 2000)
Racial diversity
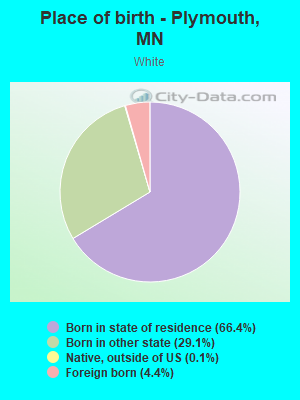
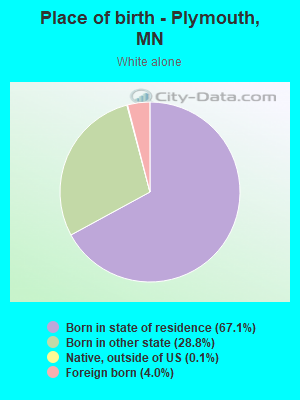
Place of birth - Born in state of residence (%)
Place of birth - Born in state of residence (%) - White
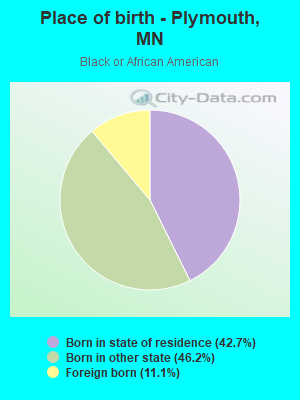
Place of birth - Born in state of residence (%) - Black or African American
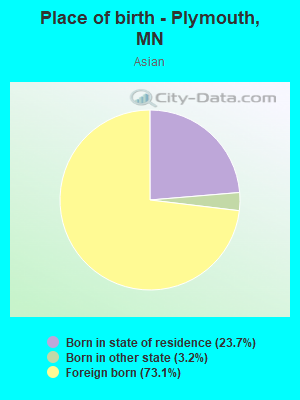
Place of birth - Born in state of residence (%) - Asian
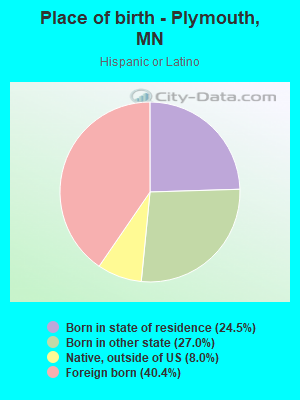
Place of birth - Born in state of residence (%) - Hispanic or Latino
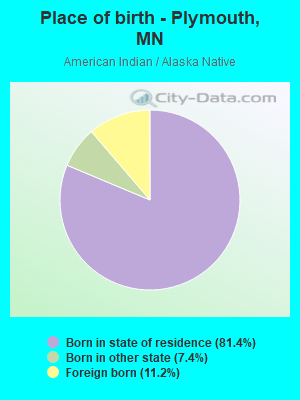
Place of birth - Born in state of residence (%) - American Indian and Alaska Native
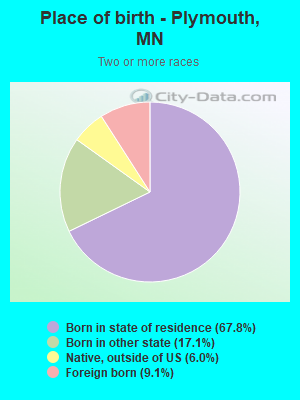
Place of birth - Born in state of residence (%) - Multirace
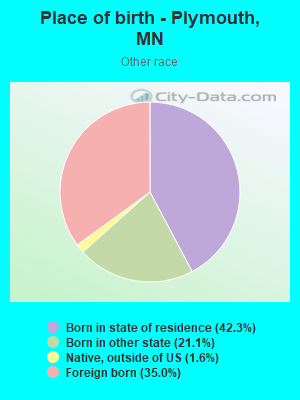
Place of birth - Born in state of residence (%) - Other Race
Place of birth - Born in other state (%)
Place of birth - Born in other state (%) - White
Place of birth - Born in other state (%) - Black or African American
Place of birth - Born in other state (%) - Asian
Place of birth - Born in other state (%) - Hispanic or Latino
Place of birth - Born in other state (%) - American Indian and Alaska Native
Place of birth - Born in other state (%) - Multirace
Place of birth - Born in other state (%) - Other Race
Place of birth - Native, outside of US (%)
Place of birth - Native, outside of US (%) - White
Place of birth - Native, outside of US (%) - Black or African American
Place of birth - Native, outside of US (%) - Asian
Place of birth - Native, outside of US (%) - Hispanic or Latino
Place of birth - Native, outside of US (%) - American Indian and Alaska Native
Place of birth - Native, outside of US (%) - Multirace
Place of birth - Native, outside of US (%) - Other Race
Place of birth - Foreign born (%)
Place of birth - Foreign born (%) - White
Place of birth - Foreign born (%) - Black or African American
Place of birth - Foreign born (%) - Asian
Place of birth - Foreign born (%) - Hispanic or Latino
Place of birth - Foreign born (%) - American Indian and Alaska Native
Place of birth - Foreign born (%) - Multirace
Place of birth - Foreign born (%) - Other Race
Residents speaking English at home (%)
Residents speaking English at home - Born in the United States (%)
Residents speaking English at home - Native, born elsewhere (%)
Residents speaking English at home - Foreign born (%)
Residents speaking Spanish at home (%)
Residents speaking Spanish at home - Born in the United States (%)
Residents speaking Spanish at home - Native, born elsewhere (%)
Residents speaking Spanish at home - Foreign born (%)
Residents speaking other language at home (%)
Residents speaking other language at home - Born in the United States (%)
Residents speaking other language at home - Native, born elsewhere (%)
Residents speaking other language at home - Foreign born (%)
Marital status - Never married (%)
Marital status - Now married (%)
Marital status - Separated (%)
Marital status - Widowed (%)
Marital status - Divorced (%)
Ancestries Reported - Arab (%)
Ancestries Reported - Czech (%)
Ancestries Reported - Danish (%)
Ancestries Reported - Dutch (%)
Ancestries Reported - English (%)
Ancestries Reported - French (%)
Ancestries Reported - French Canadian (%)
Ancestries Reported - German (%)
Ancestries Reported - Greek (%)
Ancestries Reported - Hungarian (%)
Ancestries Reported - Irish (%)
Ancestries Reported - Italian (%)
Ancestries Reported - Lithuanian (%)
Ancestries Reported - Norwegian (%)
Ancestries Reported - Polish (%)
Ancestries Reported - Portuguese (%)
Ancestries Reported - Russian (%)
Ancestries Reported - Scotch-Irish (%)
Ancestries Reported - Scottish (%)
Ancestries Reported - Slovak (%)
Ancestries Reported - Subsaharan African (%)
Ancestries Reported - Swedish (%)
Ancestries Reported - Swiss (%)
Ancestries Reported - Ukrainian (%)
Ancestries Reported - United States (%)
Ancestries Reported - Welsh (%)
Ancestries Reported - West Indian (%)
Ancestries Reported - Other (%)
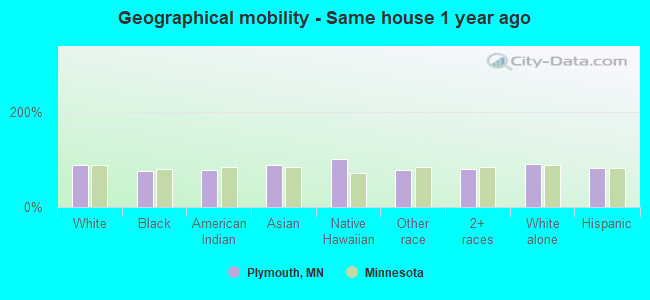
Geographical mobility - Same house 1 year ago (%)
Geographical mobility - Same house 1 year ago (%) - White
Geographical mobility - Same house 1 year ago (%) - Black or African American
Geographical mobility - Same house 1 year ago (%) - Asian
Geographical mobility - Same house 1 year ago (%) - Hispanic or Latino
Geographical mobility - Same house 1 year ago (%) - American Indian and Alaska Native
Geographical mobility - Same house 1 year ago (%) - Multirace
Geographical mobility - Same house 1 year ago (%) - Other Race
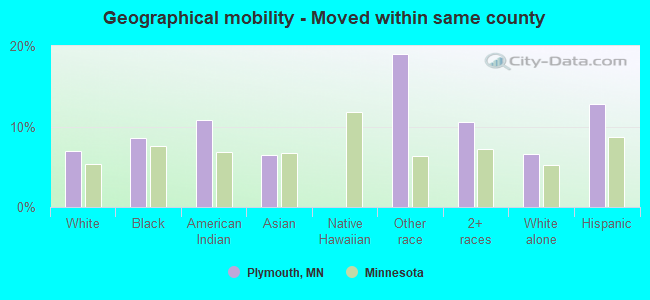
Geographical mobility - Moved within same county (%)
Geographical mobility - Moved within same county (%) - White
Geographical mobility - Moved within same county (%) - Black or African American
Geographical mobility - Moved within same county (%) - Asian
Geographical mobility - Moved within same county (%) - Hispanic or Latino
Geographical mobility - Moved within same county (%) - American Indian and Alaska Native
Geographical mobility - Moved within same county (%) - Multirace
Geographical mobility - Moved within same county (%) - Other Race
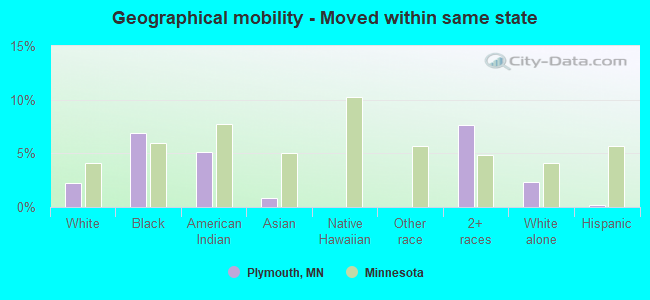
Geographical mobility - Moved from different county within same state (%)
Geographical mobility - Moved from different county within same state (%) - White
Geographical mobility - Moved from different county within same state (%) - Black or African American
Geographical mobility - Moved from different county within same state (%) - Asian
Geographical mobility - Moved from different county within same state (%) - Hispanic or Latino
Geographical mobility - Moved from different county within same state (%) - American Indian and Alaska Native
Geographical mobility - Moved from different county within same state (%) - Multirace
Geographical mobility - Moved from different county within same state (%) - Other Race
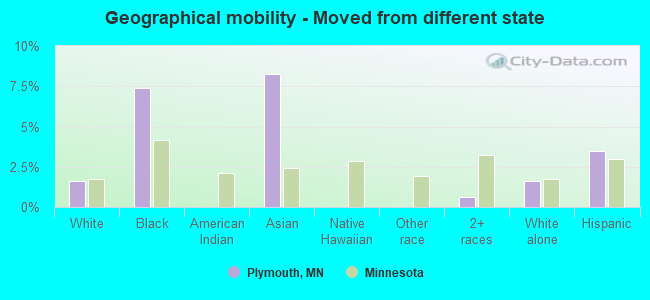
Geographical mobility - Moved from different state (%)
Geographical mobility - Moved from different state (%) - White
Geographical mobility - Moved from different state (%) - Black or African American
Geographical mobility - Moved from different state (%) - Asian
Geographical mobility - Moved from different state (%) - Hispanic or Latino
Geographical mobility - Moved from different state (%) - American Indian and Alaska Native
Geographical mobility - Moved from different state (%) - Multirace
Geographical mobility - Moved from different state (%) - Other Race
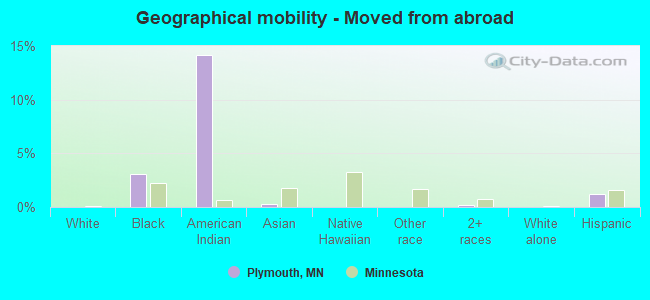
Geographical mobility - Moved from abroad (%)
Geographical mobility - Moved from abroad (%) - White
Geographical mobility - Moved from abroad (%) - Black or African American
Geographical mobility - Moved from abroad (%) - Asian
Geographical mobility - Moved from abroad (%) - Hispanic or Latino
Geographical mobility - Moved from abroad (%) - American Indian and Alaska Native
Geographical mobility - Moved from abroad (%) - Multirace
Geographical mobility - Moved from abroad (%) - Other Race
Place of birth for the foreign-born population - Ireland (%)
Place of birth for the foreign-born population - Denmark (%)
Place of birth for the foreign-born population - Norway (%)
Place of birth for the foreign-born population - Sweden (%)
Place of birth for the foreign-born population - United Kingdom (%)
Place of birth for the foreign-born population - England (%)
Place of birth for the foreign-born population - Scotland (%)
Place of birth for the foreign-born population - Other Northern Europe (%)
Place of birth for the foreign-born population - Austria (%)
Place of birth for the foreign-born population - Belgium (%)
Place of birth for the foreign-born population - France (%)
Place of birth for the foreign-born population - Germany (%)
Place of birth for the foreign-born population - Netherlands (%)
Place of birth for the foreign-born population - Switzerland (%)
Place of birth for the foreign-born population - Other Western Europe (%)
Place of birth for the foreign-born population - Greece (%)
Place of birth for the foreign-born population - Italy (%)
Place of birth for the foreign-born population - Portugal (%)
Place of birth for the foreign-born population - Spain (%)
Place of birth for the foreign-born population - Other Southern Europe (%)
Place of birth for the foreign-born population - Albania (%)
Place of birth for the foreign-born population - Belarus (%)
Place of birth for the foreign-born population - Bosnia and Herzegovina (%)
Place of birth for the foreign-born population - Bulgaria (%)
Place of birth for the foreign-born population - Croatia (%)
Place of birth for the foreign-born population - Czechoslovakia (%)
Place of birth for the foreign-born population - Hungary (%)
Place of birth for the foreign-born population - Latvia (%)
Place of birth for the foreign-born population - Lithuania (%)
Place of birth for the foreign-born population - North Macedonia (Macedonia) (%)
Place of birth for the foreign-born population - Moldova (%)
Place of birth for the foreign-born population - Poland (%)
Place of birth for the foreign-born population - Romania (%)
Place of birth for the foreign-born population - Russia (%)
Place of birth for the foreign-born population - Serbia (%)
Place of birth for the foreign-born population - Ukraine (%)
Place of birth for the foreign-born population - Other Eastern Europe (%)
Place of birth for the foreign-born population - China (%)
Place of birth for the foreign-born population - Hong Kong (%)
Place of birth for the foreign-born population - Taiwan (%)
Place of birth for the foreign-born population - Japan (%)
Place of birth for the foreign-born population - Korea (%)
Place of birth for the foreign-born population - Other Eastern Asia (%)
Place of birth for the foreign-born population - Afghanistan (%)
Place of birth for the foreign-born population - Bangladesh (%)
Place of birth for the foreign-born population - India (%)
Place of birth for the foreign-born population - Iran (%)
Place of birth for the foreign-born population - Kazakhstan (%)
Place of birth for the foreign-born population - Nepal (%)
Place of birth for the foreign-born population - Pakistan (%)
Place of birth for the foreign-born population - Sri Lanka (%)
Place of birth for the foreign-born population - Uzbekistan (%)
Place of birth for the foreign-born population - Other South Central Asia (%)
Place of birth for the foreign-born population - Burma (%)
Place of birth for the foreign-born population - Cambodia (%)
Place of birth for the foreign-born population - Indonesia (%)
Place of birth for the foreign-born population - Laos (%)
Place of birth for the foreign-born population - Malaysia (%)
Place of birth for the foreign-born population - Philippines (%)
Place of birth for the foreign-born population - Singapore (%)
Place of birth for the foreign-born population - Thailand (%)
Place of birth for the foreign-born population - Vietnam (%)
Place of birth for the foreign-born population - Other South Eastern Asia (%)
Place of birth for the foreign-born population - Armenia (%)
Place of birth for the foreign-born population - Iraq (%)
Place of birth for the foreign-born population - Israel (%)
Place of birth for the foreign-born population - Jordan (%)
Place of birth for the foreign-born population - Kuwait (%)
Place of birth for the foreign-born population - Lebanon (%)
Place of birth for the foreign-born population - Saudi Arabia (%)
Place of birth for the foreign-born population - Syria (%)
Place of birth for the foreign-born population - Turkey (%)
Place of birth for the foreign-born population - Yemen (%)
Place of birth for the foreign-born population - Other Western Asia (%)
Place of birth for the foreign-born population - Eritrea (%)
Place of birth for the foreign-born population - Ethiopia (%)
Place of birth for the foreign-born population - Kenya (%)
Place of birth for the foreign-born population - Somalia (%)
Place of birth for the foreign-born population - Uganda (%)
Place of birth for the foreign-born population - Zimbabwe (%)
Place of birth for the foreign-born population - Other Eastern Africa (%)
Place of birth for the foreign-born population - Cameroon (%)
Place of birth for the foreign-born population - Congo (%)
Place of birth for the foreign-born population - Democratic Republic of Congo (Zaire) (%)
Place of birth for the foreign-born population - Other Middle Africa (%)
Place of birth for the foreign-born population - Egypt (%)
Place of birth for the foreign-born population - Morocco (%)
Place of birth for the foreign-born population - Sudan (%)
Place of birth for the foreign-born population - Other Northern Africa (%)
Place of birth for the foreign-born population - South Africa (%)
Place of birth for the foreign-born population - Other Southern Africa (%)
Place of birth for the foreign-born population - Cabo Verde (%)
Place of birth for the foreign-born population - Ghana (%)
Place of birth for the foreign-born population - Liberia (%)
Place of birth for the foreign-born population - Nigeria (%)
Place of birth for the foreign-born population - Senegal (%)
Place of birth for the foreign-born population - Sierra Leone (%)
Place of birth for the foreign-born population - Other Western Africa (%)
Place of birth for the foreign-born population - Australia (%)
Place of birth for the foreign-born population - New Zealand (%)
Place of birth for the foreign-born population - Fiji (%)
Place of birth for the foreign-born population - Micronesia (%)
Place of birth for the foreign-born population - Bahamas (%)
Place of birth for the foreign-born population - Barbados (%)
Place of birth for the foreign-born population - Cuba (%)
Place of birth for the foreign-born population - Dominica (%)
Place of birth for the foreign-born population - Dominican Republic (%)
Place of birth for the foreign-born population - Grenada (%)
Place of birth for the foreign-born population - Haiti (%)
Place of birth for the foreign-born population - Jamaica (%)
Place of birth for the foreign-born population - St. Vincent and the Grenadines (%)
Place of birth for the foreign-born population - Trinidad and Tobago (%)
Place of birth for the foreign-born population - West Indies (%)
Place of birth for the foreign-born population - Other Caribbean (%)
Place of birth for the foreign-born population - Belize (%)
Place of birth for the foreign-born population - Costa Rica (%)
Place of birth for the foreign-born population - El Salvador (%)
Place of birth for the foreign-born population - Guatemala (%)
Place of birth for the foreign-born population - Honduras (%)
Place of birth for the foreign-born population - Mexico (%)
Place of birth for the foreign-born population - Nicaragua (%)
Place of birth for the foreign-born population - Panama (%)
Place of birth for the foreign-born population - Other Central America (%)
Place of birth for the foreign-born population - Argentina (%)
Place of birth for the foreign-born population - Bolivia (%)
Place of birth for the foreign-born population - Brazil (%)
Place of birth for the foreign-born population - Chile (%)
Place of birth for the foreign-born population - Colombia (%)
Place of birth for the foreign-born population - Ecuador (%)
Place of birth for the foreign-born population - Guyana (%)
Place of birth for the foreign-born population - Peru (%)
Place of birth for the foreign-born population - Uruguay (%)
Place of birth for the foreign-born population - Venezuela (%)
Place of birth for the foreign-born population - Other South America (%)
Place of birth for the foreign-born population - Canada (%)
Place of birth for the foreign-born population - Other Northern America (%)
Place of birth for the foreign-born population - Other (%)
Latest news about races in Plymouth, MN collected exclusively by city-data.com from local newspapers, TV, and radio stations
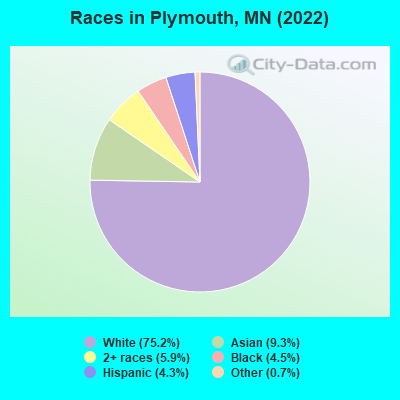
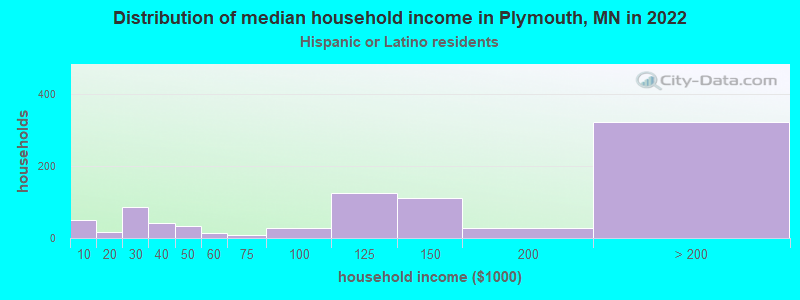
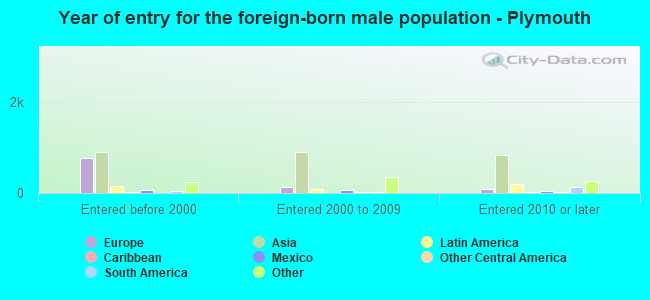
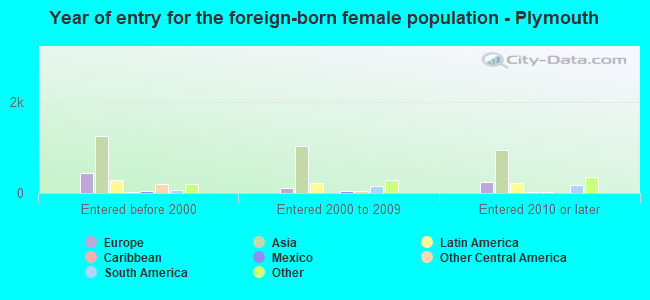
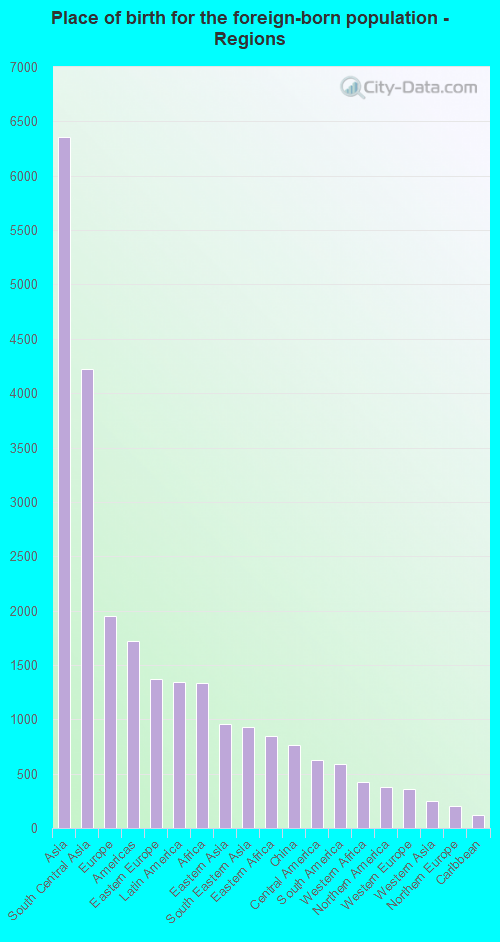
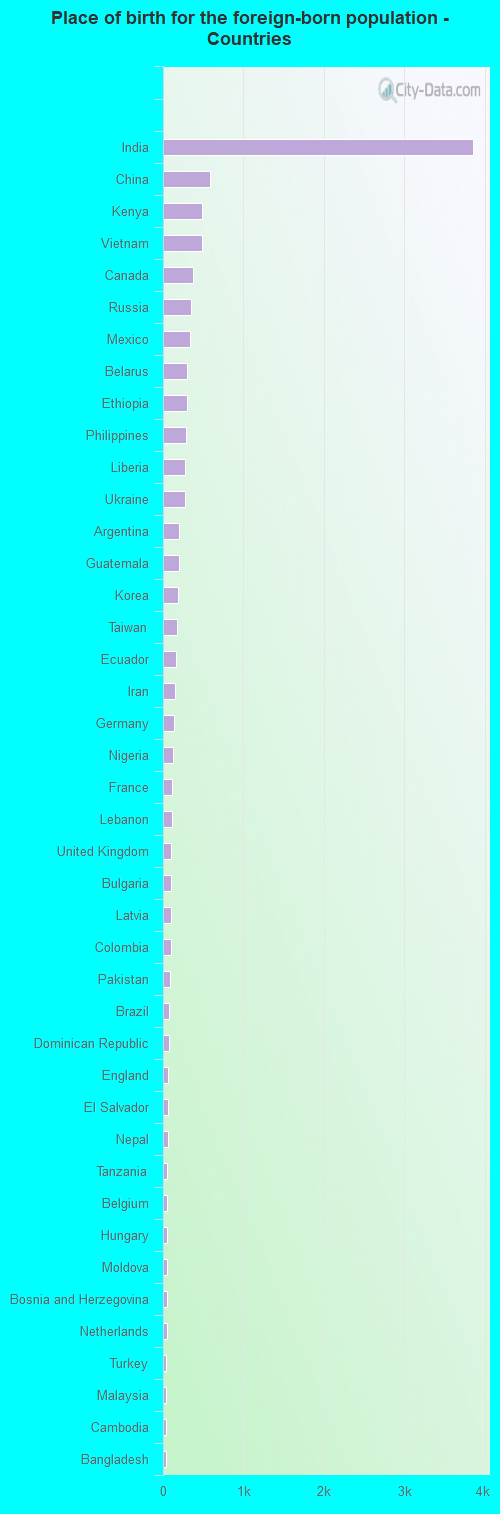
According to 2022 data, the most numerous races in Plymouth, MN are White alone (59,183 residents), Black alone (3,545 residents), and Hispanic (3,384 residents). 84.0% of Plymouth residents speak English at home. 14.4% of Plymouth, MN residents are foreign-born (7.7% born in Asia, 2.4% born in Europe, 1.6% born in Latin America, 1.6% born in Africa), which is 44.3% greater than the foreign-born rate of 8.0% across the entire state of Minnesota.
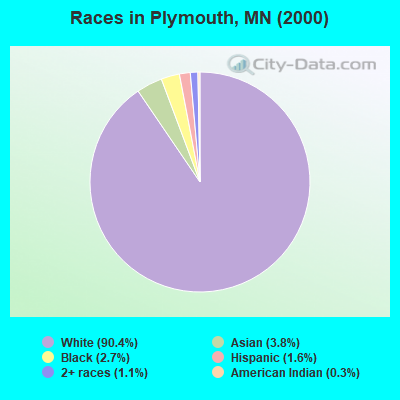
Race distribution in Plymouth
2000 2022
4,337,143 88.2% White alone 168,813 3.4% Black alone 143,382 2.9% Hispanic 141,083 2.9% Asian alone 70,304 1.4% Two or more races 52,009 1.1% American Indian alone 5,031 0.1% Other race alone 1,714 0.03% Native Hawaiian and Other
4,356,347 76.2% White alone 395,179 6.9% Black alone 333,830 5.8% Hispanic 294,800 5.2% Asian alone 259,649 4.5% Two or more races 42,125 0.7% American Indian alone 32,976 0.6% Other race alone 2,278 0.04% Native Hawaiian and Other
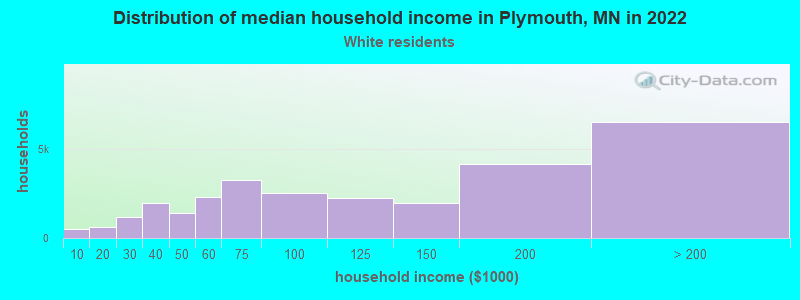
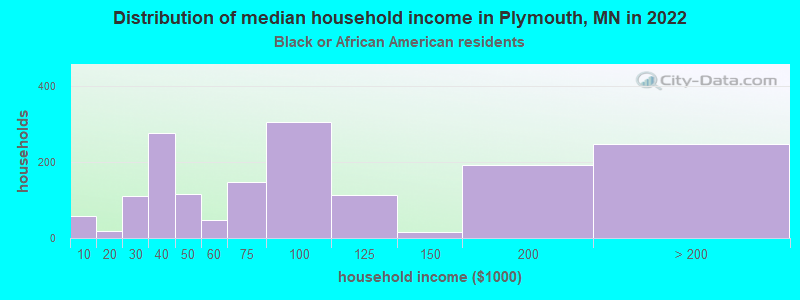
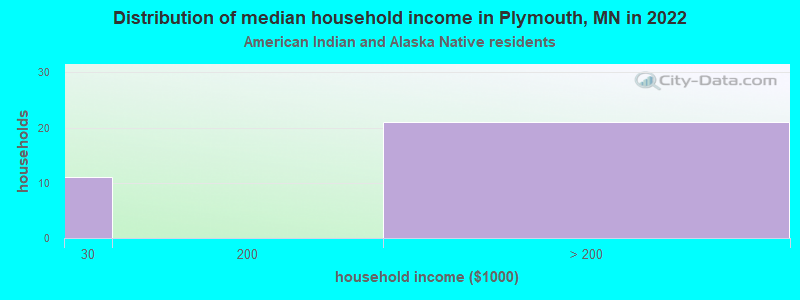
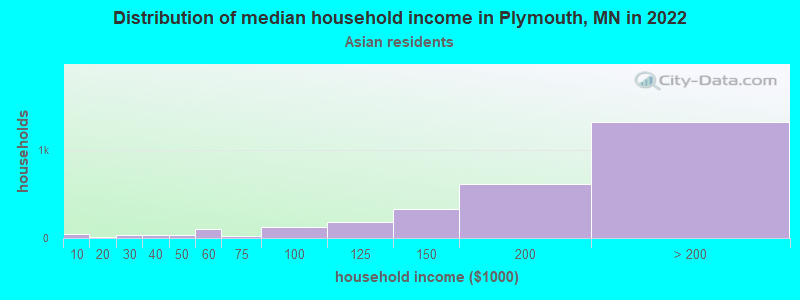
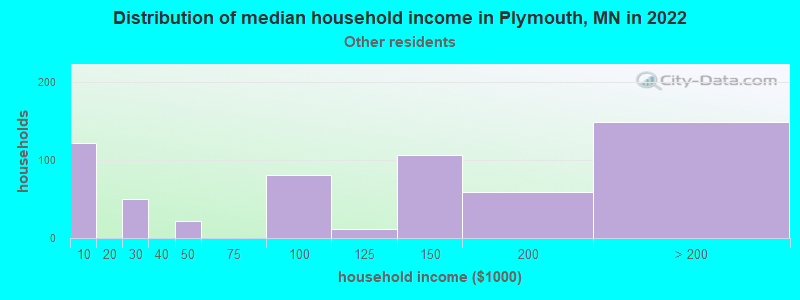
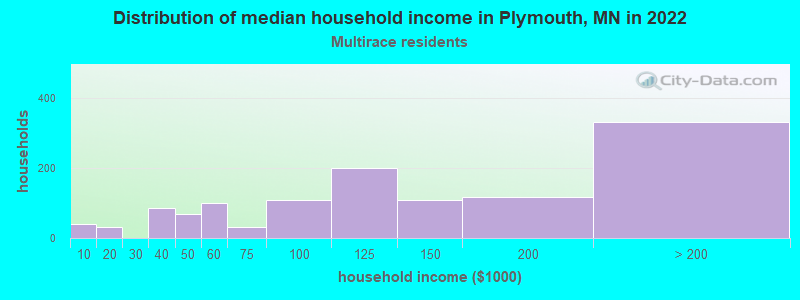
Income and house value in Plymouth Median household income in 2022 $103,774 White non-Hispanic householders$60,225 Black householders$171,564 Asian householders$128,872 Some other race householders$126,898 Two or more races householders$129,835 Hispanic or Latino race householdersMedian 2022 house value $473,882 White Non-Hispanic householders$420,963 Black or African American householders$366,606 American Indian or Alaska Native householders $502,138 Asian householders$477,474 Some other race householders$410,187 Two or more races householders$421,442 Hispanic or Latino householders
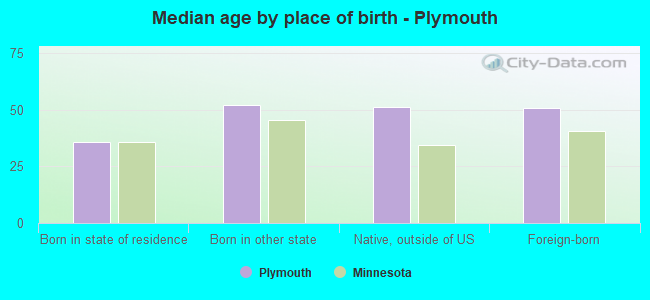
Median age by race in Plymouth
46.6 Median age for White residents43.8 48.9 23.1 Median age for Black or African American residents47.6 14.8 -666,666,666.0 Median age for American Indian / Alaska Native residents-666,666,666.0 -666,666,666.0 41.0 Median age for Asian residents40.4 44.1 -666,666,666.0 Median age for Native Hawaiian / Pacific Islander residents-666,666,666.0 -666,666,666.0 48.4 Median age for Other race residents37.7 60.6 25.5 Median age for Two or more races residents25.7 25.5 46.5 Median age for White alone residents43.9 48.8 47.2 Median age for Hispanic or Latino residents40.6 59.8
Owner/renter occupied households by race in Plymouth
House owners and renters - White residents 22,174 77.0% Owner occupied6,621 23.0% Renter occupiedHouse owners and renters - Black or African American residents 625 55.6% Owner occupied500 44.4% Renter occupiedHouse owners and renters - American Indian / Alaska Native residents 25 67.8% Owner occupied12 32.2% Renter occupiedHouse owners and renters - Asian residents 2,056 77.3% Owner occupied603 22.7% Renter occupiedHouse owners and renters - Other race residents 478 79.5% Owner occupied123 20.5% Renter occupiedHouse owners and renters - Two or more races residents 878 50.8% Owner occupied850 49.2% Renter occupiedHouse owners and renters - White alone residents 22,121 77.3% Owner occupied6,496 22.7% Renter occupiedHouse owners and renters - Hispanic or Latino residents 773 77.7% Owner occupied222 22.3% Renter occupied
Language usage in Plymouth
English speakers - Total 84.0% of residents of Plymouth speak English at home.
2.7% of residents speak Spanish at home 1,660 82.7% Speak English very well347 17.3% Speak English less than very well13.3% of residents speak other language at home 7,749 78.8% Speak English very well2,091 21.2% Speak English less than very well
English speakers - Born in the United States 94.1% of residents of Plymouth speak English at home.
1.7% of residents speak Spanish at home 296 84.1% Speak English very well56 15.9% Speak English less than very well3.8% of residents speak other language at home 770 97.5% Speak English very well20 2.5% Speak English less than very well
English speakers - Native, born elsewhere 74.4% of residents of Plymouth speak English at home.
18.3% of residents speak Spanish at home 103 100.0% Speak English very well5.0% of residents speak other language at home 28 100.0% Speak English very well
English speakers - Foreign-born 19.8% of residents of Plymouth speak English at home.
8.0% of residents speak Spanish at home 756 88.1% Speak English very well102 11.9% Speak English less than very well72.6% of residents speak other language at home 5,866 75.7% Speak English very well1,885 24.3% Speak English less than very well
White (Caucasian) - Speak only English Native:
98.0% (53,475)Foreign-born:
42.2% (1,114)
White (Caucasian) - Speak another language Native:
2.0% (1,105)Foreign-born:
57.8% (1,528)
Black or African American - Speak only English Native:
93.4% (2,360)Foreign-born:
21.6% (267)
Black or African American - Speak another language Native:
1.5% (37)Foreign-born:
77.1% (957)
American Indian / Alaska Native - Speak another language Native:
57.5% (66)Foreign-born:
76.9% (11)
Asian - Speak only English Native:
67.7% (1,211)Foreign-born:
21.0% (1,120)
Asian - Speak another language Native:
32.3% (578)Foreign-born:
79.0% (4,203)
Other race - Speak only English Native:
54.6% (652)Foreign-born:
20.0% (123)
Other race - Speak another language Native:
46.2% (553)Foreign-born:
79.6% (489)
Two or more races - Speak only English Native:
94.7% (4,533)Foreign-born:
31.5% (198)
Two or more races - Speak another language Native:
6.4% (307)Foreign-born:
69.8% (439)
White alone - Speak only English Native:
98.5% (53,188)Foreign-born:
47.1% (1,114)
White alone - Speak another language Native:
1.5% (809)Foreign-born:
52.9% (1,253)
Hispanic or Latino - Speak only English Native:
65.4% (1,523)Foreign-born:
24.0% (281)
Hispanic or Latino - Speak another language Native:
36.4% (848)Foreign-born:
79.2% (925)
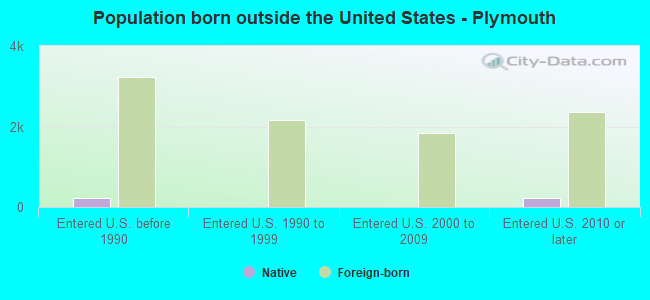
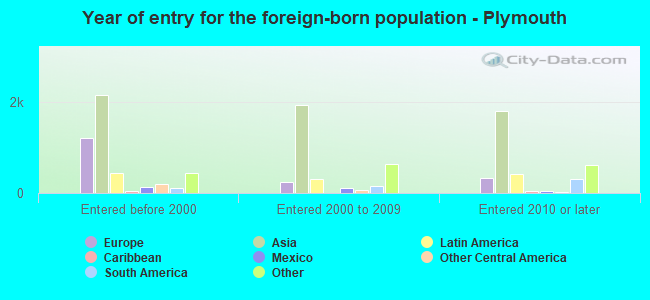
Foreign-born residents in Plymouth 11,382 residents are foreign born (7.7% Asia , 2.4% Europe , 1.6% Latin America , 1.6% Africa ).
This city:
14.4%Minnesota:
8.5%
Marital status for residents in Plymouth Marital status - White (Caucasian) population 15 years and over
Males 30.4% Never married61.7% Now married0.2% Separated2.1% Widowed5.6% DivorcedFemales 22.9% Never married50.1% Now married1.3% Separated8.3% Widowed17.5% DivorcedWomen who gave birth in the past 12 months Now married:
100.0% (576)Unmarried:
0.0% (0)
Women who did not give birth in the past 12 months Now married:
47.6% (5,385)Unmarried:
52.4% (5,922)
Marital status - Black or African American population 15 years and over
Males 53.7% Never married37.6% Now married0.4% Separated1.4% Widowed6.8% DivorcedFemales 56.8% Never married33.2% Now married2.2% Separated1.5% Widowed6.2% DivorcedWomen who gave birth in the past 12 months Now married:
38.5% (69)Unmarried:
61.5% (110)
Women who did not give birth in the past 12 months Now married:
27.7% (298)Unmarried:
72.3% (777)
Marital status - American Indian / Alaska Native population 15 years and over
Males 62.8% Never married37.2% Now married0.0% Separated0.0% Widowed0.0% DivorcedFemales 0.0% Never married100.0% Now married0.0% Separated0.0% Widowed0.0% DivorcedWomen who did not give birth in the past 12 months Now married:
100.0% (11)Unmarried:
0.0% (0)
Marital status - Asian population 15 years and over
Males 14.0% Never married84.4% Now married0.8% Separated0.0% Widowed0.7% DivorcedFemales 12.9% Never married77.8% Now married0.8% Separated1.3% Widowed7.2% DivorcedWomen who gave birth in the past 12 months Now married:
100.0% (70)Unmarried:
0.0% (0)
Women who did not give birth in the past 12 months Now married:
83.1% (1,833)Unmarried:
16.9% (374)
Marital status - Other race population 15 years and over
Males 9.5% Never married67.8% Now married0.0% Separated21.5% Widowed1.2% DivorcedFemales 38.9% Never married46.3% Now married0.0% Separated0.8% Widowed14.0% DivorcedWomen who gave birth in the past 12 months Now married:
100.0% (31)Unmarried:
0.0% (0)
Women who did not give birth in the past 12 months Now married:
36.0% (157)Unmarried:
64.0% (278)
Marital status - Two or more races population 15 years and over
Males 44.7% Never married51.3% Now married0.0% Separated0.3% Widowed3.7% DivorcedFemales 46.8% Never married44.8% Now married0.4% Separated0.0% Widowed8.0% DivorcedWomen who gave birth in the past 12 months Now married:
0.0% (0)Unmarried:
100.0% (44)
Women who did not give birth in the past 12 months Now married:
34.5% (450)Unmarried:
65.5% (854)
Marital status - White alone, not Hispanic / Latino population 15 years and over
Males 29.5% Never married62.5% Now married0.2% Separated2.1% Widowed5.7% DivorcedFemales 23.1% Never married50.2% Now married0.8% Separated8.4% Widowed17.5% DivorcedWomen who gave birth in the past 12 months Now married:
100.0% (576)Unmarried:
0.0% (0)
Women who did not give birth in the past 12 months Now married:
47.6% (5,385)Unmarried:
52.4% (5,922)
Marital status - Hispanic or Latino population 15 years and over
Males 40.4% Never married55.0% Now married0.0% Separated0.0% Widowed4.6% DivorcedFemales 43.2% Never married38.2% Now married1.6% Separated4.7% Widowed12.2% DivorcedWomen who gave birth in the past 12 months Now married:
100.0% (45)Unmarried:
0.0% (0)
Women who did not give birth in the past 12 months Now married:
29.5% (263)Unmarried:
70.5% (628)
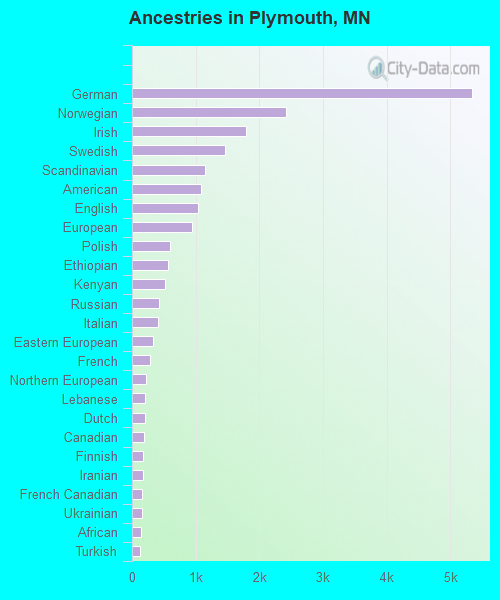
Ancestries in Plymouth
5,342 16.3% German2,425 7.4% Norwegian1,791 5.5% Irish1,466 4.5% Swedish1,148 3.5% Scandinavian1,089 3.3% American1,032 3.2% English943 2.9% European591 1.8% Polish564 1.7% Ethiopian514 1.6% Kenyan432 1.3% Russian412 1.3% Italian336 1.0% Eastern European288 0.9% French226 0.7% Northern European209 0.6% Lebanese200 0.6% Dutch182 0.6% Canadian180 0.5% Finnish170 0.5% Iranian160 0.5% French Canadian155 0.5% Ukrainian139 0.4% African133 0.4% Turkish128 0.4% Liberian124 0.4% Jamaican109 0.3% Scotch-Irish105 0.3% Scottish102 0.3% Israeli101 0.3% Belgian91 0.3% Afghan83 0.3% Greek80 0.2% Nigerian72 0.2% Danish71 0.2% Slovak68 0.2% Luxembourger60 0.2% Bulgarian55 0.2% Hungarian54 0.2% Romanian54 0.2% Croatian41 0.1% Senegalese38 0.1% Brazilian36 0.1% Czech34 0.1% Swiss28 0.09% Egyptian27 0.08% Lithuanian26 0.08% British25 0.08% Latvian24 0.07% Welsh24 0.07% West Indian21 0.06% Ugandan19 0.06% Yugoslavian16 0.05% Haitian13 0.04% Armenian12 0.04% Czechoslovakian11 0.03% Slavic8 0.02% Austrian2 0.01% Pennsylvania German
Geographical mobility in Plymouth Same house 1 year ago 53,136 89.2% White (Caucasian)3,021 75.7% Black or African American101 77.4% American Indian / Alaska Native7,051 87.4% Asian52 100.0% Native Hawaiian / Pacific Islander1,392 77.6% Other race5,219 80.3% Two or more races52,565 89.5% White alone, not Hispanic / Latino2,908 82.1% Hispanic or LatinoMoved within same county 4,136 6.9% White / Caucasian342 8.6% Black or African American14 10.8% American Indian / Alaska Native521 6.5% Asian341 19.0% Other race689 10.6% Two or more races3,849 6.6% White alone, not Hispanic / Latino453 12.8% Hispanic or LatinoMoved within same state 1,346 2.3% White / Caucasian277 6.9% Black or African American7 5.2% American Indian / Alaska Native64 0.8% Asian494 7.6% Two or more races1,346 2.3% White alone, not Hispanic / Latino7 0.2% Hispanic or LatinoMoved from different state 965 1.6% White / Caucasian294 7.4% Black or African American668 8.3% Asian39 0.6% Two or more races965 1.6% White alone, not Hispanic / Latino124 3.5% Hispanic or LatinoMoved from abroad 122 3.0% Black or African American18 14.1% American Indian / Alaska Native22 0.3% Asian11 0.2% Two or more races44 1.2% Hispanic or Latino
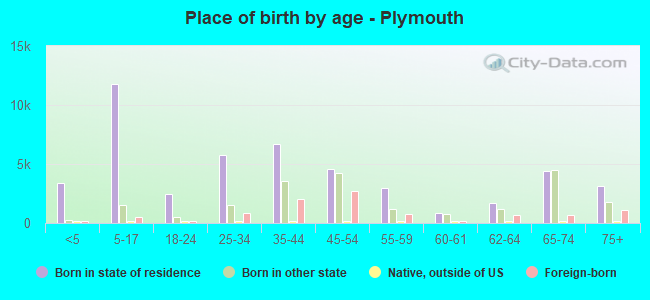
Children Nativity (place of birth) in Plymouth
Children under 6 years - Living with two parents Both parents native 4,161 100.0% NativeBoth parents foreign-born 688 98.2% Native12 1.8% Foreign-bornOne native, one foreign-born parent 340 100.0% NativeChildren under 6 years - Living with one parent Native parent 536 100.0% NativeForeign-born parent 30 100.0% NativeChildren 6 to 17 years - Living with two parents Both parents native 6,445 98.8% Native76 1.2% Foreign-bornBoth parents foreign-born 1,788 71.7% Native705 28.3% Foreign-bornOne native, one foreign-born parent 970 94.9% Native53 5.1% Foreign-bornChildren 6 to 17 years - Living with one parent Native parent 1,939 100.0% NativeForeign-born parent 311 57.3% Native232 42.7% Foreign-born
Grandparents responsible for own grandchildren in Plymouth
Grandparents (30 to 59 years) White / Caucasian 59 91.3% Responsible for grandchildren6 8.7% Not responsible for grandchildrenTwo or more races 16 100.0% Responsible for grandchildrenWhite alone, not Hispanic / Latino 40 86.4% Responsible for grandchildren6 13.6% Not responsible for grandchildrenGrandparents (60 years and over) White / Caucasian 113 30.1% Responsible for grandchildren263 69.9% Not responsible for grandchildrenWhite alone, not Hispanic / Latino 116 32.0% Responsible for grandchildren246 68.0% Not responsible for grandchildren