Races in Pomfret, New York (NY) Detailed Stats
Ancestries, Foreign-born residents, place of birth
2.4% of Pomfret, NY residents are foreign-born (0.8% born in Europe, 0.8% born in Asia, 0.6% born in North America), which is 824.2% less than the foreign-born rate of 22.0% across the entire state of New York.
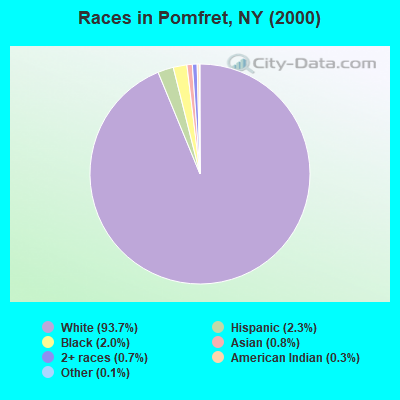
Race distribution in Pomfret

- 13,77693.7%White alone
- 3422.3%Hispanic
- 2992.0%Black alone
- 1240.8%Asian alone
- 980.7%Two or more races
- 450.3%American Indian alone
- 170.1%Other race alone
- 20.01%Native Hawaiian and Other
Pacific Islander alone
2000
2022
-
- 11,760,98162.0%White alone
- 2,867,58315.1%Hispanic
- 2,812,62314.8%Black alone
- 1,035,9265.5%Asian alone
- 366,1161.9%Two or more races
- 75,4990.4%Other race alone
- 52,4990.3%American Indian alone
- 5,2300.03%Native Hawaiian and Other
Pacific Islander alone

-
- 10,408,93352.9%White alone
- 3,867,29919.7%Hispanic
- 2,633,84013.4%Black alone
- 1,776,2869.0%Asian alone
- 732,6703.7%Two or more races
- 216,1101.1%Other race alone
- 35,0820.2%American Indian alone
- 6,9310.04%Native Hawaiian and Other
Pacific Islander alone

Income and house value in Pomfret
- Median household income in 2022
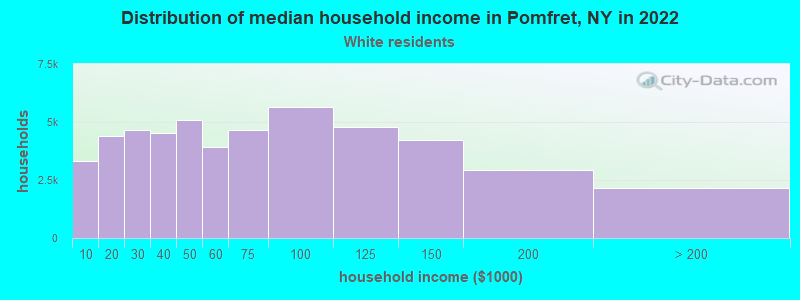
- $58,388White non-Hispanic householders
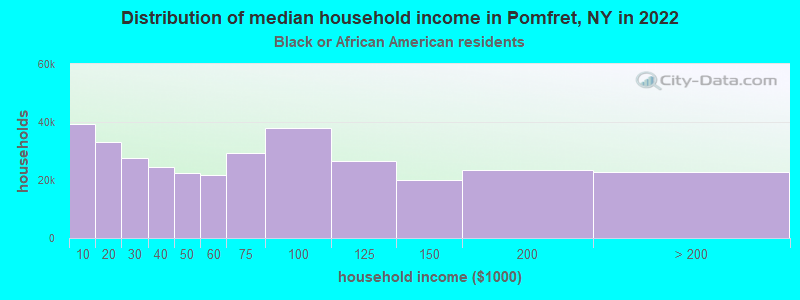
- $42,473Black householders
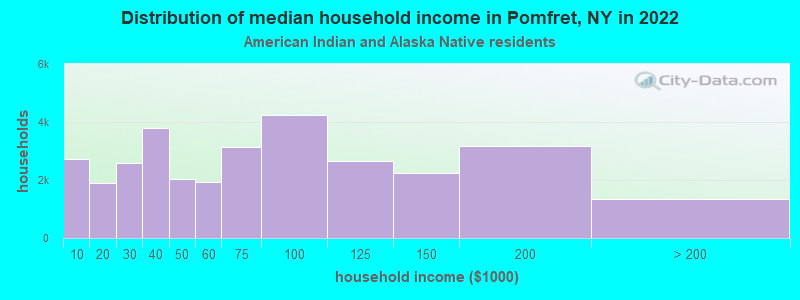
- $93,909American Indian and Alaska Native householders
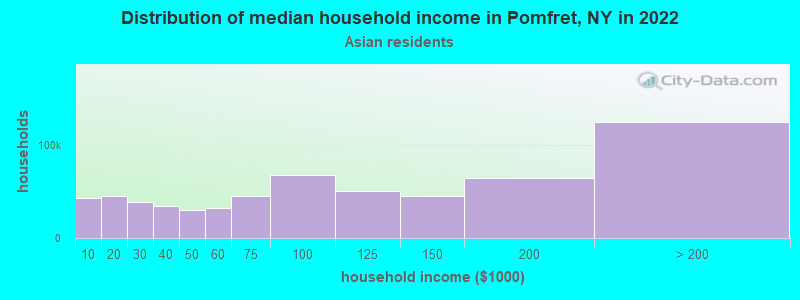
- $172,194Asian householders
- $89,289Some other race householders
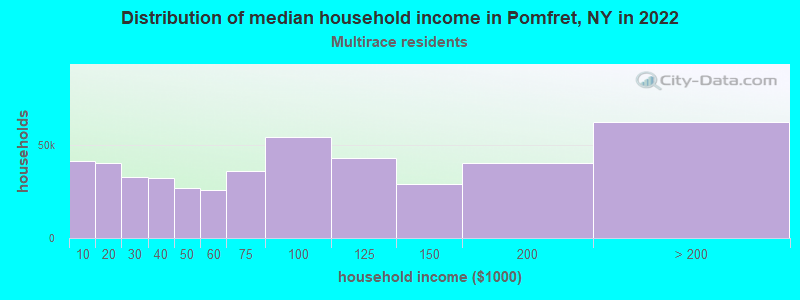
- $64,804Two or more races householders
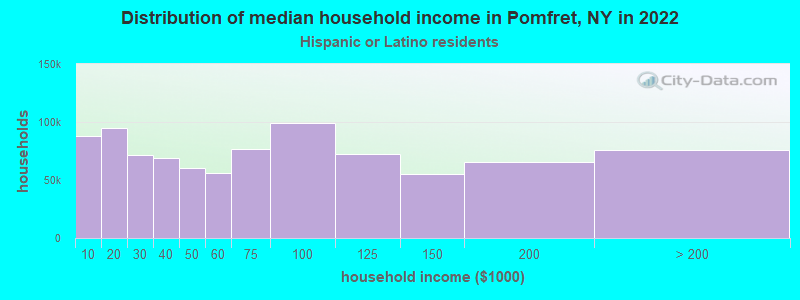
- $62,146Hispanic or Latino race householders
- Median 2022 house value
- $164,114White Non-Hispanic householders
- $87,918Black or African American householders
- $185,606American Indian or Alaska Native householders
- $356,559Asian householders
- $146,531Some other race householders
- $187,169Two or more races householders
- $134,417Hispanic or Latino householders
Household income for White non-Hispanic householders
Household income for Black householders
Household income for American Indian and Alaska Native householders
Household income for Asian householders
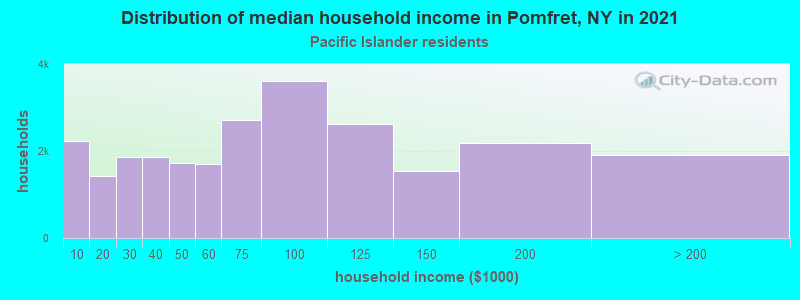
Household income for Native Hawaiian and other Pacific Islander householders
Household income for Two or more races householders
Household income for Hispanic or Latino race householders
Foreign-born residents in Pomfret
350 residents are foreign born (0.8% Europe, 0.8% Asia, 0.6% North America).
| This city: | 2.4% |
| New York: | 20.4% |
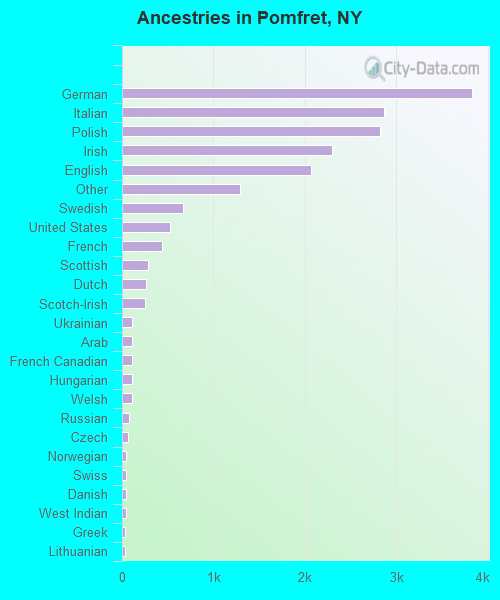
Ancestries in Pomfret

- 3,82320.6%German
- 2,86115.4%Italian
- 2,81915.2%Polish
- 2,29612.4%Irish
- 2,07011.1%English
- 1,2886.9%Other
- 6653.6%Swedish
- 5212.8%United States
- 4362.3%French
- 2891.6%Scottish
- 2611.4%Dutch
- 2501.3%Scotch-Irish
- 1140.6%Ukrainian
- 1130.6%Arab
- 1090.6%French Canadian
- 1050.6%Hungarian
- 1050.6%Welsh
- 740.4%Russian
- 670.4%Czech
- 490.3%Norwegian
- 450.2%Swiss
- 400.2%Danish
- 400.2%West Indian
- 380.2%Greek
- 370.2%Lithuanian
- 320.2%Portuguese
- 240.1%Slovak
- 180.10%Subsaharan African
Zip codes: 14063.