Races in Pontiac, South Carolina (SC) Detailed Stats
Ancestries, Foreign-born residents, place of birth
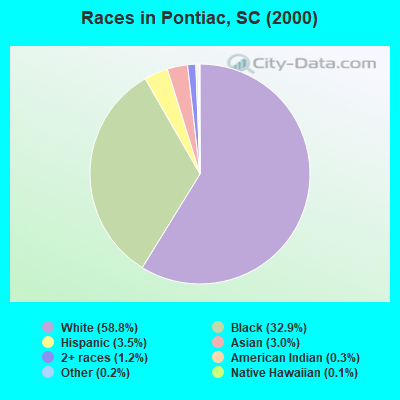
Race distribution in Pontiac

- 25,87758.8%White alone
- 14,45332.9%Black alone
- 1,5233.5%Hispanic
- 1,3333.0%Asian alone
- 5331.2%Two or more races
- 1160.3%American Indian alone
- 830.2%Other race alone
- 540.1%Native Hawaiian and Other
Pacific Islander alone
2000
2022
-
- 2,652,29166.1%White alone
- 1,178,48629.4%Black alone
- 95,0762.4%Hispanic
- 35,5680.9%Asian alone
- 33,2900.8%Two or more races
- 12,7650.3%American Indian alone
- 3,2660.08%Other race alone
- 1,2700.03%Native Hawaiian and Other
Pacific Islander alone

-
- 3,301,73962.5%White alone
- 1,313,29024.9%Black alone
- 343,7836.5%Hispanic
- 190,5083.6%Two or more races
- 89,8881.7%Asian alone
- 29,3900.6%Other race alone
- 12,1120.2%American Indian alone
- 1,9240.04%Native Hawaiian and Other
Pacific Islander alone

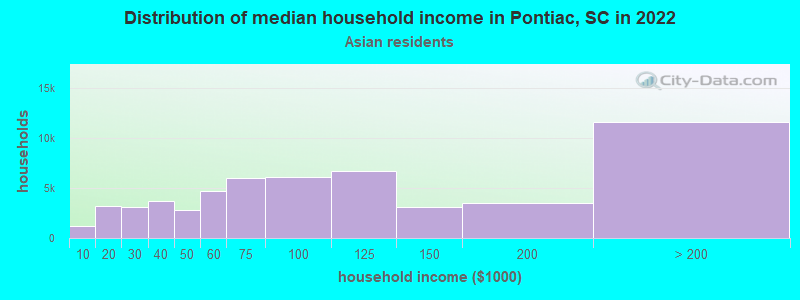
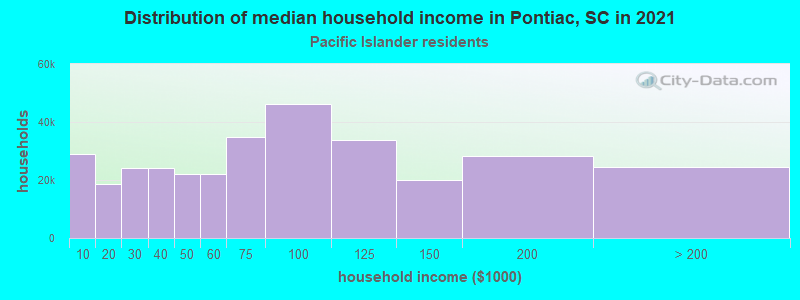
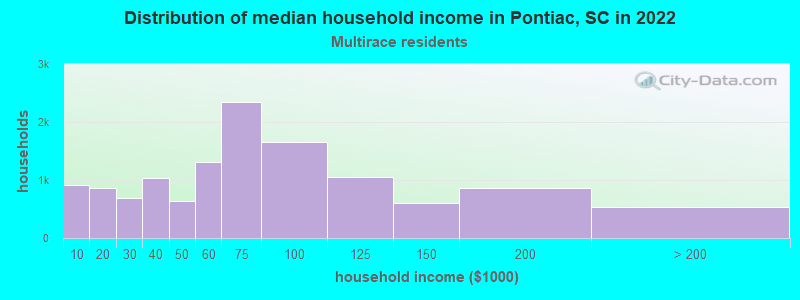
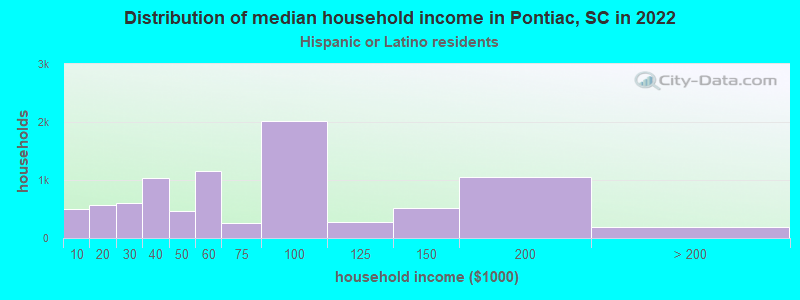
Income and house value in Pontiac
- Median household income in 2022
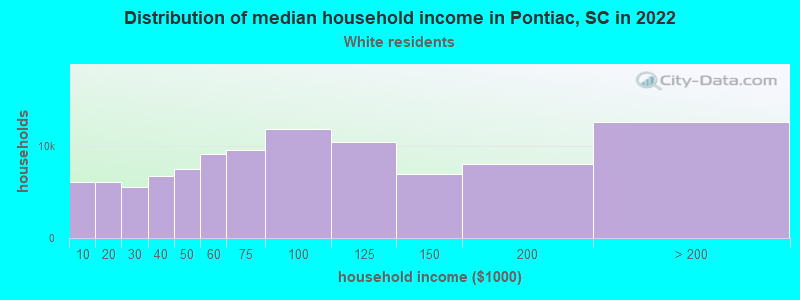
- $104,187White non-Hispanic householders
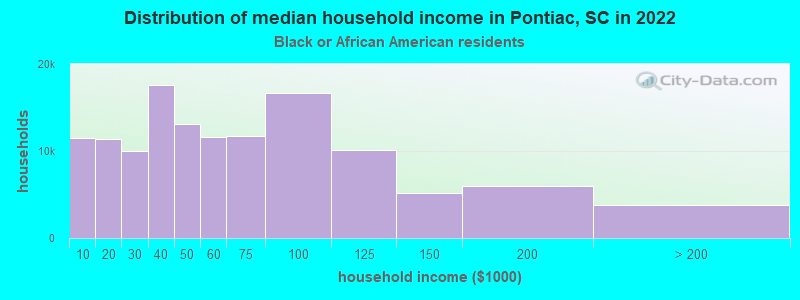
- $80,791Black householders
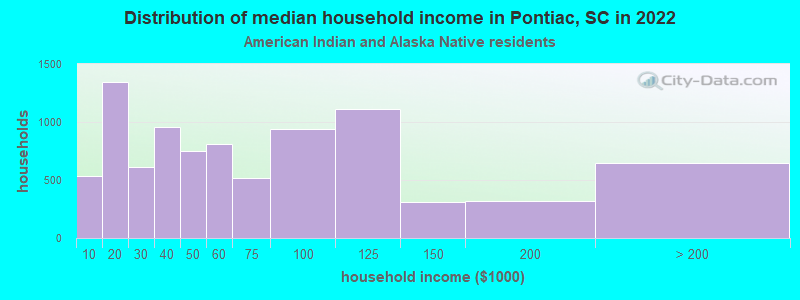
- $42,906American Indian and Alaska Native householders
- $188,590Asian householders
- $60,426Some other race householders
- $106,223Two or more races householders
- $69,403Hispanic or Latino race householders
- Median 2022 house value
- $337,931White Non-Hispanic householders
- $250,708Black or African American householders
- $206,381American Indian or Alaska Native householders
- $388,216Asian householders
- $202,568Native Hawaiian and other Pacific Islander householders
- $159,671Some other race householders
- $309,095Two or more races householders
- $213,769Hispanic or Latino householders
Household income for White non-Hispanic householders
Household income for Black householders
Household income for American Indian and Alaska Native householders
Household income for Asian householders
Household income for Native Hawaiian and other Pacific Islander householders
Household income for Two or more races householders
Household income for Hispanic or Latino race householders
Zip code: 29223