Races in Port Chester, New York (NY) Detailed Stats
Data:
Races - White alone (%)
Races - White alone (% change since 2000)
Races - Black alone (%)
Races - Black alone (% change since 2000)
Races - American Indian alone (%)
Races - American Indian alone (% change since 2000)
Races - Asian alone (%)
Races - Asian alone (% change since 2000)
Races - Hispanic (%)
Races - Hispanic (% change since 2000)
Races - Native Hawaiian and Other Pacific Islander alone (%)
Races - Native Hawaiian and Other Pacific Islander alone (% change since 2000)
Races - Two or more races(%)
Races - Two or more races(% change since 2000)
Races - Other race alone (%)
Races - Other race alone (% change since 2000)
Racial diversity
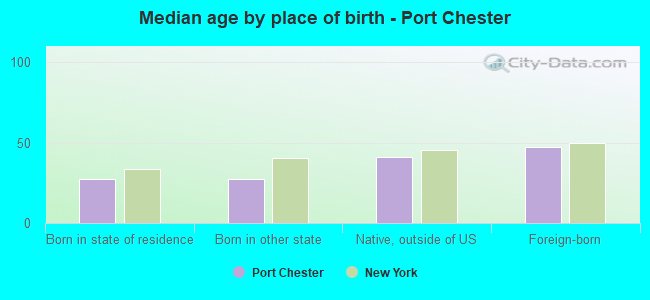
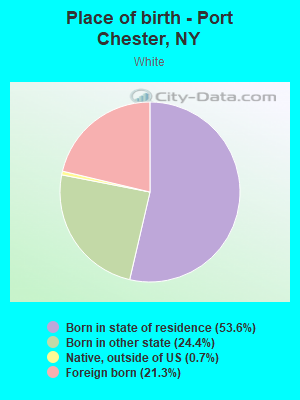
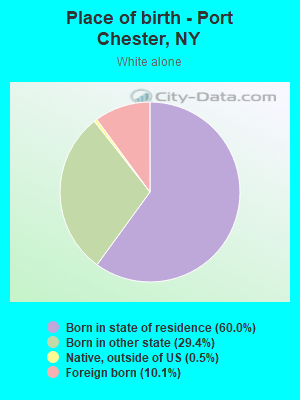
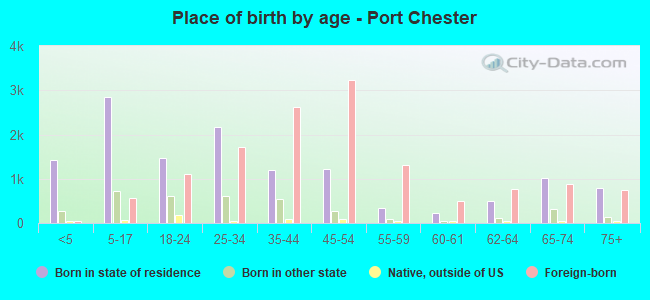
Place of birth - Born in state of residence (%)
Place of birth - Born in state of residence (%) - White
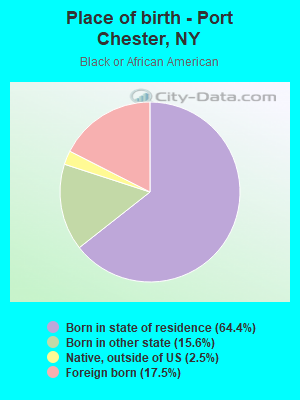
Place of birth - Born in state of residence (%) - Black or African American
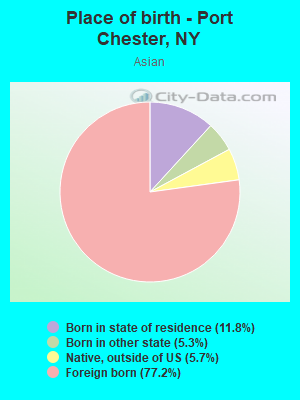
Place of birth - Born in state of residence (%) - Asian
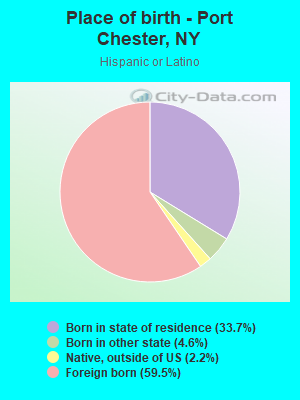
Place of birth - Born in state of residence (%) - Hispanic or Latino
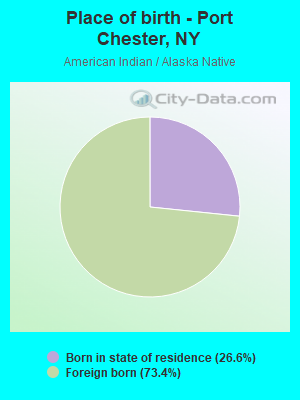
Place of birth - Born in state of residence (%) - American Indian and Alaska Native
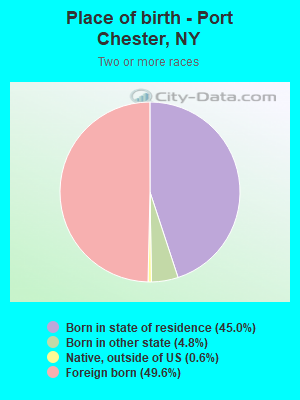
Place of birth - Born in state of residence (%) - Multirace
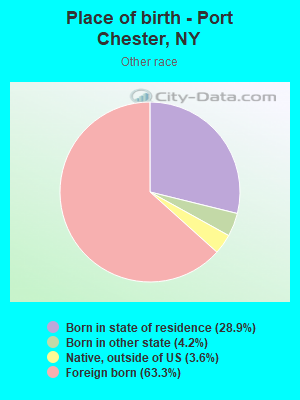
Place of birth - Born in state of residence (%) - Other Race
Place of birth - Born in other state (%)
Place of birth - Born in other state (%) - White
Place of birth - Born in other state (%) - Black or African American
Place of birth - Born in other state (%) - Asian
Place of birth - Born in other state (%) - Hispanic or Latino
Place of birth - Born in other state (%) - American Indian and Alaska Native
Place of birth - Born in other state (%) - Multirace
Place of birth - Born in other state (%) - Other Race
Place of birth - Native, outside of US (%)
Place of birth - Native, outside of US (%) - White
Place of birth - Native, outside of US (%) - Black or African American
Place of birth - Native, outside of US (%) - Asian
Place of birth - Native, outside of US (%) - Hispanic or Latino
Place of birth - Native, outside of US (%) - American Indian and Alaska Native
Place of birth - Native, outside of US (%) - Multirace
Place of birth - Native, outside of US (%) - Other Race
Place of birth - Foreign born (%)
Place of birth - Foreign born (%) - White
Place of birth - Foreign born (%) - Black or African American
Place of birth - Foreign born (%) - Asian
Place of birth - Foreign born (%) - Hispanic or Latino
Place of birth - Foreign born (%) - American Indian and Alaska Native
Place of birth - Foreign born (%) - Multirace
Place of birth - Foreign born (%) - Other Race
Residents speaking English at home (%)
Residents speaking English at home - Born in the United States (%)
Residents speaking English at home - Native, born elsewhere (%)
Residents speaking English at home - Foreign born (%)
Residents speaking Spanish at home (%)
Residents speaking Spanish at home - Born in the United States (%)
Residents speaking Spanish at home - Native, born elsewhere (%)
Residents speaking Spanish at home - Foreign born (%)
Residents speaking other language at home (%)
Residents speaking other language at home - Born in the United States (%)
Residents speaking other language at home - Native, born elsewhere (%)
Residents speaking other language at home - Foreign born (%)
Marital status - Never married (%)
Marital status - Now married (%)
Marital status - Separated (%)
Marital status - Widowed (%)
Marital status - Divorced (%)
Ancestries Reported - Arab (%)
Ancestries Reported - Czech (%)
Ancestries Reported - Danish (%)
Ancestries Reported - Dutch (%)
Ancestries Reported - English (%)
Ancestries Reported - French (%)
Ancestries Reported - French Canadian (%)
Ancestries Reported - German (%)
Ancestries Reported - Greek (%)
Ancestries Reported - Hungarian (%)
Ancestries Reported - Irish (%)
Ancestries Reported - Italian (%)
Ancestries Reported - Lithuanian (%)
Ancestries Reported - Norwegian (%)
Ancestries Reported - Polish (%)
Ancestries Reported - Portuguese (%)
Ancestries Reported - Russian (%)
Ancestries Reported - Scotch-Irish (%)
Ancestries Reported - Scottish (%)
Ancestries Reported - Slovak (%)
Ancestries Reported - Subsaharan African (%)
Ancestries Reported - Swedish (%)
Ancestries Reported - Swiss (%)
Ancestries Reported - Ukrainian (%)
Ancestries Reported - United States (%)
Ancestries Reported - Welsh (%)
Ancestries Reported - West Indian (%)
Ancestries Reported - Other (%)
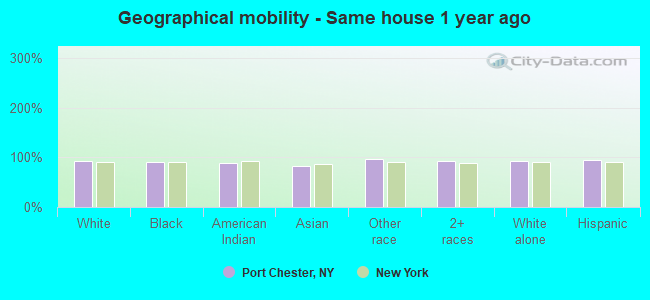
Geographical mobility - Same house 1 year ago (%)
Geographical mobility - Same house 1 year ago (%) - White
Geographical mobility - Same house 1 year ago (%) - Black or African American
Geographical mobility - Same house 1 year ago (%) - Asian
Geographical mobility - Same house 1 year ago (%) - Hispanic or Latino
Geographical mobility - Same house 1 year ago (%) - American Indian and Alaska Native
Geographical mobility - Same house 1 year ago (%) - Multirace
Geographical mobility - Same house 1 year ago (%) - Other Race
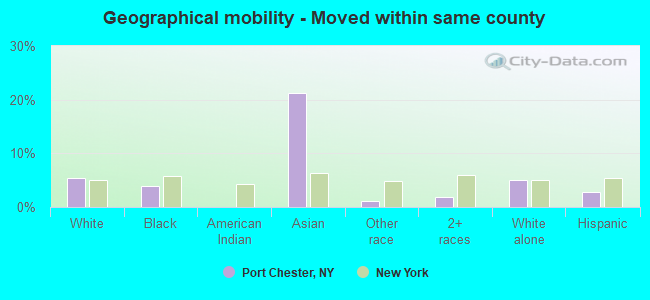
Geographical mobility - Moved within same county (%)
Geographical mobility - Moved within same county (%) - White
Geographical mobility - Moved within same county (%) - Black or African American
Geographical mobility - Moved within same county (%) - Asian
Geographical mobility - Moved within same county (%) - Hispanic or Latino
Geographical mobility - Moved within same county (%) - American Indian and Alaska Native
Geographical mobility - Moved within same county (%) - Multirace
Geographical mobility - Moved within same county (%) - Other Race
Geographical mobility - Moved from different county within same state (%)
Geographical mobility - Moved from different county within same state (%) - White
Geographical mobility - Moved from different county within same state (%) - Black or African American
Geographical mobility - Moved from different county within same state (%) - Asian
Geographical mobility - Moved from different county within same state (%) - Hispanic or Latino
Geographical mobility - Moved from different county within same state (%) - American Indian and Alaska Native
Geographical mobility - Moved from different county within same state (%) - Multirace
Geographical mobility - Moved from different county within same state (%) - Other Race
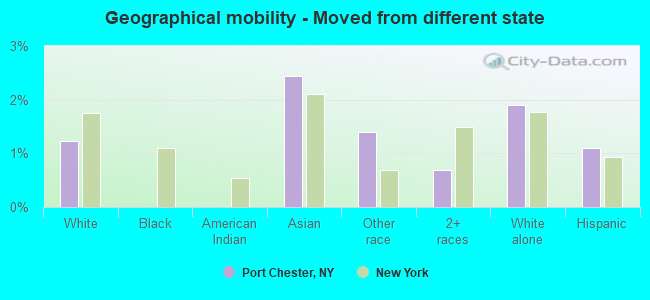
Geographical mobility - Moved from different state (%)
Geographical mobility - Moved from different state (%) - White
Geographical mobility - Moved from different state (%) - Black or African American
Geographical mobility - Moved from different state (%) - Asian
Geographical mobility - Moved from different state (%) - Hispanic or Latino
Geographical mobility - Moved from different state (%) - American Indian and Alaska Native
Geographical mobility - Moved from different state (%) - Multirace
Geographical mobility - Moved from different state (%) - Other Race
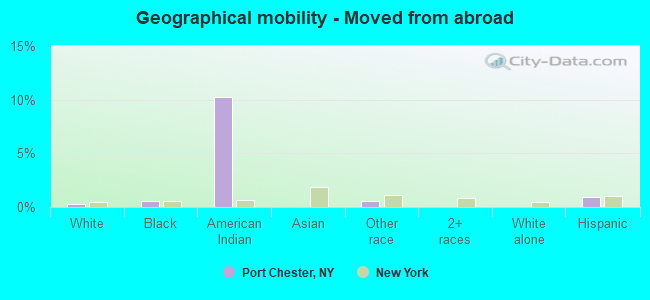
Geographical mobility - Moved from abroad (%)
Geographical mobility - Moved from abroad (%) - White
Geographical mobility - Moved from abroad (%) - Black or African American
Geographical mobility - Moved from abroad (%) - Asian
Geographical mobility - Moved from abroad (%) - Hispanic or Latino
Geographical mobility - Moved from abroad (%) - American Indian and Alaska Native
Geographical mobility - Moved from abroad (%) - Multirace
Geographical mobility - Moved from abroad (%) - Other Race
Place of birth for the foreign-born population - Ireland (%)
Place of birth for the foreign-born population - Denmark (%)
Place of birth for the foreign-born population - Norway (%)
Place of birth for the foreign-born population - Sweden (%)
Place of birth for the foreign-born population - United Kingdom (%)
Place of birth for the foreign-born population - England (%)
Place of birth for the foreign-born population - Scotland (%)
Place of birth for the foreign-born population - Other Northern Europe (%)
Place of birth for the foreign-born population - Austria (%)
Place of birth for the foreign-born population - Belgium (%)
Place of birth for the foreign-born population - France (%)
Place of birth for the foreign-born population - Germany (%)
Place of birth for the foreign-born population - Netherlands (%)
Place of birth for the foreign-born population - Switzerland (%)
Place of birth for the foreign-born population - Other Western Europe (%)
Place of birth for the foreign-born population - Greece (%)
Place of birth for the foreign-born population - Italy (%)
Place of birth for the foreign-born population - Portugal (%)
Place of birth for the foreign-born population - Spain (%)
Place of birth for the foreign-born population - Other Southern Europe (%)
Place of birth for the foreign-born population - Albania (%)
Place of birth for the foreign-born population - Belarus (%)
Place of birth for the foreign-born population - Bosnia and Herzegovina (%)
Place of birth for the foreign-born population - Bulgaria (%)
Place of birth for the foreign-born population - Croatia (%)
Place of birth for the foreign-born population - Czechoslovakia (%)
Place of birth for the foreign-born population - Hungary (%)
Place of birth for the foreign-born population - Latvia (%)
Place of birth for the foreign-born population - Lithuania (%)
Place of birth for the foreign-born population - North Macedonia (Macedonia) (%)
Place of birth for the foreign-born population - Moldova (%)
Place of birth for the foreign-born population - Poland (%)
Place of birth for the foreign-born population - Romania (%)
Place of birth for the foreign-born population - Russia (%)
Place of birth for the foreign-born population - Serbia (%)
Place of birth for the foreign-born population - Ukraine (%)
Place of birth for the foreign-born population - Other Eastern Europe (%)
Place of birth for the foreign-born population - China (%)
Place of birth for the foreign-born population - Hong Kong (%)
Place of birth for the foreign-born population - Taiwan (%)
Place of birth for the foreign-born population - Japan (%)
Place of birth for the foreign-born population - Korea (%)
Place of birth for the foreign-born population - Other Eastern Asia (%)
Place of birth for the foreign-born population - Afghanistan (%)
Place of birth for the foreign-born population - Bangladesh (%)
Place of birth for the foreign-born population - India (%)
Place of birth for the foreign-born population - Iran (%)
Place of birth for the foreign-born population - Kazakhstan (%)
Place of birth for the foreign-born population - Nepal (%)
Place of birth for the foreign-born population - Pakistan (%)
Place of birth for the foreign-born population - Sri Lanka (%)
Place of birth for the foreign-born population - Uzbekistan (%)
Place of birth for the foreign-born population - Other South Central Asia (%)
Place of birth for the foreign-born population - Burma (%)
Place of birth for the foreign-born population - Cambodia (%)
Place of birth for the foreign-born population - Indonesia (%)
Place of birth for the foreign-born population - Laos (%)
Place of birth for the foreign-born population - Malaysia (%)
Place of birth for the foreign-born population - Philippines (%)
Place of birth for the foreign-born population - Singapore (%)
Place of birth for the foreign-born population - Thailand (%)
Place of birth for the foreign-born population - Vietnam (%)
Place of birth for the foreign-born population - Other South Eastern Asia (%)
Place of birth for the foreign-born population - Armenia (%)
Place of birth for the foreign-born population - Iraq (%)
Place of birth for the foreign-born population - Israel (%)
Place of birth for the foreign-born population - Jordan (%)
Place of birth for the foreign-born population - Kuwait (%)
Place of birth for the foreign-born population - Lebanon (%)
Place of birth for the foreign-born population - Saudi Arabia (%)
Place of birth for the foreign-born population - Syria (%)
Place of birth for the foreign-born population - Turkey (%)
Place of birth for the foreign-born population - Yemen (%)
Place of birth for the foreign-born population - Other Western Asia (%)
Place of birth for the foreign-born population - Eritrea (%)
Place of birth for the foreign-born population - Ethiopia (%)
Place of birth for the foreign-born population - Kenya (%)
Place of birth for the foreign-born population - Somalia (%)
Place of birth for the foreign-born population - Uganda (%)
Place of birth for the foreign-born population - Zimbabwe (%)
Place of birth for the foreign-born population - Other Eastern Africa (%)
Place of birth for the foreign-born population - Cameroon (%)
Place of birth for the foreign-born population - Congo (%)
Place of birth for the foreign-born population - Democratic Republic of Congo (Zaire) (%)
Place of birth for the foreign-born population - Other Middle Africa (%)
Place of birth for the foreign-born population - Egypt (%)
Place of birth for the foreign-born population - Morocco (%)
Place of birth for the foreign-born population - Sudan (%)
Place of birth for the foreign-born population - Other Northern Africa (%)
Place of birth for the foreign-born population - South Africa (%)
Place of birth for the foreign-born population - Other Southern Africa (%)
Place of birth for the foreign-born population - Cabo Verde (%)
Place of birth for the foreign-born population - Ghana (%)
Place of birth for the foreign-born population - Liberia (%)
Place of birth for the foreign-born population - Nigeria (%)
Place of birth for the foreign-born population - Senegal (%)
Place of birth for the foreign-born population - Sierra Leone (%)
Place of birth for the foreign-born population - Other Western Africa (%)
Place of birth for the foreign-born population - Australia (%)
Place of birth for the foreign-born population - New Zealand (%)
Place of birth for the foreign-born population - Fiji (%)
Place of birth for the foreign-born population - Micronesia (%)
Place of birth for the foreign-born population - Bahamas (%)
Place of birth for the foreign-born population - Barbados (%)
Place of birth for the foreign-born population - Cuba (%)
Place of birth for the foreign-born population - Dominica (%)
Place of birth for the foreign-born population - Dominican Republic (%)
Place of birth for the foreign-born population - Grenada (%)
Place of birth for the foreign-born population - Haiti (%)
Place of birth for the foreign-born population - Jamaica (%)
Place of birth for the foreign-born population - St. Vincent and the Grenadines (%)
Place of birth for the foreign-born population - Trinidad and Tobago (%)
Place of birth for the foreign-born population - West Indies (%)
Place of birth for the foreign-born population - Other Caribbean (%)
Place of birth for the foreign-born population - Belize (%)
Place of birth for the foreign-born population - Costa Rica (%)
Place of birth for the foreign-born population - El Salvador (%)
Place of birth for the foreign-born population - Guatemala (%)
Place of birth for the foreign-born population - Honduras (%)
Place of birth for the foreign-born population - Mexico (%)
Place of birth for the foreign-born population - Nicaragua (%)
Place of birth for the foreign-born population - Panama (%)
Place of birth for the foreign-born population - Other Central America (%)
Place of birth for the foreign-born population - Argentina (%)
Place of birth for the foreign-born population - Bolivia (%)
Place of birth for the foreign-born population - Brazil (%)
Place of birth for the foreign-born population - Chile (%)
Place of birth for the foreign-born population - Colombia (%)
Place of birth for the foreign-born population - Ecuador (%)
Place of birth for the foreign-born population - Guyana (%)
Place of birth for the foreign-born population - Peru (%)
Place of birth for the foreign-born population - Uruguay (%)
Place of birth for the foreign-born population - Venezuela (%)
Place of birth for the foreign-born population - Other South America (%)
Place of birth for the foreign-born population - Canada (%)
Place of birth for the foreign-born population - Other Northern America (%)
Place of birth for the foreign-born population - Other (%)
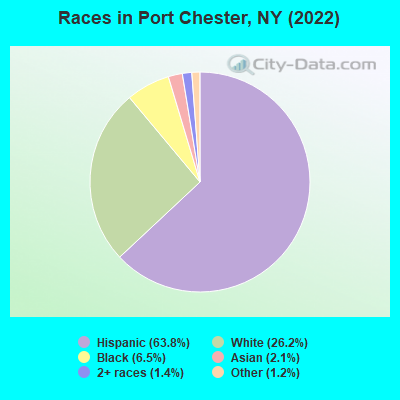
According to 2022 data, the most numerous races in Port Chester, NY are White alone (8,138 residents), Hispanic (19,818 residents), and Black alone (2,008 residents). 37.2% of Port Chester residents speak English at home. 43.0% of Port Chester, NY residents are foreign-born (38.6% born in Latin America), which is 48.8% greater than the foreign-born rate of 22.0% across the entire state of New York.
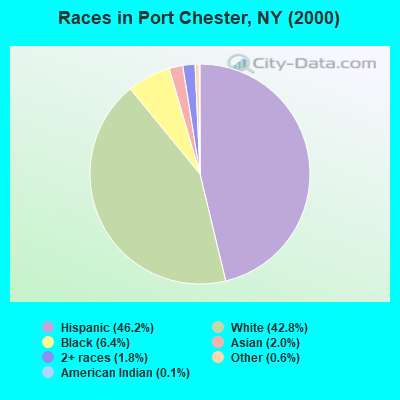
Race distribution in Port Chester
2000 2022
11,760,981 62.0% White alone 2,867,583 15.1% Hispanic 2,812,623 14.8% Black alone 1,035,926 5.5% Asian alone 366,116 1.9% Two or more races 75,499 0.4% Other race alone 52,499 0.3% American Indian alone 5,230 0.03% Native Hawaiian and Other
10,408,933 52.9% White alone 3,867,299 19.7% Hispanic 2,633,840 13.4% Black alone 1,776,286 9.0% Asian alone 732,670 3.7% Two or more races 216,110 1.1% Other race alone 35,082 0.2% American Indian alone 6,931 0.04% Native Hawaiian and Other
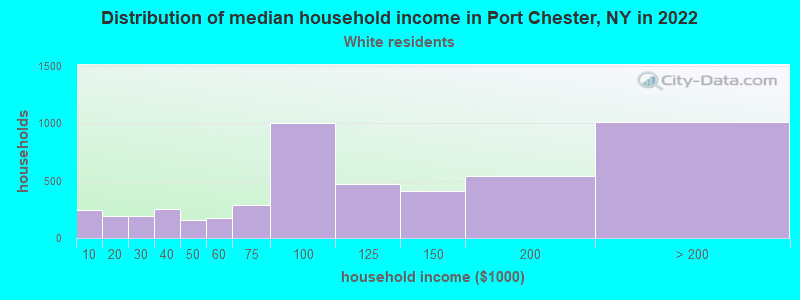
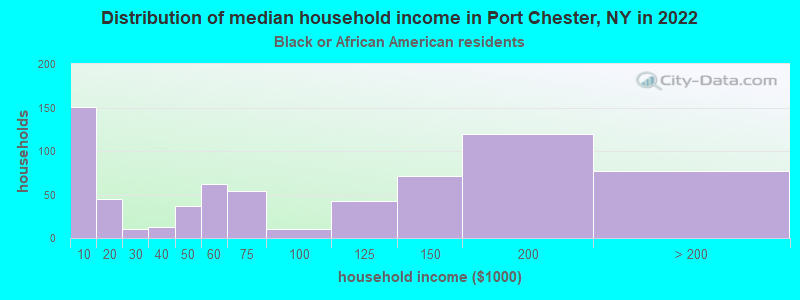
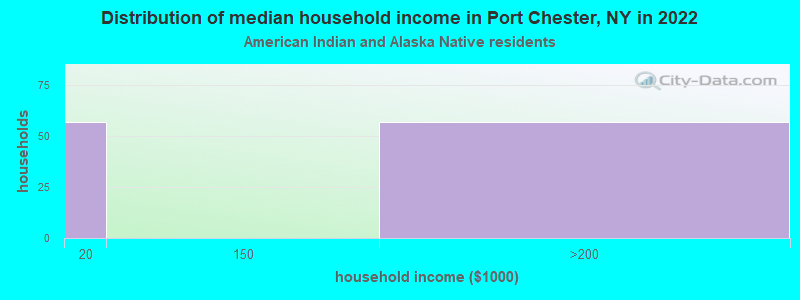
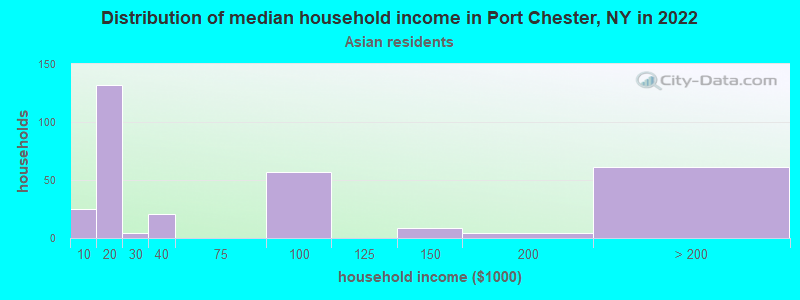
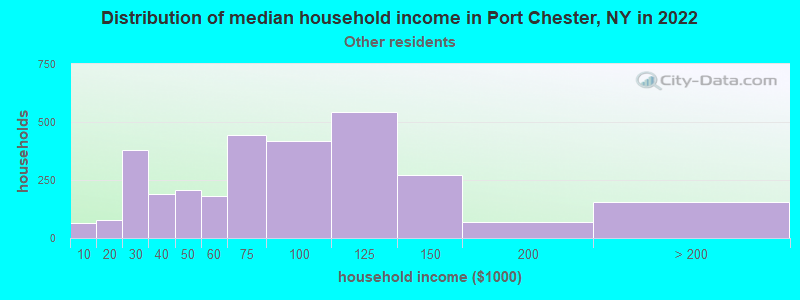
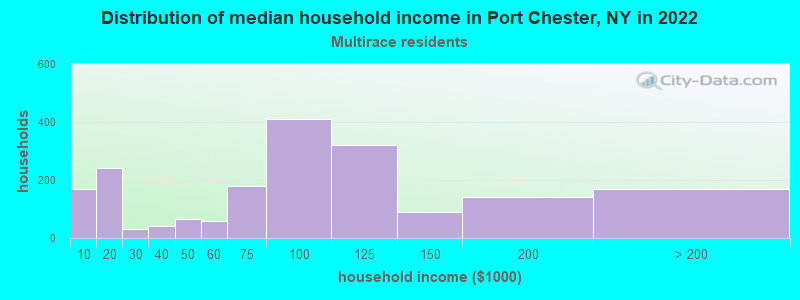
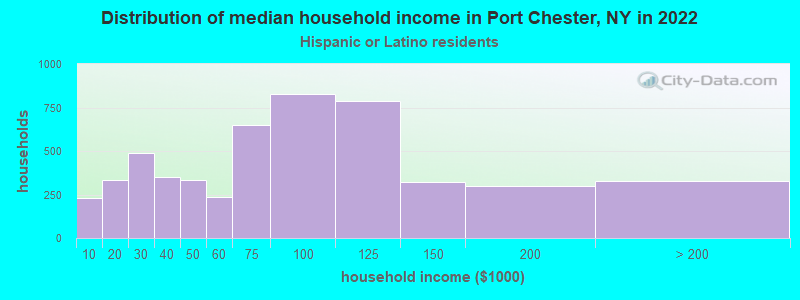
Income and house value in Port Chester Median household income in 2022 $105,540 White non-Hispanic householders$96,424 Black householders$69,219 Some other race householders$81,793 Two or more races householders$71,808 Hispanic or Latino race householdersMedian 2022 house value $580,244 White Non-Hispanic householders$568,867 Black or African American householdersover $1,000,000 American Indian or Alaska Native householders $532,950 Asian householders$601,660 Some other race householders$489,449 Two or more races householders$566,190 Hispanic or Latino householders
Median age by race in Port Chester
42.4 Median age for White residents42.4 41.8 38.6 Median age for Black or African American residents36.4 39.9 42.1 Median age for American Indian / Alaska Native residents37.8 36.6 49.8 Median age for Asian residents52.0 46.1 -487,992,314.6 Median age for Native Hawaiian / Pacific Islander residents-477,502,295.2 -666,666,666.0 36.1 Median age for Other race residents35.9 36.8 35.0 Median age for Two or more races residents31.3 39.5 49.6 Median age for White alone residents49.1 50.3 35.3 Median age for Hispanic or Latino residents35.3 35.5
Owner/renter occupied households by race in Port Chester
House owners and renters - White residents 2,870 59.8% Owner occupied1,926 40.2% Renter occupiedHouse owners and renters - Black or African American residents 263 37.7% Owner occupied436 62.3% Renter occupiedHouse owners and renters - American Indian / Alaska Native residents 51 34.6% Owner occupied97 65.4% Renter occupiedHouse owners and renters - Asian residents 214 67.9% Owner occupied101 32.1% Renter occupiedHouse owners and renters - Other race residents 845 28.1% Owner occupied2,161 71.9% Renter occupiedHouse owners and renters - Two or more races residents 662 35.3% Owner occupied1,213 64.7% Renter occupiedHouse owners and renters - White alone residents 2,609 67.5% Owner occupied1,255 32.5% Renter occupiedHouse owners and renters - Hispanic or Latino residents 1,547 29.4% Owner occupied3,722 70.6% Renter occupied
Language usage in Port Chester
English speakers - Total 37.2% of residents of Port Chester speak English at home.
58.1% of residents speak Spanish at home 8,431 49.6% Speak English very well8,575 50.4% Speak English less than very well5.8% of residents speak other language at home 1,119 66.3% Speak English very well568 33.7% Speak English less than very well
English speakers - Born in the United States 78.4% of residents of Port Chester speak English at home.
15.7% of residents speak Spanish at home 510 90.7% Speak English very well52 9.3% Speak English less than very well3.1% of residents speak other language at home 112 100.0% Speak English very well
English speakers - Native, born elsewhere 21.7% of residents of Port Chester speak English at home.
80.2% of residents speak Spanish at home 199 46.4% Speak English very well230 53.6% Speak English less than very well5.6% of residents speak other language at home 30 100.0% Speak English very well
English speakers - Foreign-born 5.7% of residents of Port Chester speak English at home.
83.1% of residents speak Spanish at home 3,618 32.4% Speak English very well7,560 67.6% Speak English less than very well8.8% of residents speak other language at home 695 58.5% Speak English very well493 41.5% Speak English less than very well
White (Caucasian) - Speak only English Native:
79.7% (6,628)Foreign-born:
14.7% (348)
White (Caucasian) - Speak another language Native:
17.4% (1,446)Foreign-born:
77.6% (1,839)
Black or African American - Speak only English Native:
97.5% (1,628)Foreign-born:
36.7% (143)
Black or African American - Speak another language Native:
3.7% (61)Foreign-born:
60.1% (235)
American Indian / Alaska Native - Speak another language Native:
100.0% (135)Foreign-born:
100.0% (404)
Asian - Speak only English Native:
46.2% (72)Foreign-born:
21.3% (105)
Asian - Speak another language Native:
54.0% (84)Foreign-born:
79.0% (389)
Other race - Speak only English Native:
15.3% (545)Foreign-born:
2.5% (181)
Other race - Speak another language Native:
86.8% (3,086)Foreign-born:
95.2% (6,995)
Two or more races - Speak another language Native:
50.8% (1,431)Foreign-born:
100.0% (3,309)
White alone - Speak only English Native:
92.1% (6,505)Foreign-born:
42.8% (352)
White alone - Speak another language Native:
7.8% (551)Foreign-born:
57.8% (476)
Hispanic or Latino - Speak only English Native:
21.9% (1,493)Foreign-born:
1.3% (148)
Hispanic or Latino - Speak another language Native:
79.9% (5,438)Foreign-born:
97.3% (11,326)
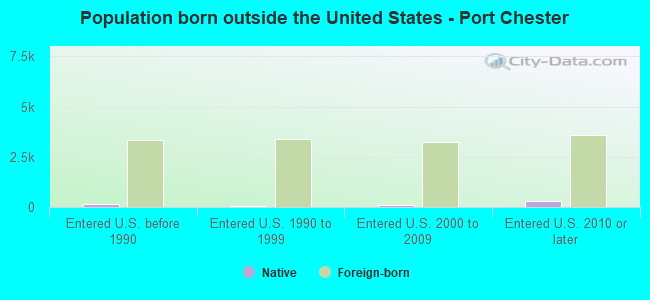
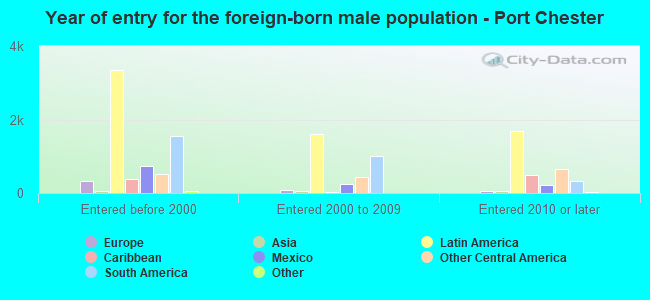
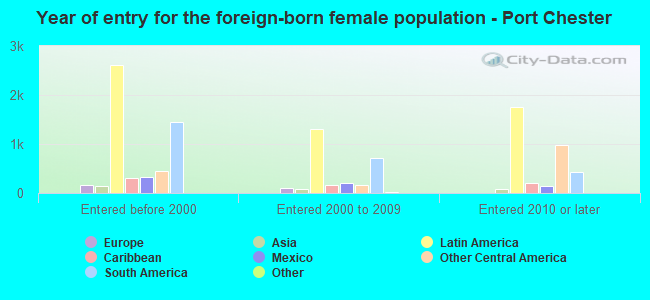
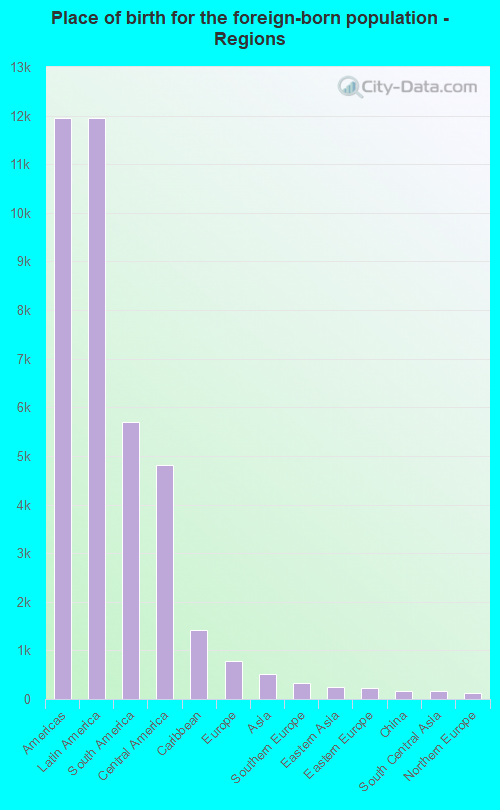
Foreign-born residents in Port Chester 13,342 residents are foreign born (38.6% Latin America ).
This city:
43.0%New York:
22.6%
Marital status for residents in Port Chester Marital status - White (Caucasian) population 15 years and over
Males 37.2% Never married53.0% Now married1.9% Separated0.8% Widowed7.2% DivorcedFemales 29.3% Never married47.2% Now married2.8% Separated8.5% Widowed12.2% DivorcedWomen who gave birth in the past 12 months Now married:
60.5% (87)Unmarried:
39.5% (57)
Women who did not give birth in the past 12 months Now married:
52.5% (1,335)Unmarried:
47.5% (1,206)
Marital status - Black or African American population 15 years and over
Males 48.8% Never married40.4% Now married3.1% Separated2.1% Widowed5.6% DivorcedFemales 36.8% Never married38.7% Now married6.5% Separated4.6% Widowed13.4% DivorcedWomen who gave birth in the past 12 months Now married:
0.0% (0)Unmarried:
100.0% (78)
Women who did not give birth in the past 12 months Now married:
55.1% (231)Unmarried:
44.9% (189)
Marital status - American Indian / Alaska Native population 15 years and over
Males 31.9% Never married43.5% Now married0.0% Separated0.0% Widowed24.6% DivorcedFemales 50.3% Never married35.3% Now married0.0% Separated14.4% Widowed0.0% DivorcedWomen who did not give birth in the past 12 months Now married:
21.4% (30)Unmarried:
78.6% (110)
Marital status - Asian population 15 years and over
Males 10.3% Never married85.6% Now married0.0% Separated0.0% Widowed4.0% DivorcedFemales 15.8% Never married54.8% Now married0.0% Separated7.0% Widowed22.4% DivorcedWomen who did not give birth in the past 12 months Now married:
36.7% (95)Unmarried:
63.3% (164)
Marital status - Other race population 15 years and over
Males 38.1% Never married52.7% Now married1.4% Separated0.8% Widowed7.1% DivorcedFemales 34.6% Never married52.0% Now married3.5% Separated1.8% Widowed8.1% DivorcedWomen who gave birth in the past 12 months Now married:
68.2% (114)Unmarried:
31.8% (53)
Women who did not give birth in the past 12 months Now married:
51.0% (1,441)Unmarried:
49.0% (1,383)
Marital status - Two or more races population 15 years and over
Males 49.2% Never married35.8% Now married0.0% Separated0.0% Widowed15.0% DivorcedFemales 41.8% Never married34.1% Now married4.1% Separated8.8% Widowed11.2% DivorcedWomen who gave birth in the past 12 months Now married:
0.0% (0)Unmarried:
100.0% (20)
Women who did not give birth in the past 12 months Now married:
22.5% (241)Unmarried:
77.5% (829)
Marital status - White alone, not Hispanic / Latino population 15 years and over
Males 31.3% Never married58.8% Now married2.2% Separated1.1% Widowed6.6% DivorcedFemales 23.8% Never married50.6% Now married3.9% Separated8.9% Widowed12.8% DivorcedWomen who gave birth in the past 12 months Now married:
87.5% (93)Unmarried:
12.5% (13)
Women who did not give birth in the past 12 months Now married:
59.5% (993)Unmarried:
40.5% (677)
Marital status - Hispanic or Latino population 15 years and over
Males 42.9% Never married46.4% Now married1.0% Separated0.5% Widowed9.1% DivorcedFemales 38.4% Never married45.7% Now married2.2% Separated4.7% Widowed8.9% DivorcedWomen who gave birth in the past 12 months Now married:
47.2% (101)Unmarried:
52.8% (113)
Women who did not give birth in the past 12 months Now married:
43.5% (1,946)Unmarried:
56.5% (2,523)
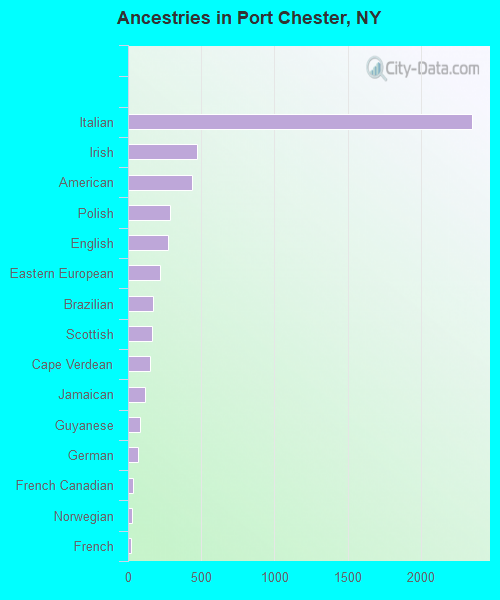
Ancestries in Port Chester
2,348 12.6% Italian472 2.5% Irish437 2.4% American285 1.5% Polish270 1.5% English216 1.2% Eastern European169 0.9% Brazilian167 0.9% Scottish148 0.8% Cape Verdean119 0.6% Jamaican81 0.4% Guyanese68 0.4% German31 0.2% French Canadian29 0.2% Norwegian23 0.1% French21 0.1% African17 0.09% Basque17 0.09% European17 0.09% Iranian15 0.08% Ukrainian13 0.07% Lebanese11 0.06% Greek9 0.05% Egyptian9 0.05% Danish9 0.05% British West Indian8 0.04% Czechoslovakian5 0.03% Czech4 0.02% Maltese3 0.02% British2 0.01% Barbadian1 0.01% Ghanaian
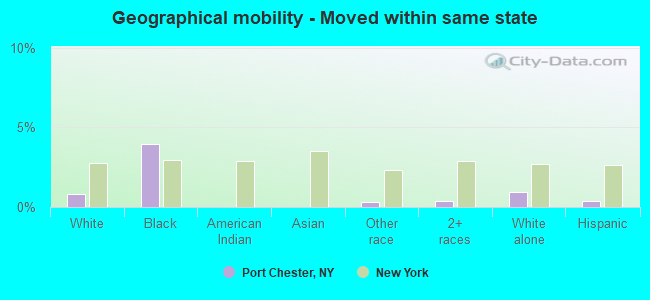
Geographical mobility in Port Chester Same house 1 year ago 10,485 92.2% White (Caucasian)2,011 91.1% Black or African American339 88.1% American Indian / Alaska Native533 81.8% Asian11,151 96.8% Other race5,883 93.4% Two or more races7,448 92.0% White alone, not Hispanic / Latino18,070 93.8% Hispanic or LatinoMoved within same county 607 5.3% White / Caucasian84 3.8% Black or African American139 21.3% Asian130 1.1% Other race122 1.9% Two or more races409 5.1% White alone, not Hispanic / Latino523 2.7% Hispanic or LatinoMoved within same state 92 0.8% White / Caucasian87 3.9% Black or African American34 0.3% Other race22 0.3% Two or more races77 1.0% White alone, not Hispanic / Latino74 0.4% Hispanic or LatinoMoved from different state 140 1.2% White / Caucasian16 2.4% Asian160 1.4% Other race44 0.7% Two or more races153 1.9% White alone, not Hispanic / Latino212 1.1% Hispanic or LatinoMoved from abroad 35 0.3% White12 0.6% Black or African American40 10.3% American Indian / Alaska Native60 0.5% Other race178 0.9% Hispanic or Latino
Children Nativity (place of birth) in Port Chester
Children under 6 years - Living with two parents Both parents native 477 100.0% NativeBoth parents foreign-born 374 100.0% NativeOne native, one foreign-born parent 500 100.0% NativeChildren under 6 years - Living with one parent Native parent 245 100.0% NativeForeign-born parent 302 79.0% Native80 21.0% Foreign-bornChildren 6 to 17 years - Living with two parents Both parents native 587 100.0% NativeBoth parents foreign-born 1,247 86.8% Native190 13.2% Foreign-bornOne native, one foreign-born parent 254 100.0% NativeChildren 6 to 17 years - Living with one parent Native parent 206 100.0% NativeForeign-born parent 963 58.8% Native673 41.2% Foreign-born
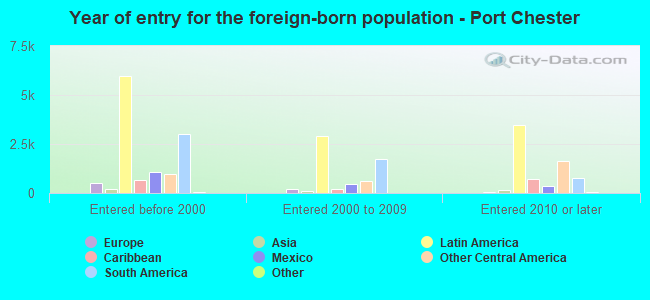
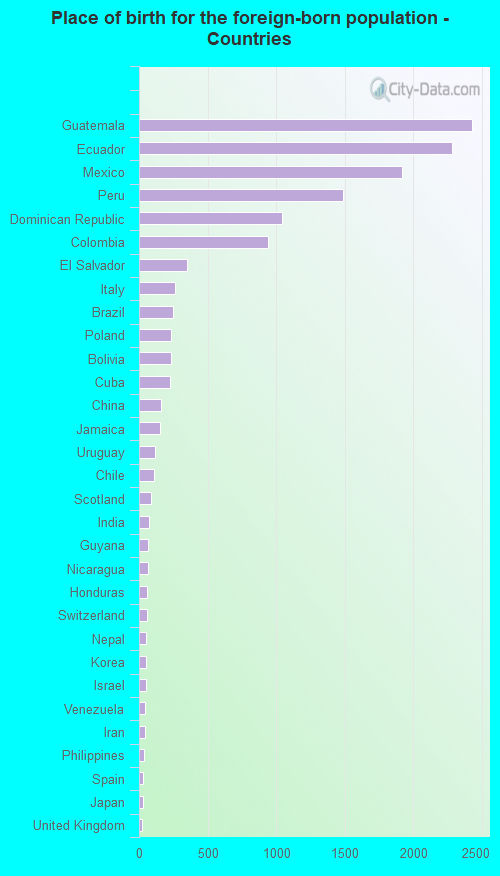
Place of birth for residents in Port Chester 11,943 Americas11,943 Latin America5,698 South America4,821 Central America1,423 Caribbean782 Europe513 Asia333 Southern Europe253 Eastern Asia233 Eastern Europe172 China165 South Central Asia126 Northern Europe89 Western Europe80 Africa69 Western Africa49 Western Asia45 South Eastern Asia22 Oceania22 Australia and New Zealand Subregion2,430 Guatemala2,281 Ecuador1,917 Mexico1,488 Peru1,046 Dominican Republic944 Colombia347 El Salvador260 Italy251 Brazil233 Poland230 Bolivia226 Cuba159 China150 Jamaica118 Uruguay107 Chile86 Scotland72 India66 Guyana63 Nicaragua59 Honduras56 Switzerland51 Nepal50 Korea49 Israel46 Venezuela41 Iran40 Philippines32 Spain30 Japan25 United Kingdom22 Australia21 Belgium17 Portugal16 Cabo Verde15 Greece14 Ireland12 Hong Kong11 Argentina10 Germany4 Singapore3 Panama1 Ghana
Grandparents responsible for own grandchildren in Port Chester
Grandparents (30 to 59 years) Other race 101 100.0% Not responsible for grandchildrenTwo or more races 29 14.5% Responsible for grandchildren171 85.5% Not responsible for grandchildrenHispanic or Latino 30 16.5% Responsible for grandchildren152 83.5% Not responsible for grandchildren
Grandparents (60 years and over) Other race 134 100.0% Not responsible for grandchildrenTwo or more races 23 100.0% Not responsible for grandchildrenHispanic or Latino 130 100.0% Not responsible for grandchildren