Races in Port Orchard, Washington (WA) Detailed Stats
Data:
Races - White alone (%)
Races - White alone (% change since 2000)
Races - Black alone (%)
Races - Black alone (% change since 2000)
Races - American Indian alone (%)
Races - American Indian alone (% change since 2000)
Races - Asian alone (%)
Races - Asian alone (% change since 2000)
Races - Hispanic (%)
Races - Hispanic (% change since 2000)
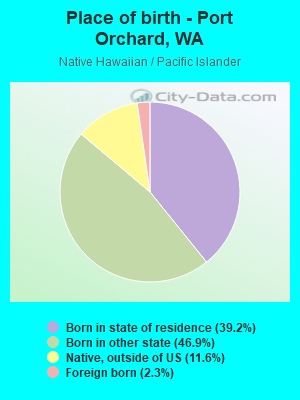
Races - Native Hawaiian and Other Pacific Islander alone (%)
Races - Native Hawaiian and Other Pacific Islander alone (% change since 2000)
Races - Two or more races(%)
Races - Two or more races(% change since 2000)
Races - Other race alone (%)
Races - Other race alone (% change since 2000)
Racial diversity
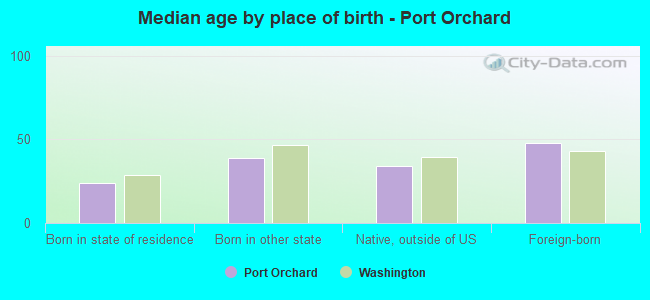
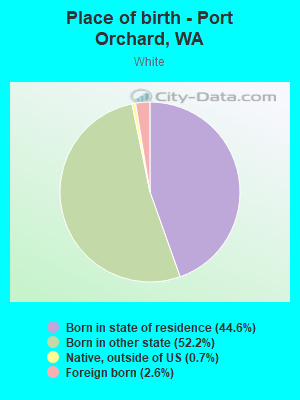
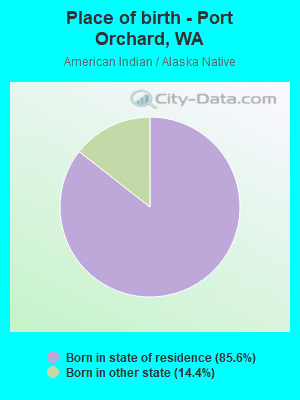
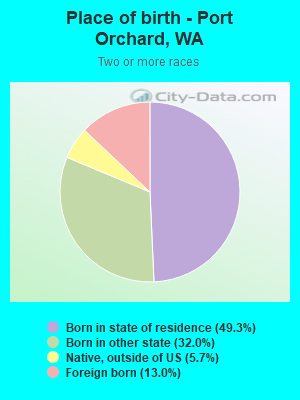
Place of birth - Born in state of residence (%)
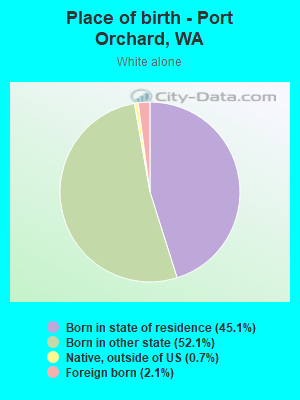
Place of birth - Born in state of residence (%) - White
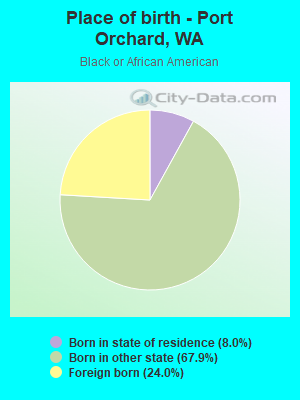
Place of birth - Born in state of residence (%) - Black or African American
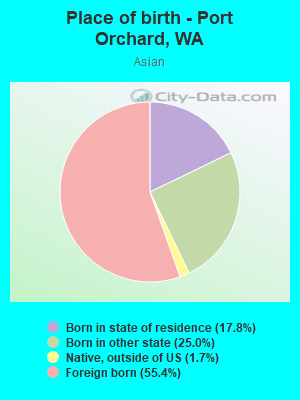
Place of birth - Born in state of residence (%) - Asian
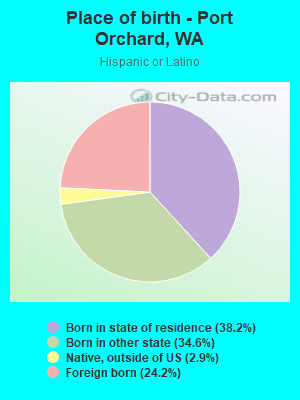
Place of birth - Born in state of residence (%) - Hispanic or Latino
Place of birth - Born in state of residence (%) - American Indian and Alaska Native
Place of birth - Born in state of residence (%) - Multirace
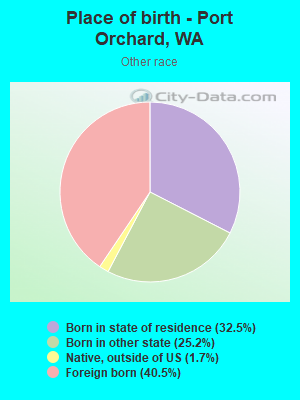
Place of birth - Born in state of residence (%) - Other Race
Place of birth - Born in other state (%)
Place of birth - Born in other state (%) - White
Place of birth - Born in other state (%) - Black or African American
Place of birth - Born in other state (%) - Asian
Place of birth - Born in other state (%) - Hispanic or Latino
Place of birth - Born in other state (%) - American Indian and Alaska Native
Place of birth - Born in other state (%) - Multirace
Place of birth - Born in other state (%) - Other Race
Place of birth - Native, outside of US (%)
Place of birth - Native, outside of US (%) - White
Place of birth - Native, outside of US (%) - Black or African American
Place of birth - Native, outside of US (%) - Asian
Place of birth - Native, outside of US (%) - Hispanic or Latino
Place of birth - Native, outside of US (%) - American Indian and Alaska Native
Place of birth - Native, outside of US (%) - Multirace
Place of birth - Native, outside of US (%) - Other Race
Place of birth - Foreign born (%)
Place of birth - Foreign born (%) - White
Place of birth - Foreign born (%) - Black or African American
Place of birth - Foreign born (%) - Asian
Place of birth - Foreign born (%) - Hispanic or Latino
Place of birth - Foreign born (%) - American Indian and Alaska Native
Place of birth - Foreign born (%) - Multirace
Place of birth - Foreign born (%) - Other Race
Residents speaking English at home (%)
Residents speaking English at home - Born in the United States (%)
Residents speaking English at home - Native, born elsewhere (%)
Residents speaking English at home - Foreign born (%)
Residents speaking Spanish at home (%)
Residents speaking Spanish at home - Born in the United States (%)
Residents speaking Spanish at home - Native, born elsewhere (%)
Residents speaking Spanish at home - Foreign born (%)
Residents speaking other language at home (%)
Residents speaking other language at home - Born in the United States (%)
Residents speaking other language at home - Native, born elsewhere (%)
Residents speaking other language at home - Foreign born (%)
Marital status - Never married (%)
Marital status - Now married (%)
Marital status - Separated (%)
Marital status - Widowed (%)
Marital status - Divorced (%)
Ancestries Reported - Arab (%)
Ancestries Reported - Czech (%)
Ancestries Reported - Danish (%)
Ancestries Reported - Dutch (%)
Ancestries Reported - English (%)
Ancestries Reported - French (%)
Ancestries Reported - French Canadian (%)
Ancestries Reported - German (%)
Ancestries Reported - Greek (%)
Ancestries Reported - Hungarian (%)
Ancestries Reported - Irish (%)
Ancestries Reported - Italian (%)
Ancestries Reported - Lithuanian (%)
Ancestries Reported - Norwegian (%)
Ancestries Reported - Polish (%)
Ancestries Reported - Portuguese (%)
Ancestries Reported - Russian (%)
Ancestries Reported - Scotch-Irish (%)
Ancestries Reported - Scottish (%)
Ancestries Reported - Slovak (%)
Ancestries Reported - Subsaharan African (%)
Ancestries Reported - Swedish (%)
Ancestries Reported - Swiss (%)
Ancestries Reported - Ukrainian (%)
Ancestries Reported - United States (%)
Ancestries Reported - Welsh (%)
Ancestries Reported - West Indian (%)
Ancestries Reported - Other (%)
Geographical mobility - Same house 1 year ago (%)
Geographical mobility - Same house 1 year ago (%) - White
Geographical mobility - Same house 1 year ago (%) - Black or African American
Geographical mobility - Same house 1 year ago (%) - Asian
Geographical mobility - Same house 1 year ago (%) - Hispanic or Latino
Geographical mobility - Same house 1 year ago (%) - American Indian and Alaska Native
Geographical mobility - Same house 1 year ago (%) - Multirace
Geographical mobility - Same house 1 year ago (%) - Other Race
Geographical mobility - Moved within same county (%)
Geographical mobility - Moved within same county (%) - White
Geographical mobility - Moved within same county (%) - Black or African American
Geographical mobility - Moved within same county (%) - Asian
Geographical mobility - Moved within same county (%) - Hispanic or Latino
Geographical mobility - Moved within same county (%) - American Indian and Alaska Native
Geographical mobility - Moved within same county (%) - Multirace
Geographical mobility - Moved within same county (%) - Other Race
Geographical mobility - Moved from different county within same state (%)
Geographical mobility - Moved from different county within same state (%) - White
Geographical mobility - Moved from different county within same state (%) - Black or African American
Geographical mobility - Moved from different county within same state (%) - Asian
Geographical mobility - Moved from different county within same state (%) - Hispanic or Latino
Geographical mobility - Moved from different county within same state (%) - American Indian and Alaska Native
Geographical mobility - Moved from different county within same state (%) - Multirace
Geographical mobility - Moved from different county within same state (%) - Other Race
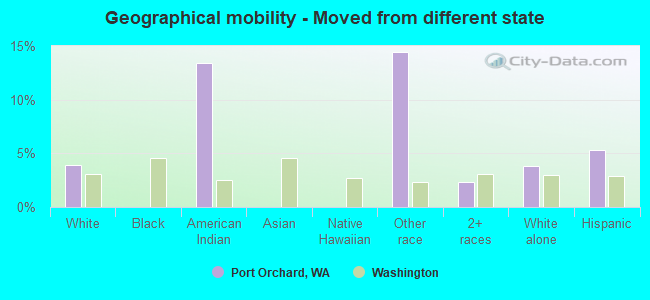
Geographical mobility - Moved from different state (%)
Geographical mobility - Moved from different state (%) - White
Geographical mobility - Moved from different state (%) - Black or African American
Geographical mobility - Moved from different state (%) - Asian
Geographical mobility - Moved from different state (%) - Hispanic or Latino
Geographical mobility - Moved from different state (%) - American Indian and Alaska Native
Geographical mobility - Moved from different state (%) - Multirace
Geographical mobility - Moved from different state (%) - Other Race
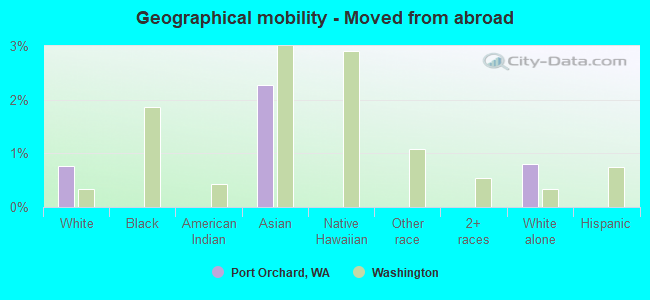
Geographical mobility - Moved from abroad (%)
Geographical mobility - Moved from abroad (%) - White
Geographical mobility - Moved from abroad (%) - Black or African American
Geographical mobility - Moved from abroad (%) - Asian
Geographical mobility - Moved from abroad (%) - Hispanic or Latino
Geographical mobility - Moved from abroad (%) - American Indian and Alaska Native
Geographical mobility - Moved from abroad (%) - Multirace
Geographical mobility - Moved from abroad (%) - Other Race
Place of birth for the foreign-born population - Ireland (%)
Place of birth for the foreign-born population - Denmark (%)
Place of birth for the foreign-born population - Norway (%)
Place of birth for the foreign-born population - Sweden (%)
Place of birth for the foreign-born population - United Kingdom (%)
Place of birth for the foreign-born population - England (%)
Place of birth for the foreign-born population - Scotland (%)
Place of birth for the foreign-born population - Other Northern Europe (%)
Place of birth for the foreign-born population - Austria (%)
Place of birth for the foreign-born population - Belgium (%)
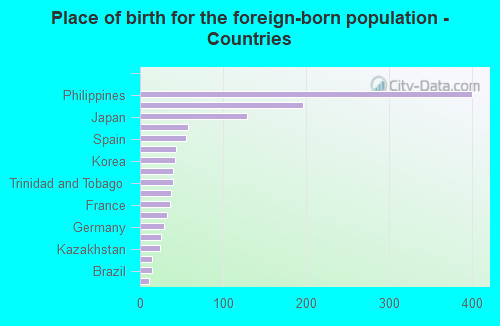
Place of birth for the foreign-born population - France (%)
Place of birth for the foreign-born population - Germany (%)
Place of birth for the foreign-born population - Netherlands (%)
Place of birth for the foreign-born population - Switzerland (%)
Place of birth for the foreign-born population - Other Western Europe (%)
Place of birth for the foreign-born population - Greece (%)
Place of birth for the foreign-born population - Italy (%)
Place of birth for the foreign-born population - Portugal (%)
Place of birth for the foreign-born population - Spain (%)
Place of birth for the foreign-born population - Other Southern Europe (%)
Place of birth for the foreign-born population - Albania (%)
Place of birth for the foreign-born population - Belarus (%)
Place of birth for the foreign-born population - Bosnia and Herzegovina (%)
Place of birth for the foreign-born population - Bulgaria (%)
Place of birth for the foreign-born population - Croatia (%)
Place of birth for the foreign-born population - Czechoslovakia (%)
Place of birth for the foreign-born population - Hungary (%)
Place of birth for the foreign-born population - Latvia (%)
Place of birth for the foreign-born population - Lithuania (%)
Place of birth for the foreign-born population - North Macedonia (Macedonia) (%)
Place of birth for the foreign-born population - Moldova (%)
Place of birth for the foreign-born population - Poland (%)
Place of birth for the foreign-born population - Romania (%)
Place of birth for the foreign-born population - Russia (%)
Place of birth for the foreign-born population - Serbia (%)
Place of birth for the foreign-born population - Ukraine (%)
Place of birth for the foreign-born population - Other Eastern Europe (%)
Place of birth for the foreign-born population - China (%)
Place of birth for the foreign-born population - Hong Kong (%)
Place of birth for the foreign-born population - Taiwan (%)
Place of birth for the foreign-born population - Japan (%)
Place of birth for the foreign-born population - Korea (%)
Place of birth for the foreign-born population - Other Eastern Asia (%)
Place of birth for the foreign-born population - Afghanistan (%)
Place of birth for the foreign-born population - Bangladesh (%)
Place of birth for the foreign-born population - India (%)
Place of birth for the foreign-born population - Iran (%)
Place of birth for the foreign-born population - Kazakhstan (%)
Place of birth for the foreign-born population - Nepal (%)
Place of birth for the foreign-born population - Pakistan (%)
Place of birth for the foreign-born population - Sri Lanka (%)
Place of birth for the foreign-born population - Uzbekistan (%)
Place of birth for the foreign-born population - Other South Central Asia (%)
Place of birth for the foreign-born population - Burma (%)
Place of birth for the foreign-born population - Cambodia (%)
Place of birth for the foreign-born population - Indonesia (%)
Place of birth for the foreign-born population - Laos (%)
Place of birth for the foreign-born population - Malaysia (%)
Place of birth for the foreign-born population - Philippines (%)
Place of birth for the foreign-born population - Singapore (%)
Place of birth for the foreign-born population - Thailand (%)
Place of birth for the foreign-born population - Vietnam (%)
Place of birth for the foreign-born population - Other South Eastern Asia (%)
Place of birth for the foreign-born population - Armenia (%)
Place of birth for the foreign-born population - Iraq (%)
Place of birth for the foreign-born population - Israel (%)
Place of birth for the foreign-born population - Jordan (%)
Place of birth for the foreign-born population - Kuwait (%)
Place of birth for the foreign-born population - Lebanon (%)
Place of birth for the foreign-born population - Saudi Arabia (%)
Place of birth for the foreign-born population - Syria (%)
Place of birth for the foreign-born population - Turkey (%)
Place of birth for the foreign-born population - Yemen (%)
Place of birth for the foreign-born population - Other Western Asia (%)
Place of birth for the foreign-born population - Eritrea (%)
Place of birth for the foreign-born population - Ethiopia (%)
Place of birth for the foreign-born population - Kenya (%)
Place of birth for the foreign-born population - Somalia (%)
Place of birth for the foreign-born population - Uganda (%)
Place of birth for the foreign-born population - Zimbabwe (%)
Place of birth for the foreign-born population - Other Eastern Africa (%)
Place of birth for the foreign-born population - Cameroon (%)
Place of birth for the foreign-born population - Congo (%)
Place of birth for the foreign-born population - Democratic Republic of Congo (Zaire) (%)
Place of birth for the foreign-born population - Other Middle Africa (%)
Place of birth for the foreign-born population - Egypt (%)
Place of birth for the foreign-born population - Morocco (%)
Place of birth for the foreign-born population - Sudan (%)
Place of birth for the foreign-born population - Other Northern Africa (%)
Place of birth for the foreign-born population - South Africa (%)
Place of birth for the foreign-born population - Other Southern Africa (%)
Place of birth for the foreign-born population - Cabo Verde (%)
Place of birth for the foreign-born population - Ghana (%)
Place of birth for the foreign-born population - Liberia (%)
Place of birth for the foreign-born population - Nigeria (%)
Place of birth for the foreign-born population - Senegal (%)
Place of birth for the foreign-born population - Sierra Leone (%)
Place of birth for the foreign-born population - Other Western Africa (%)
Place of birth for the foreign-born population - Australia (%)
Place of birth for the foreign-born population - New Zealand (%)
Place of birth for the foreign-born population - Fiji (%)
Place of birth for the foreign-born population - Micronesia (%)
Place of birth for the foreign-born population - Bahamas (%)
Place of birth for the foreign-born population - Barbados (%)
Place of birth for the foreign-born population - Cuba (%)
Place of birth for the foreign-born population - Dominica (%)
Place of birth for the foreign-born population - Dominican Republic (%)
Place of birth for the foreign-born population - Grenada (%)
Place of birth for the foreign-born population - Haiti (%)
Place of birth for the foreign-born population - Jamaica (%)
Place of birth for the foreign-born population - St. Vincent and the Grenadines (%)
Place of birth for the foreign-born population - Trinidad and Tobago (%)
Place of birth for the foreign-born population - West Indies (%)
Place of birth for the foreign-born population - Other Caribbean (%)
Place of birth for the foreign-born population - Belize (%)
Place of birth for the foreign-born population - Costa Rica (%)
Place of birth for the foreign-born population - El Salvador (%)
Place of birth for the foreign-born population - Guatemala (%)
Place of birth for the foreign-born population - Honduras (%)
Place of birth for the foreign-born population - Mexico (%)
Place of birth for the foreign-born population - Nicaragua (%)
Place of birth for the foreign-born population - Panama (%)
Place of birth for the foreign-born population - Other Central America (%)
Place of birth for the foreign-born population - Argentina (%)
Place of birth for the foreign-born population - Bolivia (%)
Place of birth for the foreign-born population - Brazil (%)
Place of birth for the foreign-born population - Chile (%)
Place of birth for the foreign-born population - Colombia (%)
Place of birth for the foreign-born population - Ecuador (%)
Place of birth for the foreign-born population - Guyana (%)
Place of birth for the foreign-born population - Peru (%)
Place of birth for the foreign-born population - Uruguay (%)
Place of birth for the foreign-born population - Venezuela (%)
Place of birth for the foreign-born population - Other South America (%)
Place of birth for the foreign-born population - Canada (%)
Place of birth for the foreign-born population - Other Northern America (%)
Place of birth for the foreign-born population - Other (%)
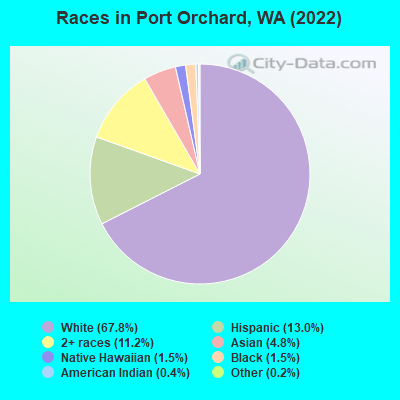
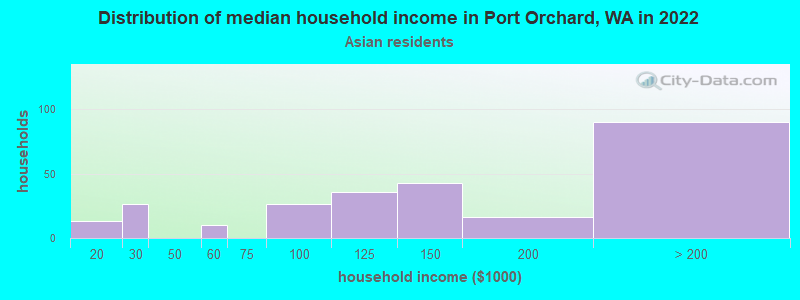
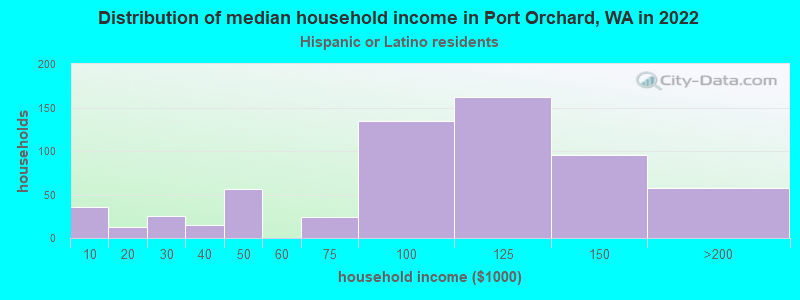
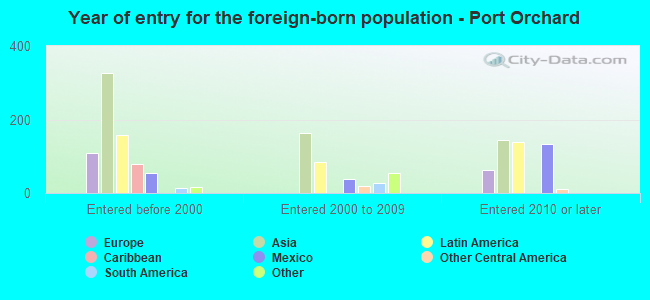
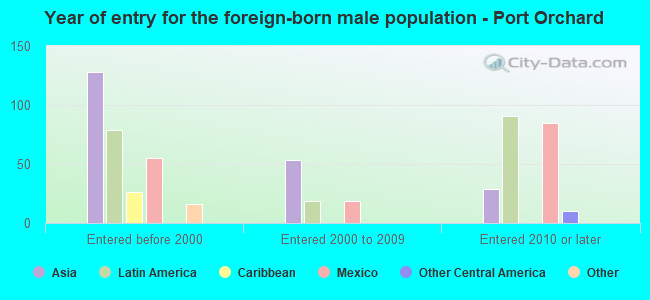
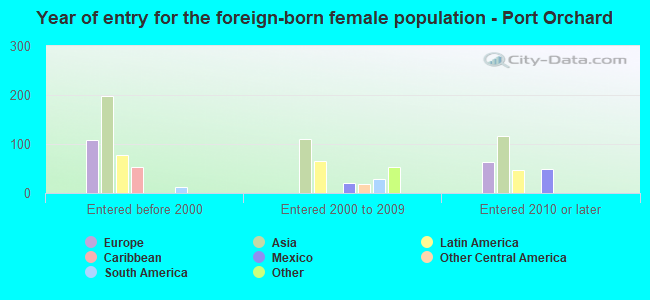
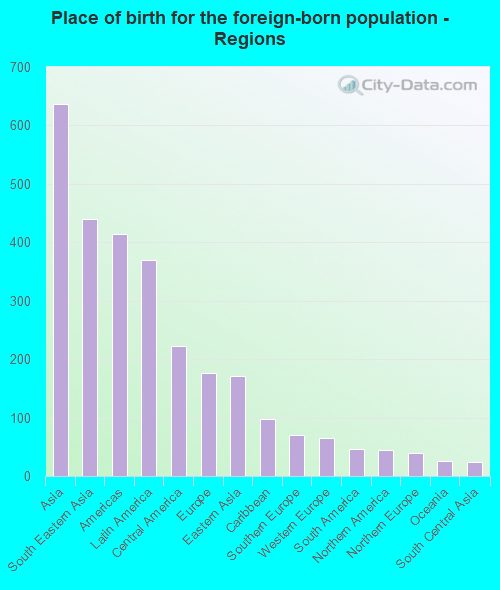
According to 2022 data, the most numerous races in Port Orchard, WA are White alone (10,811 residents), Hispanic (2,076 residents), and Asian alone (766 residents). 89.4% of Port Orchard residents speak English at home. 7.9% of Port Orchard, WA residents are foreign-born (3.9% born in Asia, 2.2% born in Latin America, 1.1% born in Europe), which is 90.6% less than the foreign-born rate of 15.0% across the entire state of Washington.
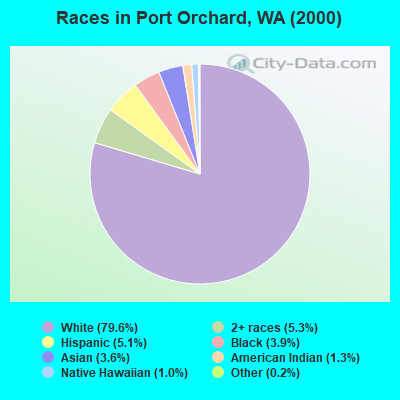
Race distribution in Port Orchard
2000 2022
4,652,490 78.9% White alone 441,509 7.5% Hispanic 319,401 5.4% Asian alone 184,631 3.1% Black alone 175,926 3.0% Two or more races 85,396 1.4% American Indian alone 22,779 0.4% Native Hawaiian and Other 11,989 0.2% Other race alone
4,941,456 63.5% White alone 1,093,313 14.0% Hispanic 755,832 9.7% Asian alone 523,448 6.7% Two or more races 299,537 3.8% Black alone 69,024 0.9% American Indian alone 52,231 0.7% Native Hawaiian and Other 50,945 0.7% Other race alone
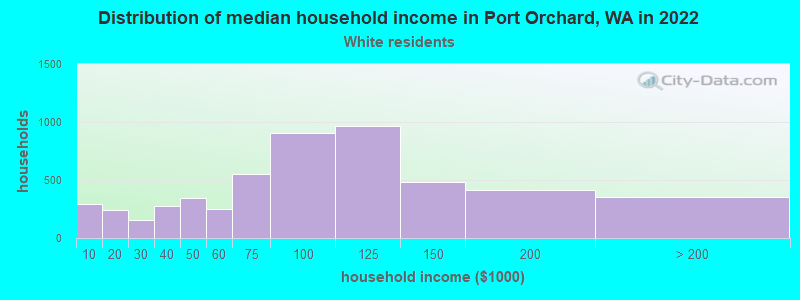
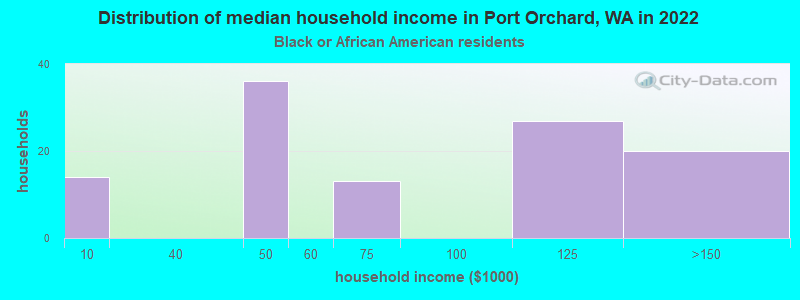
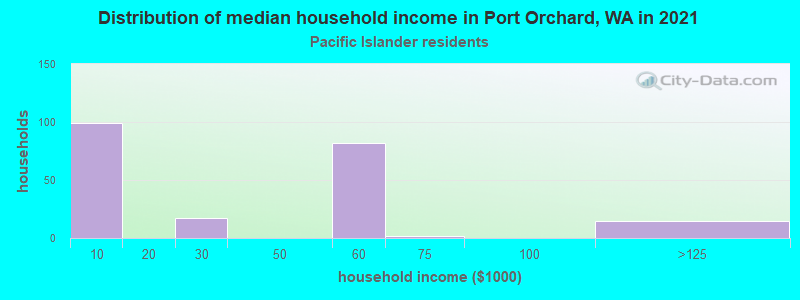
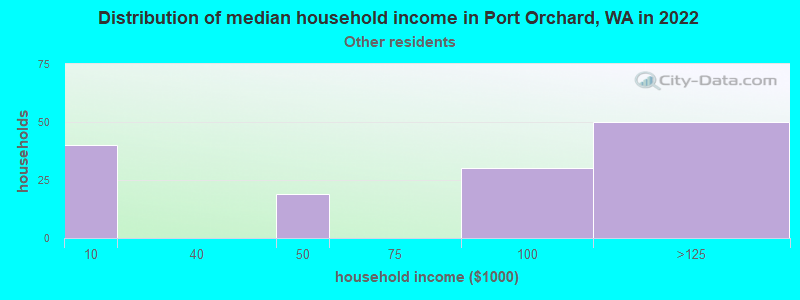
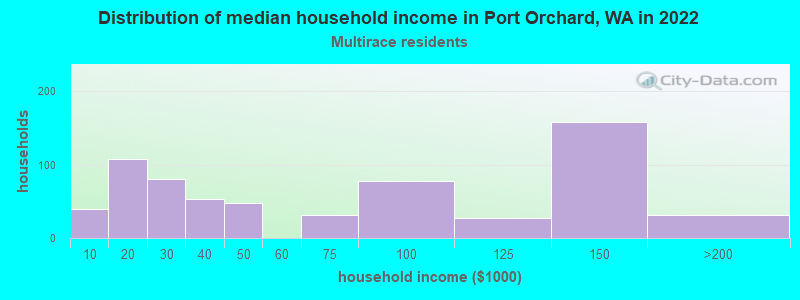
Income and house value in Port Orchard Median household income in 2022 $84,763 White non-Hispanic householders$197,404 Asian householders$73,667 Two or more races householders$94,760 Hispanic or Latino race householdersMedian 2022 house value $544,375 White Non-Hispanic householders$418,750 American Indian or Alaska Native householders $523,658 Asian householdersover $1,000,000 Native Hawaiian and other Pacific Islander householders$330,592 Some other race householders$472,086 Two or more races householders
Median age by race in Port Orchard
36.6 Median age for White residents36.2 38.0 39.9 Median age for Black or African American residents36.2 51.7 40.4 Median age for American Indian / Alaska Native residents44.2 44.9 51.5 Median age for Asian residents38.8 55.4 27.2 Median age for Native Hawaiian / Pacific Islander residents31.7 30.7 25.0 Median age for Other race residents14.9 25.9 17.5 Median age for Two or more races residents17.1 18.0 37.3 Median age for White alone residents36.4 38.7 29.5 Median age for Hispanic or Latino residents30.9 24.6
Owner/renter occupied households by race in Port Orchard
House owners and renters - White residents 3,305 63.4% Owner occupied1,908 36.6% Renter occupiedHouse owners and renters - Black or African American residents 106 100.0% Owner occupiedHouse owners and renters - Asian residents 221 78.5% Owner occupied61 21.5% Renter occupiedHouse owners and renters - Native Hawaiian / Pacific Islander residents 36 33.6% Owner occupied70 66.4% Renter occupiedHouse owners and renters - Other race residents 44 29.2% Owner occupied106 70.8% Renter occupiedHouse owners and renters - Two or more races residents 291 51.3% Owner occupied276 48.7% Renter occupiedHouse owners and renters - White alone residents 3,174 62.8% Owner occupied1,878 37.2% Renter occupiedHouse owners and renters - Hispanic or Latino residents 420 67.7% Owner occupied201 32.3% Renter occupied
Language usage in Port Orchard
English speakers - Total 89.4% of residents of Port Orchard speak English at home.
4.6% of residents speak Spanish at home 430 62.9% Speak English very well254 37.1% Speak English less than very well6.0% of residents speak other language at home 612 69.6% Speak English very well267 30.4% Speak English less than very well
English speakers - Born in the United States 94.6% of residents of Port Orchard speak English at home.
3.2% of residents speak Spanish at home 179 77.8% Speak English very well51 22.2% Speak English less than very well2.1% of residents speak other language at home 131 87.9% Speak English very well18 12.1% Speak English less than very well
English speakers - Native, born elsewhere 78.2% of residents of Port Orchard speak English at home.
1.1% of residents speak Spanish at home 4 100.0% Speak English very well22.9% of residents speak other language at home 86 100.0% Speak English very well
English speakers - Foreign-born 24.9% of residents of Port Orchard speak English at home.
34.1% of residents speak Spanish at home 220 48.1% Speak English very well237 51.9% Speak English less than very well40.9% of residents speak other language at home 353 64.3% Speak English very well196 35.7% Speak English less than very well
White (Caucasian) - Speak only English Native:
98.8% (10,143)Foreign-born:
41.8% (119)
White (Caucasian) - Speak another language Native:
1.2% (124)Foreign-born:
60.6% (173)
Black or African American - Speak only English Native:
100.0% (231)Foreign-born:
100.0% (40)
Asian - Speak only English Native:
62.7% (201)Foreign-born:
22.5% (116)
Asian - Speak another language Native:
29.3% (94)Foreign-born:
77.3% (398)
Native Hawaiian / Pacific Islander - Speak another language Native:
26.4% (79)Foreign-born:
96.0% (8)
Other race - Speak another language Native:
63.0% (141)Foreign-born:
100.0% (185)
Two or more races - Speak only English Native:
95.3% (2,076)Foreign-born:
22.5% (86)
Two or more races - Speak another language Native:
5.1% (110)Foreign-born:
78.7% (300)
White alone - Speak only English Native:
99.3% (9,918)Foreign-born:
52.7% (119)
White alone - Speak another language Native:
0.7% (67)Foreign-born:
43.9% (99)
Hispanic or Latino - Speak another language Native:
26.1% (334)Foreign-born:
100.0% (508)
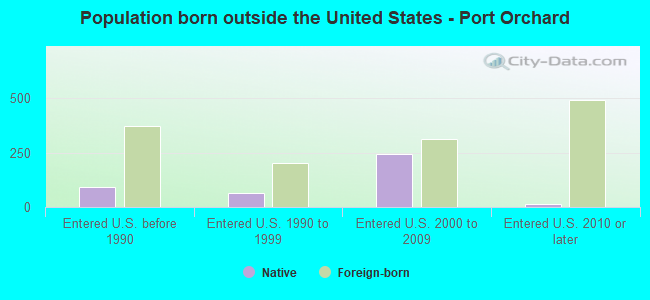
Foreign-born residents in Port Orchard 1,255 residents are foreign born (3.9% Asia , 2.2% Latin America , 1.1% Europe ).
This city:
7.9%Washington:
14.9%
Marital status for residents in Port Orchard Marital status - White (Caucasian) population 15 years and over
Males 27.9% Never married62.0% Now married0.3% Separated2.2% Widowed7.6% DivorcedFemales 13.9% Never married55.7% Now married2.2% Separated10.7% Widowed17.4% DivorcedWomen who gave birth in the past 12 months Now married:
86.2% (104)Unmarried:
13.8% (17)
Women who did not give birth in the past 12 months Now married:
60.3% (1,494)Unmarried:
39.7% (982)
Marital status - Black or African American population 15 years and over
Males 36.1% Never married36.1% Now married0.0% Separated27.7% Widowed0.0% DivorcedFemales 0.0% Never married60.9% Now married0.0% Separated0.0% Widowed39.1% DivorcedWomen who did not give birth in the past 12 months Now married:
60.9% (42)Unmarried:
39.1% (27)
Marital status - American Indian / Alaska Native population 15 years and over
Males 64.4% Never married15.3% Now married0.0% Separated0.0% Widowed20.3% DivorcedFemales 0.0% Never married100.0% Now married0.0% Separated0.0% Widowed0.0% DivorcedWomen who did not give birth in the past 12 months Now married:
100.0% (26)Unmarried:
0.0% (0)
Marital status - Asian population 15 years and over
Males 16.0% Never married65.3% Now married0.0% Separated0.0% Widowed18.7% DivorcedFemales 4.1% Never married83.4% Now married2.8% Separated5.4% Widowed4.3% DivorcedWomen who did not give birth in the past 12 months Now married:
91.0% (176)Unmarried:
9.0% (17)
Marital status - Native Hawaiian / Pacific Islander population 15 years and over
Males 29.8% Never married9.7% Now married2.4% Separated0.0% Widowed58.1% DivorcedFemales 17.6% Never married44.6% Now married0.0% Separated37.8% Widowed0.0% DivorcedWomen who gave birth in the past 12 months Now married:
88.9% (26)Unmarried:
11.1% (3)
Women who did not give birth in the past 12 months Now married:
47.4% (10)Unmarried:
52.6% (11)
Marital status - Other race population 15 years and over
Males 53.6% Never married46.4% Now married0.0% Separated0.0% Widowed0.0% DivorcedFemales 30.2% Never married57.9% Now married0.0% Separated0.0% Widowed11.9% DivorcedWomen who did not give birth in the past 12 months Now married:
57.9% (86)Unmarried:
42.1% (62)
Marital status - Two or more races population 15 years and over
Males 32.3% Never married60.2% Now married2.2% Separated0.0% Widowed5.3% DivorcedFemales 41.0% Never married41.2% Now married9.7% Separated0.0% Widowed8.1% DivorcedWomen who gave birth in the past 12 months Now married:
0.0% (0)Unmarried:
100.0% (25)
Women who did not give birth in the past 12 months Now married:
47.5% (283)Unmarried:
52.5% (313)
Marital status - White alone, not Hispanic / Latino population 15 years and over
Males 28.3% Never married61.2% Now married0.3% Separated2.3% Widowed7.9% DivorcedFemales 14.1% Never married55.7% Now married2.3% Separated10.9% Widowed17.0% DivorcedWomen who gave birth in the past 12 months Now married:
84.1% (89)Unmarried:
15.9% (17)
Women who did not give birth in the past 12 months Now married:
60.1% (1,469)Unmarried:
39.9% (976)
Marital status - Hispanic or Latino population 15 years and over
Males 17.8% Never married76.6% Now married0.0% Separated0.0% Widowed5.7% DivorcedFemales 25.7% Never married58.7% Now married0.0% Separated0.0% Widowed15.6% DivorcedWomen who gave birth in the past 12 months Now married:
100.0% (16)Unmarried:
0.0% (0)
Women who did not give birth in the past 12 months Now married:
61.3% (253)Unmarried:
38.7% (160)
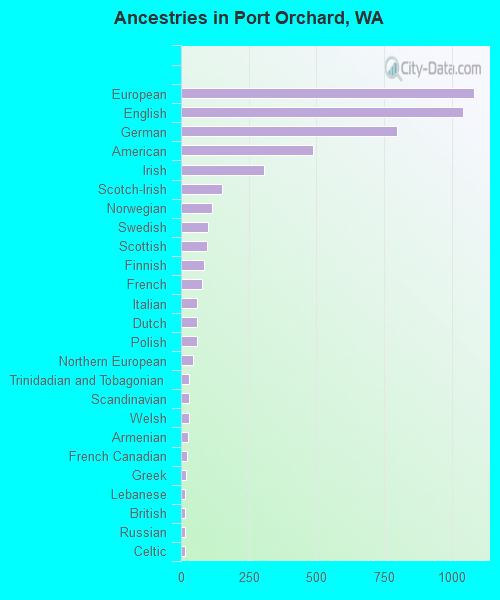
Ancestries in Port Orchard
1,083 14.6% European1,043 14.0% English796 10.7% German489 6.6% American307 4.1% Irish152 2.0% Scotch-Irish115 1.5% Norwegian101 1.4% Swedish97 1.3% Scottish85 1.1% Finnish78 1.0% French60 0.8% Italian58 0.8% Dutch58 0.8% Polish45 0.6% Northern European30 0.4% Trinidadian and Tobagonian29 0.4% Scandinavian28 0.4% Welsh24 0.3% Armenian22 0.3% French Canadian19 0.3% Greek16 0.2% Lebanese14 0.2% British14 0.2% Russian13 0.2% Celtic11 0.1% Czech8 0.1% Swiss
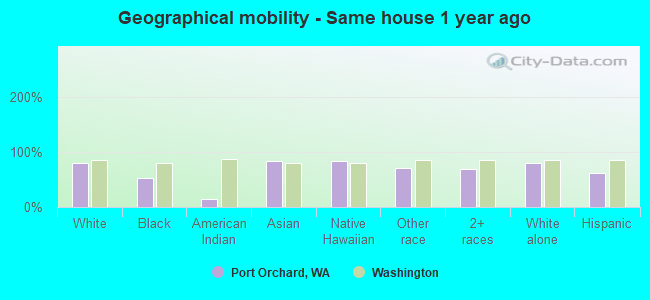
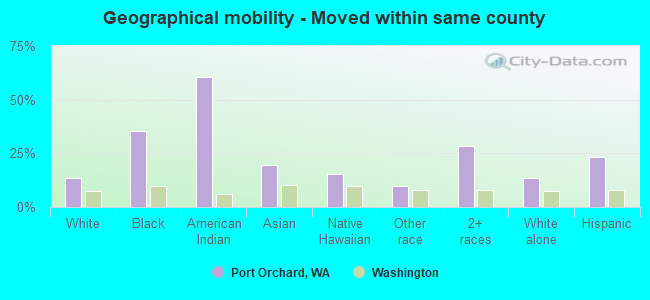
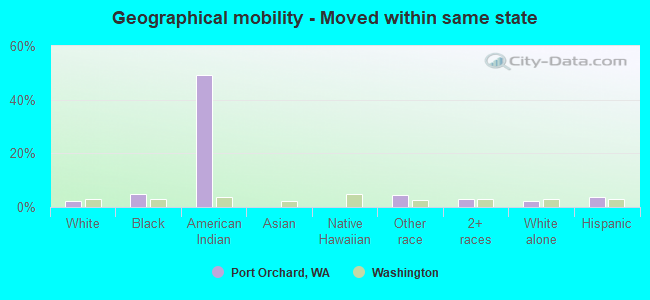
Geographical mobility in Port Orchard Same house 1 year ago 8,953 80.2% White (Caucasian)158 52.0% Black or African American10 14.7% American Indian / Alaska Native780 84.6% Asian266 84.3% Native Hawaiian / Pacific Islander283 70.4% Other race1,969 69.3% Two or more races8,687 80.8% White alone, not Hispanic / Latino1,261 62.9% Hispanic or LatinoMoved within same county 1,513 13.6% White / Caucasian108 35.4% Black or African American41 60.7% American Indian / Alaska Native179 19.4% Asian49 15.6% Native Hawaiian / Pacific Islander39 9.7% Other race801 28.2% Two or more races1,431 13.3% White alone, not Hispanic / Latino466 23.3% Hispanic or LatinoMoved within same state 254 2.3% White / Caucasian14 4.8% Black or African American33 49.0% American Indian / Alaska Native18 4.4% Other race84 3.0% Two or more races231 2.1% White alone, not Hispanic / Latino77 3.8% Hispanic or LatinoMoved from different state 441 4.0% White / Caucasian9 13.4% American Indian / Alaska Native58 14.5% Other race67 2.4% Two or more races416 3.9% White alone, not Hispanic / Latino106 5.3% Hispanic or LatinoMoved from abroad 85 0.8% White21 2.3% Asian86 0.8% White alone, not Hispanic / Latino
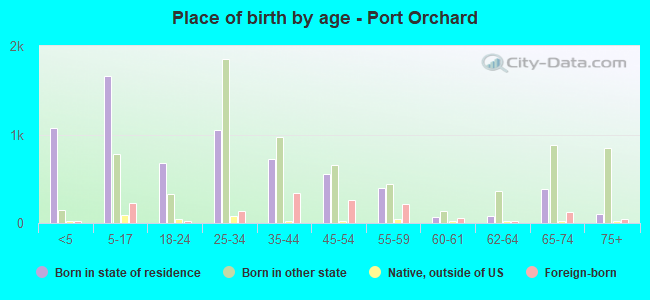
Children Nativity (place of birth) in Port Orchard
Children under 6 years - Living with two parents Both parents native 594 100.0% NativeBoth parents foreign-born 26 45.1% Native32 54.9% Foreign-bornOne native, one foreign-born parent 113 100.0% NativeChildren under 6 years - Living with one parent Native parent 692 100.0% NativeForeign-born parent 9 100.0% NativeChildren 6 to 17 years - Living with two parents Both parents native 1,046 100.0% NativeBoth parents foreign-born 88 50.0% Native88 50.0% Foreign-bornOne native, one foreign-born parent 250 100.0% NativeChildren 6 to 17 years - Living with one parent Native parent 799 86.2% Native128 13.8% Foreign-bornForeign-born parent 84 100.0% Native
Grandparents responsible for own grandchildren in Port Orchard
Grandparents (30 to 59 years) White / Caucasian 33 21.0% Responsible for grandchildren126 79.0% Not responsible for grandchildrenNative Hawaiian / Pacific Islander 2 100.0% Not responsible for grandchildrenTwo or more races 34 100.0% Responsible for grandchildrenWhite alone, not Hispanic / Latino 35 20.7% Responsible for grandchildren133 79.3% Not responsible for grandchildrenGrandparents (60 years and over) White / Caucasian 24 68.6% Responsible for grandchildren11 31.4% Not responsible for grandchildrenTwo or more races 3 100.0% Not responsible for grandchildrenWhite alone, not Hispanic / Latino 24 69.1% Responsible for grandchildren11 30.9% Not responsible for grandchildren