Races in Port Washington, New York (NY) Detailed Stats
Data:
Races - White alone (%)
Races - White alone (% change since 2000)
Races - Black alone (%)
Races - Black alone (% change since 2000)
Races - American Indian alone (%)
Races - American Indian alone (% change since 2000)
Races - Asian alone (%)
Races - Asian alone (% change since 2000)
Races - Hispanic (%)
Races - Hispanic (% change since 2000)
Races - Native Hawaiian and Other Pacific Islander alone (%)
Races - Native Hawaiian and Other Pacific Islander alone (% change since 2000)
Races - Two or more races(%)
Races - Two or more races(% change since 2000)
Races - Other race alone (%)
Races - Other race alone (% change since 2000)
Racial diversity
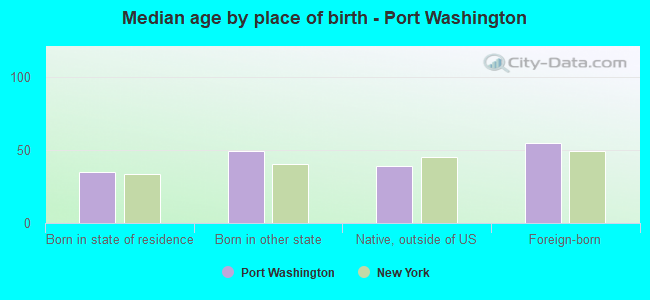
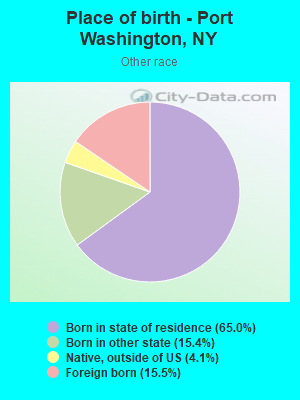
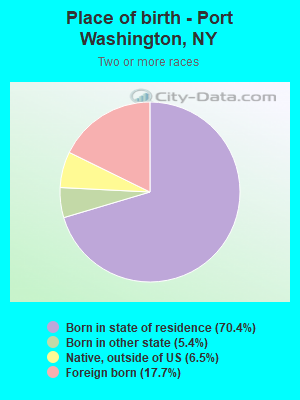
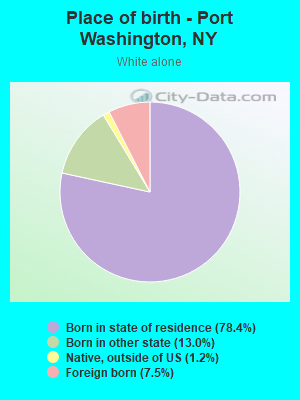
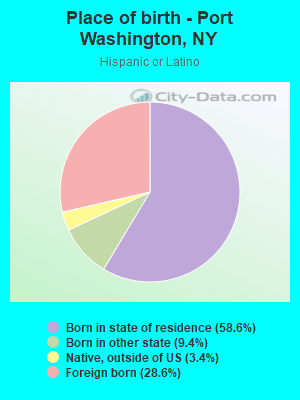
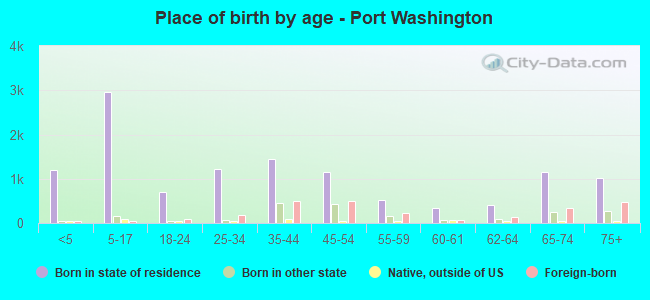
Place of birth - Born in state of residence (%)
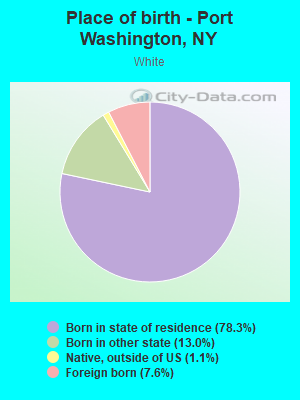
Place of birth - Born in state of residence (%) - White
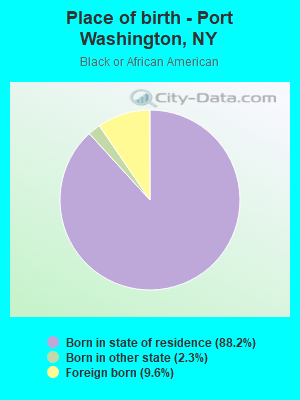
Place of birth - Born in state of residence (%) - Black or African American
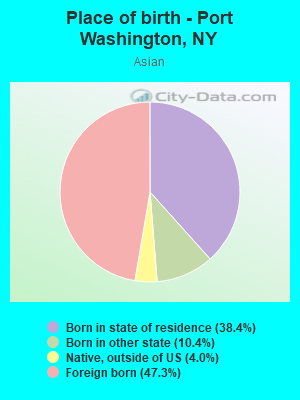
Place of birth - Born in state of residence (%) - Asian
Place of birth - Born in state of residence (%) - Hispanic or Latino
Place of birth - Born in state of residence (%) - American Indian and Alaska Native
Place of birth - Born in state of residence (%) - Multirace
Place of birth - Born in state of residence (%) - Other Race
Place of birth - Born in other state (%)
Place of birth - Born in other state (%) - White
Place of birth - Born in other state (%) - Black or African American
Place of birth - Born in other state (%) - Asian
Place of birth - Born in other state (%) - Hispanic or Latino
Place of birth - Born in other state (%) - American Indian and Alaska Native
Place of birth - Born in other state (%) - Multirace
Place of birth - Born in other state (%) - Other Race
Place of birth - Native, outside of US (%)
Place of birth - Native, outside of US (%) - White
Place of birth - Native, outside of US (%) - Black or African American
Place of birth - Native, outside of US (%) - Asian
Place of birth - Native, outside of US (%) - Hispanic or Latino
Place of birth - Native, outside of US (%) - American Indian and Alaska Native
Place of birth - Native, outside of US (%) - Multirace
Place of birth - Native, outside of US (%) - Other Race
Place of birth - Foreign born (%)
Place of birth - Foreign born (%) - White
Place of birth - Foreign born (%) - Black or African American
Place of birth - Foreign born (%) - Asian
Place of birth - Foreign born (%) - Hispanic or Latino
Place of birth - Foreign born (%) - American Indian and Alaska Native
Place of birth - Foreign born (%) - Multirace
Place of birth - Foreign born (%) - Other Race
Residents speaking English at home (%)
Residents speaking English at home - Born in the United States (%)
Residents speaking English at home - Native, born elsewhere (%)
Residents speaking English at home - Foreign born (%)
Residents speaking Spanish at home (%)
Residents speaking Spanish at home - Born in the United States (%)
Residents speaking Spanish at home - Native, born elsewhere (%)
Residents speaking Spanish at home - Foreign born (%)
Residents speaking other language at home (%)
Residents speaking other language at home - Born in the United States (%)
Residents speaking other language at home - Native, born elsewhere (%)
Residents speaking other language at home - Foreign born (%)
Marital status - Never married (%)
Marital status - Now married (%)
Marital status - Separated (%)
Marital status - Widowed (%)
Marital status - Divorced (%)
Ancestries Reported - Arab (%)
Ancestries Reported - Czech (%)
Ancestries Reported - Danish (%)
Ancestries Reported - Dutch (%)
Ancestries Reported - English (%)
Ancestries Reported - French (%)
Ancestries Reported - French Canadian (%)
Ancestries Reported - German (%)
Ancestries Reported - Greek (%)
Ancestries Reported - Hungarian (%)
Ancestries Reported - Irish (%)
Ancestries Reported - Italian (%)
Ancestries Reported - Lithuanian (%)
Ancestries Reported - Norwegian (%)
Ancestries Reported - Polish (%)
Ancestries Reported - Portuguese (%)
Ancestries Reported - Russian (%)
Ancestries Reported - Scotch-Irish (%)
Ancestries Reported - Scottish (%)
Ancestries Reported - Slovak (%)
Ancestries Reported - Subsaharan African (%)
Ancestries Reported - Swedish (%)
Ancestries Reported - Swiss (%)
Ancestries Reported - Ukrainian (%)
Ancestries Reported - United States (%)
Ancestries Reported - Welsh (%)
Ancestries Reported - West Indian (%)
Ancestries Reported - Other (%)
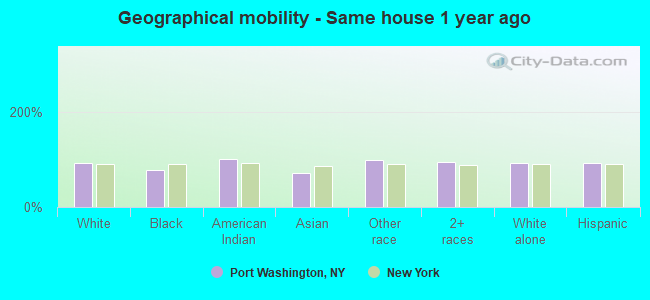
Geographical mobility - Same house 1 year ago (%)
Geographical mobility - Same house 1 year ago (%) - White
Geographical mobility - Same house 1 year ago (%) - Black or African American
Geographical mobility - Same house 1 year ago (%) - Asian
Geographical mobility - Same house 1 year ago (%) - Hispanic or Latino
Geographical mobility - Same house 1 year ago (%) - American Indian and Alaska Native
Geographical mobility - Same house 1 year ago (%) - Multirace
Geographical mobility - Same house 1 year ago (%) - Other Race
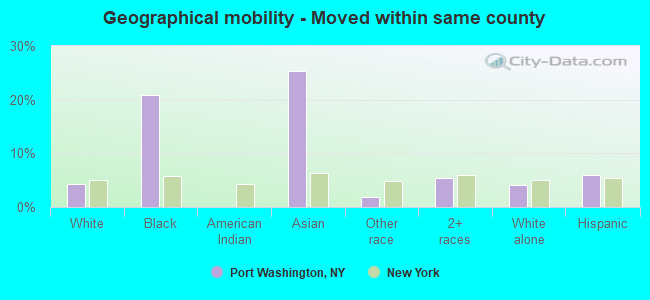
Geographical mobility - Moved within same county (%)
Geographical mobility - Moved within same county (%) - White
Geographical mobility - Moved within same county (%) - Black or African American
Geographical mobility - Moved within same county (%) - Asian
Geographical mobility - Moved within same county (%) - Hispanic or Latino
Geographical mobility - Moved within same county (%) - American Indian and Alaska Native
Geographical mobility - Moved within same county (%) - Multirace
Geographical mobility - Moved within same county (%) - Other Race
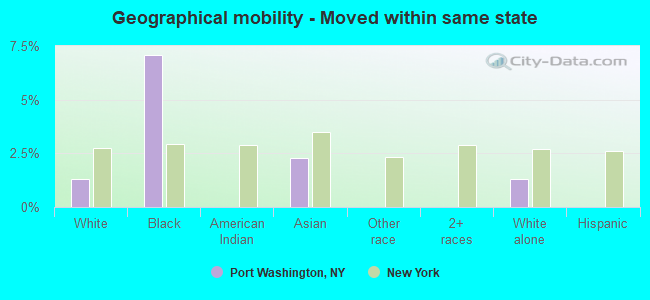
Geographical mobility - Moved from different county within same state (%)
Geographical mobility - Moved from different county within same state (%) - White
Geographical mobility - Moved from different county within same state (%) - Black or African American
Geographical mobility - Moved from different county within same state (%) - Asian
Geographical mobility - Moved from different county within same state (%) - Hispanic or Latino
Geographical mobility - Moved from different county within same state (%) - American Indian and Alaska Native
Geographical mobility - Moved from different county within same state (%) - Multirace
Geographical mobility - Moved from different county within same state (%) - Other Race
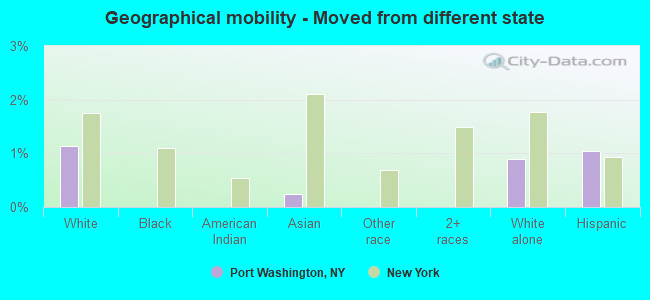
Geographical mobility - Moved from different state (%)
Geographical mobility - Moved from different state (%) - White
Geographical mobility - Moved from different state (%) - Black or African American
Geographical mobility - Moved from different state (%) - Asian
Geographical mobility - Moved from different state (%) - Hispanic or Latino
Geographical mobility - Moved from different state (%) - American Indian and Alaska Native
Geographical mobility - Moved from different state (%) - Multirace
Geographical mobility - Moved from different state (%) - Other Race
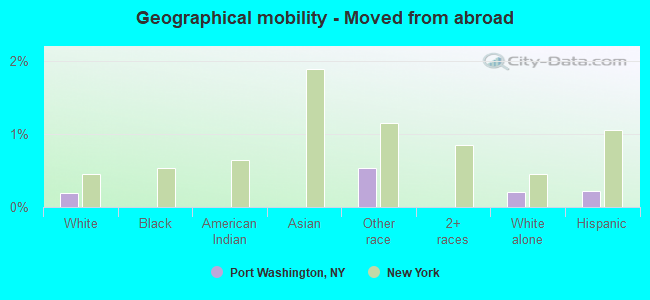
Geographical mobility - Moved from abroad (%)
Geographical mobility - Moved from abroad (%) - White
Geographical mobility - Moved from abroad (%) - Black or African American
Geographical mobility - Moved from abroad (%) - Asian
Geographical mobility - Moved from abroad (%) - Hispanic or Latino
Geographical mobility - Moved from abroad (%) - American Indian and Alaska Native
Geographical mobility - Moved from abroad (%) - Multirace
Geographical mobility - Moved from abroad (%) - Other Race
Place of birth for the foreign-born population - Ireland (%)
Place of birth for the foreign-born population - Denmark (%)
Place of birth for the foreign-born population - Norway (%)
Place of birth for the foreign-born population - Sweden (%)
Place of birth for the foreign-born population - United Kingdom (%)
Place of birth for the foreign-born population - England (%)
Place of birth for the foreign-born population - Scotland (%)
Place of birth for the foreign-born population - Other Northern Europe (%)
Place of birth for the foreign-born population - Austria (%)
Place of birth for the foreign-born population - Belgium (%)
Place of birth for the foreign-born population - France (%)
Place of birth for the foreign-born population - Germany (%)
Place of birth for the foreign-born population - Netherlands (%)
Place of birth for the foreign-born population - Switzerland (%)
Place of birth for the foreign-born population - Other Western Europe (%)
Place of birth for the foreign-born population - Greece (%)
Place of birth for the foreign-born population - Italy (%)
Place of birth for the foreign-born population - Portugal (%)
Place of birth for the foreign-born population - Spain (%)
Place of birth for the foreign-born population - Other Southern Europe (%)
Place of birth for the foreign-born population - Albania (%)
Place of birth for the foreign-born population - Belarus (%)
Place of birth for the foreign-born population - Bosnia and Herzegovina (%)
Place of birth for the foreign-born population - Bulgaria (%)
Place of birth for the foreign-born population - Croatia (%)
Place of birth for the foreign-born population - Czechoslovakia (%)
Place of birth for the foreign-born population - Hungary (%)
Place of birth for the foreign-born population - Latvia (%)
Place of birth for the foreign-born population - Lithuania (%)
Place of birth for the foreign-born population - North Macedonia (Macedonia) (%)
Place of birth for the foreign-born population - Moldova (%)
Place of birth for the foreign-born population - Poland (%)
Place of birth for the foreign-born population - Romania (%)
Place of birth for the foreign-born population - Russia (%)
Place of birth for the foreign-born population - Serbia (%)
Place of birth for the foreign-born population - Ukraine (%)
Place of birth for the foreign-born population - Other Eastern Europe (%)
Place of birth for the foreign-born population - China (%)
Place of birth for the foreign-born population - Hong Kong (%)
Place of birth for the foreign-born population - Taiwan (%)
Place of birth for the foreign-born population - Japan (%)
Place of birth for the foreign-born population - Korea (%)
Place of birth for the foreign-born population - Other Eastern Asia (%)
Place of birth for the foreign-born population - Afghanistan (%)
Place of birth for the foreign-born population - Bangladesh (%)
Place of birth for the foreign-born population - India (%)
Place of birth for the foreign-born population - Iran (%)
Place of birth for the foreign-born population - Kazakhstan (%)
Place of birth for the foreign-born population - Nepal (%)
Place of birth for the foreign-born population - Pakistan (%)
Place of birth for the foreign-born population - Sri Lanka (%)
Place of birth for the foreign-born population - Uzbekistan (%)
Place of birth for the foreign-born population - Other South Central Asia (%)
Place of birth for the foreign-born population - Burma (%)
Place of birth for the foreign-born population - Cambodia (%)
Place of birth for the foreign-born population - Indonesia (%)
Place of birth for the foreign-born population - Laos (%)
Place of birth for the foreign-born population - Malaysia (%)
Place of birth for the foreign-born population - Philippines (%)
Place of birth for the foreign-born population - Singapore (%)
Place of birth for the foreign-born population - Thailand (%)
Place of birth for the foreign-born population - Vietnam (%)
Place of birth for the foreign-born population - Other South Eastern Asia (%)
Place of birth for the foreign-born population - Armenia (%)
Place of birth for the foreign-born population - Iraq (%)
Place of birth for the foreign-born population - Israel (%)
Place of birth for the foreign-born population - Jordan (%)
Place of birth for the foreign-born population - Kuwait (%)
Place of birth for the foreign-born population - Lebanon (%)
Place of birth for the foreign-born population - Saudi Arabia (%)
Place of birth for the foreign-born population - Syria (%)
Place of birth for the foreign-born population - Turkey (%)
Place of birth for the foreign-born population - Yemen (%)
Place of birth for the foreign-born population - Other Western Asia (%)
Place of birth for the foreign-born population - Eritrea (%)
Place of birth for the foreign-born population - Ethiopia (%)
Place of birth for the foreign-born population - Kenya (%)
Place of birth for the foreign-born population - Somalia (%)
Place of birth for the foreign-born population - Uganda (%)
Place of birth for the foreign-born population - Zimbabwe (%)
Place of birth for the foreign-born population - Other Eastern Africa (%)
Place of birth for the foreign-born population - Cameroon (%)
Place of birth for the foreign-born population - Congo (%)
Place of birth for the foreign-born population - Democratic Republic of Congo (Zaire) (%)
Place of birth for the foreign-born population - Other Middle Africa (%)
Place of birth for the foreign-born population - Egypt (%)
Place of birth for the foreign-born population - Morocco (%)
Place of birth for the foreign-born population - Sudan (%)
Place of birth for the foreign-born population - Other Northern Africa (%)
Place of birth for the foreign-born population - South Africa (%)
Place of birth for the foreign-born population - Other Southern Africa (%)
Place of birth for the foreign-born population - Cabo Verde (%)
Place of birth for the foreign-born population - Ghana (%)
Place of birth for the foreign-born population - Liberia (%)
Place of birth for the foreign-born population - Nigeria (%)
Place of birth for the foreign-born population - Senegal (%)
Place of birth for the foreign-born population - Sierra Leone (%)
Place of birth for the foreign-born population - Other Western Africa (%)
Place of birth for the foreign-born population - Australia (%)
Place of birth for the foreign-born population - New Zealand (%)
Place of birth for the foreign-born population - Fiji (%)
Place of birth for the foreign-born population - Micronesia (%)
Place of birth for the foreign-born population - Bahamas (%)
Place of birth for the foreign-born population - Barbados (%)
Place of birth for the foreign-born population - Cuba (%)
Place of birth for the foreign-born population - Dominica (%)
Place of birth for the foreign-born population - Dominican Republic (%)
Place of birth for the foreign-born population - Grenada (%)
Place of birth for the foreign-born population - Haiti (%)
Place of birth for the foreign-born population - Jamaica (%)
Place of birth for the foreign-born population - St. Vincent and the Grenadines (%)
Place of birth for the foreign-born population - Trinidad and Tobago (%)
Place of birth for the foreign-born population - West Indies (%)
Place of birth for the foreign-born population - Other Caribbean (%)
Place of birth for the foreign-born population - Belize (%)
Place of birth for the foreign-born population - Costa Rica (%)
Place of birth for the foreign-born population - El Salvador (%)
Place of birth for the foreign-born population - Guatemala (%)
Place of birth for the foreign-born population - Honduras (%)
Place of birth for the foreign-born population - Mexico (%)
Place of birth for the foreign-born population - Nicaragua (%)
Place of birth for the foreign-born population - Panama (%)
Place of birth for the foreign-born population - Other Central America (%)
Place of birth for the foreign-born population - Argentina (%)
Place of birth for the foreign-born population - Bolivia (%)
Place of birth for the foreign-born population - Brazil (%)
Place of birth for the foreign-born population - Chile (%)
Place of birth for the foreign-born population - Colombia (%)
Place of birth for the foreign-born population - Ecuador (%)
Place of birth for the foreign-born population - Guyana (%)
Place of birth for the foreign-born population - Peru (%)
Place of birth for the foreign-born population - Uruguay (%)
Place of birth for the foreign-born population - Venezuela (%)
Place of birth for the foreign-born population - Other South America (%)
Place of birth for the foreign-born population - Canada (%)
Place of birth for the foreign-born population - Other Northern America (%)
Place of birth for the foreign-born population - Other (%)
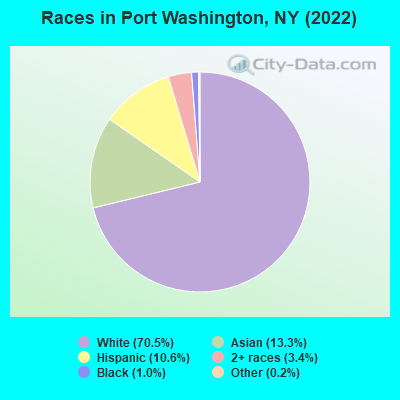
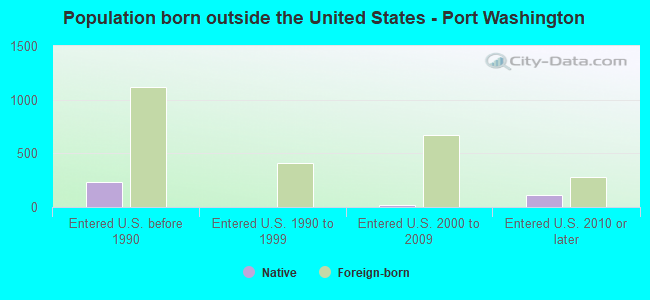
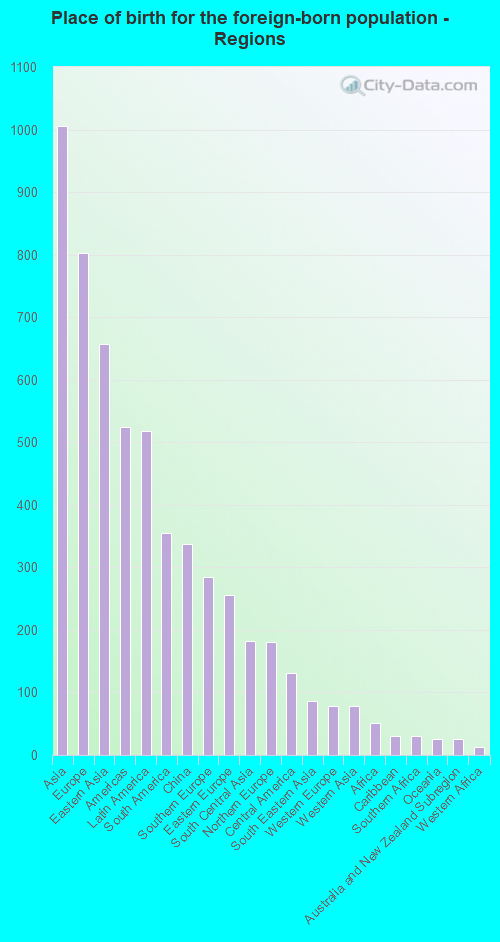
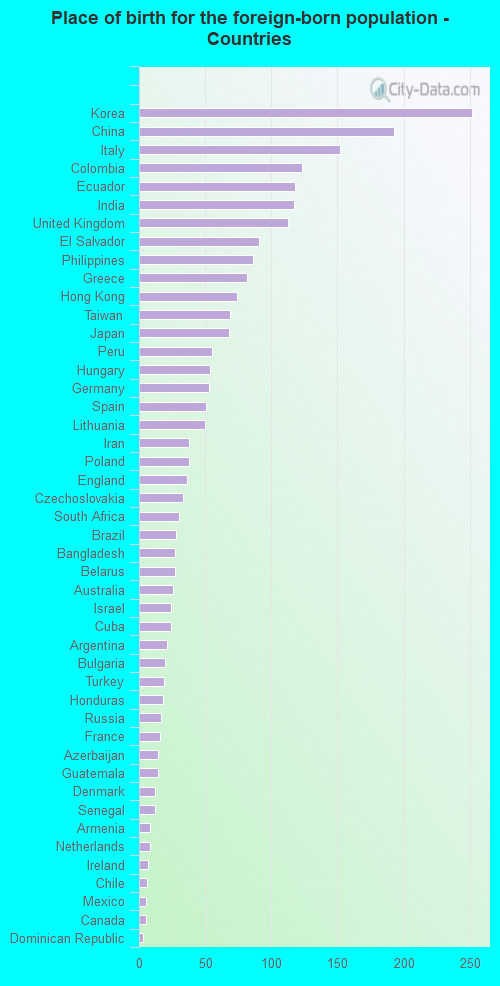
According to 2022 data, the most numerous races in Port Washington, NY are White alone (11,943 residents), Hispanic (1,801 residents), and Black alone (163 residents). 81.1% of Port Washington residents speak English at home. 14.2% of Port Washington, NY residents are foreign-born (6.0% born in Asia, 4.8% born in Europe, 3.1% born in Latin America), which is 54.6% less than the foreign-born rate of 22.0% across the entire state of New York.
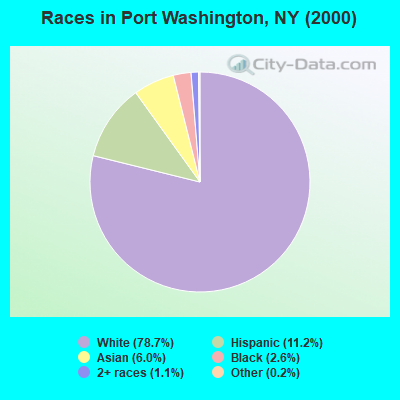
Race distribution in Port Washington
2000 2022
11,760,981 62.0% White alone 2,867,583 15.1% Hispanic 2,812,623 14.8% Black alone 1,035,926 5.5% Asian alone 366,116 1.9% Two or more races 75,499 0.4% Other race alone 52,499 0.3% American Indian alone 5,230 0.03% Native Hawaiian and Other
10,408,933 52.9% White alone 3,867,299 19.7% Hispanic 2,633,840 13.4% Black alone 1,776,286 9.0% Asian alone 732,670 3.7% Two or more races 216,110 1.1% Other race alone 35,082 0.2% American Indian alone 6,931 0.04% Native Hawaiian and Other
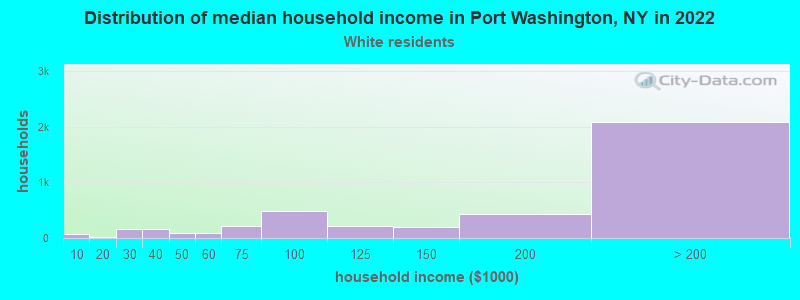
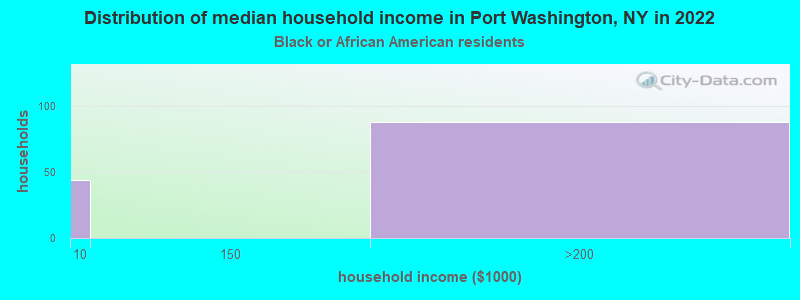
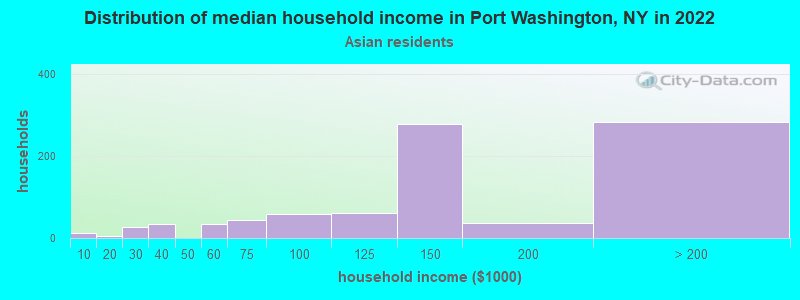
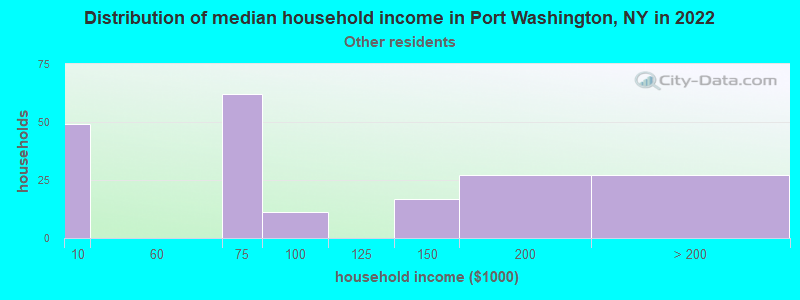
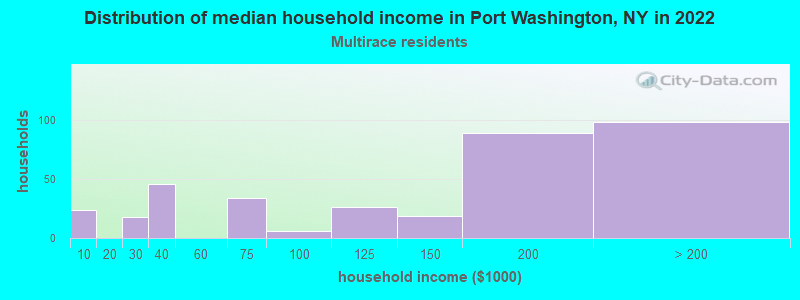
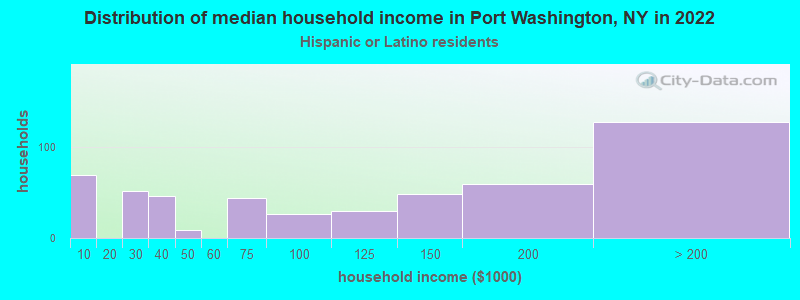
Income and house value in Port Washington Median household income in 2022 $196,635 White non-Hispanic householders$141,040 Asian householders$147,539 Two or more races householders$116,149 Hispanic or Latino race householdersMedian 2022 house value over $1,000,000 White Non-Hispanic householders$681,105 Black or African American householders over $1,000,000 Asian householders$537,715 Some other race householders$687,080 Two or more races householders$746,826 Hispanic or Latino householders
Median age by race in Port Washington
44.2 Median age for White residents41.1 49.1 38.2 Median age for Black or African American residents50.9 32.8 -855,158,729.3 Median age for American Indian / Alaska Native residents-607,543,322.5 -837,121,211.3 43.8 Median age for Asian residents44.3 49.3 -487,992,314.6 Median age for Native Hawaiian / Pacific Islander residents-477,502,295.2 -497,387,669.3 18.4 Median age for Other race residents32.5 17.5 17.3 Median age for Two or more races residents15.8 23.2 43.5 Median age for White alone residents40.3 48.1 32.1 Median age for Hispanic or Latino residents32.0 32.3
Owner/renter occupied households by race in Port Washington
House owners and renters - White residents 3,554 83.0% Owner occupied730 17.0% Renter occupiedHouse owners and renters - Black or African American residents 12 14.3% Owner occupied75 85.7% Renter occupiedHouse owners and renters - Asian residents 619 72.3% Owner occupied237 27.7% Renter occupiedHouse owners and renters - Other race residents 16 9.5% Owner occupied152 90.5% Renter occupiedHouse owners and renters - Two or more races residents 286 79.4% Owner occupied74 20.6% Renter occupiedHouse owners and renters - White alone residents 3,561 83.3% Owner occupied714 16.7% Renter occupiedHouse owners and renters - Hispanic or Latino residents 246 48.4% Owner occupied263 51.6% Renter occupied
Language usage in Port Washington
English speakers - Total 81.1% of residents of Port Washington speak English at home.
5.1% of residents speak Spanish at home 506 63.6% Speak English very well289 36.4% Speak English less than very well13.4% of residents speak other language at home 1,473 70.1% Speak English very well628 29.9% Speak English less than very well
English speakers - Born in the United States 88.6% of residents of Port Washington speak English at home.
3.9% of residents speak Spanish at home 77 100.0% Speak English very well6.8% of residents speak other language at home 86 64.7% Speak English very well47 35.3% Speak English less than very well
English speakers - Native, born elsewhere 86.4% of residents of Port Washington speak English at home.
1.2% of residents speak Spanish at home 4 100.0% Speak English less than very well9.4% of residents speak other language at home 31 100.0% Speak English very well
English speakers - Foreign-born 25.3% of residents of Port Washington speak English at home.
19.0% of residents speak Spanish at home 208 44.0% Speak English very well265 56.0% Speak English less than very well56.3% of residents speak other language at home 912 65.0% Speak English very well491 35.0% Speak English less than very well
White (Caucasian) - Speak only English Native:
97.5% (9,927)Foreign-born:
45.8% (414)
White (Caucasian) - Speak another language Native:
3.4% (342)Foreign-born:
57.8% (523)
Black or African American - Speak only English Native:
99.1% (146)Foreign-born:
99.0% (15)
Asian - Speak only English Native:
73.3% (765)Foreign-born:
13.9% (146)
Asian - Speak another language Native:
28.3% (295)Foreign-born:
85.7% (903)
Other race - Speak only English Native:
73.7% (428)Foreign-born:
2.2% (3)
Other race - Speak another language Native:
31.5% (183)Foreign-born:
99.3% (149)
Two or more races - Speak only English Native:
80.7% (838)Foreign-born:
16.5% (42)
Two or more races - Speak another language Native:
15.7% (163)Foreign-born:
83.8% (211)
White alone - Speak only English Native:
96.6% (9,915)Foreign-born:
46.3% (417)
White alone - Speak another language Native:
3.6% (365)Foreign-born:
53.3% (479)
Hispanic or Latino - Speak only English Native:
69.0% (708)Foreign-born:
7.2% (38)
Hispanic or Latino - Speak another language Native:
30.4% (312)Foreign-born:
92.8% (484)
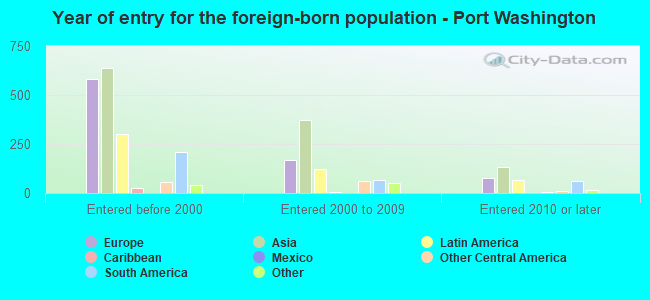
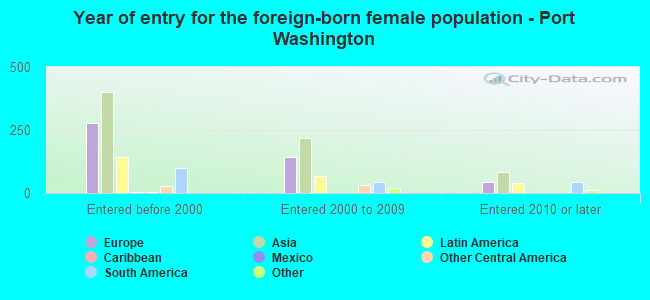
Foreign-born residents in Port Washington 2,412 residents are foreign born (6.0% Asia , 4.8% Europe , 3.1% Latin America ).
This city:
14.2%New York:
22.6%
Marital status for residents in Port Washington Marital status - White (Caucasian) population 15 years and over
Males 25.4% Never married68.8% Now married0.5% Separated1.6% Widowed3.7% DivorcedFemales 17.0% Never married65.0% Now married0.4% Separated11.0% Widowed6.6% DivorcedWomen who gave birth in the past 12 months Now married:
100.0% (206)Unmarried:
0.0% (0)
Women who did not give birth in the past 12 months Now married:
63.0% (1,118)Unmarried:
37.0% (658)
Marital status - Black or African American population 15 years and over
Males 44.3% Never married21.3% Now married0.0% Separated0.0% Widowed34.4% DivorcedFemales 85.1% Never married0.0% Now married0.0% Separated14.9% Widowed0.0% DivorcedWomen who did not give birth in the past 12 months Now married:
0.0% (0)Unmarried:
100.0% (62)
Marital status - Asian population 15 years and over
Males 17.5% Never married74.1% Now married2.7% Separated1.0% Widowed4.7% DivorcedFemales 19.7% Never married72.0% Now married0.0% Separated2.6% Widowed5.7% DivorcedWomen who gave birth in the past 12 months Now married:
100.0% (14)Unmarried:
0.0% (0)
Women who did not give birth in the past 12 months Now married:
68.3% (363)Unmarried:
31.7% (168)
Marital status - Other race population 15 years and over
Males 33.0% Never married60.5% Now married6.5% Separated0.0% Widowed0.0% DivorcedFemales 34.1% Never married45.5% Now married0.0% Separated1.8% Widowed18.6% DivorcedWomen who gave birth in the past 12 months Now married:
100.0% (11)Unmarried:
0.0% (0)
Women who did not give birth in the past 12 months Now married:
30.0% (55)Unmarried:
70.0% (127)
Marital status - Two or more races population 15 years and over
Males 46.7% Never married44.2% Now married6.2% Separated2.9% Widowed0.0% DivorcedFemales 21.3% Never married56.0% Now married6.7% Separated9.3% Widowed6.7% DivorcedWomen who gave birth in the past 12 months Now married:
100.0% (15)Unmarried:
0.0% (0)
Women who did not give birth in the past 12 months Now married:
60.2% (147)Unmarried:
39.8% (97)
Marital status - White alone, not Hispanic / Latino population 15 years and over
Males 24.9% Never married69.1% Now married0.5% Separated1.6% Widowed3.9% DivorcedFemales 16.8% Never married64.6% Now married0.5% Separated11.3% Widowed6.8% DivorcedWomen who gave birth in the past 12 months Now married:
100.0% (220)Unmarried:
0.0% (0)
Women who did not give birth in the past 12 months Now married:
62.8% (1,152)Unmarried:
37.2% (683)
Marital status - Hispanic or Latino population 15 years and over
Males 34.3% Never married62.0% Now married3.1% Separated0.6% Widowed0.0% DivorcedFemales 23.8% Never married61.5% Now married3.7% Separated0.7% Widowed10.3% DivorcedWomen who gave birth in the past 12 months Now married:
100.0% (20)Unmarried:
0.0% (0)
Women who did not give birth in the past 12 months Now married:
50.5% (155)Unmarried:
49.5% (152)
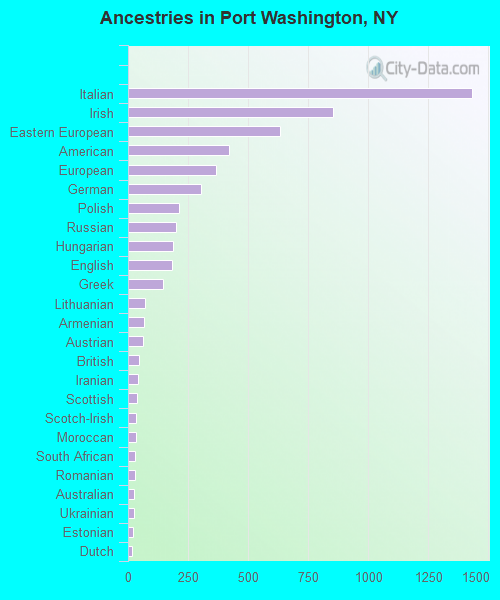
Ancestries in Port Washington
1,432 17.4% Italian855 10.4% Irish635 7.7% Eastern European422 5.1% American368 4.5% European302 3.7% German212 2.6% Polish202 2.5% Russian187 2.3% Hungarian184 2.2% English145 1.8% Greek70 0.9% Lithuanian67 0.8% Armenian64 0.8% Austrian46 0.6% British40 0.5% Iranian36 0.4% Scottish35 0.4% Scotch-Irish33 0.4% Moroccan31 0.4% South African28 0.3% Romanian26 0.3% Australian25 0.3% Ukrainian19 0.2% Estonian18 0.2% Dutch16 0.2% Slovak14 0.2% French13 0.2% Czech13 0.2% Senegalese12 0.1% Icelander11 0.1% Brazilian9 0.1% Bulgarian9 0.1% Danish9 0.1% Norwegian8 0.10% Latvian8 0.10% Serbian6 0.07% Cypriot3 0.04% Israeli2 0.02% Jamaican
Geographical mobility in Port Washington Same house 1 year ago 10,812 93.0% White (Caucasian)124 76.9% Black or African American5 100.0% American Indian / Alaska Native1,649 71.2% Asian890 98.1% Other race1,302 94.6% Two or more races10,996 93.3% White alone, not Hispanic / Latino1,609 92.6% Hispanic or LatinoMoved within same county 504 4.3% White / Caucasian34 20.9% Black or African American585 25.2% Asian16 1.8% Other race76 5.5% Two or more races492 4.2% White alone, not Hispanic / Latino103 5.9% Hispanic or LatinoMoved within same state 153 1.3% White / Caucasian11 7.1% Black or African American53 2.3% Asian156 1.3% White alone, not Hispanic / LatinoMoved from different state 132 1.1% White / Caucasian6 0.2% Asian105 0.9% White alone, not Hispanic / Latino18 1.0% Hispanic or LatinoMoved from abroad 23 0.2% White5 0.5% Other race24 0.2% White alone, not Hispanic / Latino4 0.2% Hispanic or Latino
Children Nativity (place of birth) in Port Washington
Children under 6 years - Living with two parents Both parents native 1,502 100.0% NativeBoth parents foreign-born 79 100.0% NativeOne native, one foreign-born parent 154 100.0% NativeChildren under 6 years - Living with one parent Native parent 40 100.0% NativeChildren 6 to 17 years - Living with two parents Both parents native 1,616 100.0% NativeBoth parents foreign-born 255 94.9% Native14 5.1% Foreign-bornOne native, one foreign-born parent 322 100.0% NativeChildren 6 to 17 years - Living with one parent Native parent 385 100.0% NativeForeign-born parent 85 50.0% Native85 50.0% Foreign-born
Grandparents responsible for own grandchildren in Port Washington
Grandparents (30 to 59 years) White / Caucasian 15 100.0% Responsible for grandchildrenWhite alone, not Hispanic / Latino 16 100.0% Responsible for grandchildrenGrandparents (60 years and over) White / Caucasian 8 11.2% Responsible for grandchildren61 88.8% Not responsible for grandchildrenWhite alone, not Hispanic / Latino 7 10.1% Responsible for grandchildren64 89.9% Not responsible for grandchildren