Races in Pottsville, Pennsylvania (PA) Detailed Stats
Data:
Races - White alone (%)
Races - White alone (% change since 2000)
Races - Black alone (%)
Races - Black alone (% change since 2000)
Races - American Indian alone (%)
Races - American Indian alone (% change since 2000)
Races - Asian alone (%)
Races - Asian alone (% change since 2000)
Races - Hispanic (%)
Races - Hispanic (% change since 2000)
Races - Native Hawaiian and Other Pacific Islander alone (%)
Races - Native Hawaiian and Other Pacific Islander alone (% change since 2000)
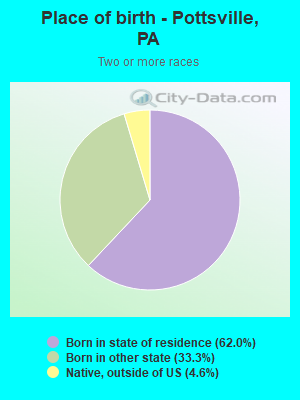
Races - Two or more races(%)
Races - Two or more races(% change since 2000)
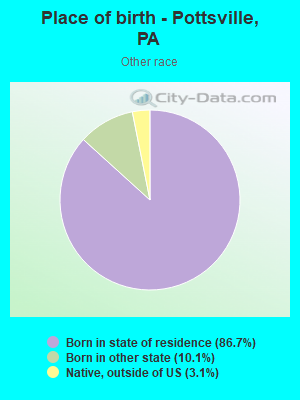
Races - Other race alone (%)
Races - Other race alone (% change since 2000)
Racial diversity
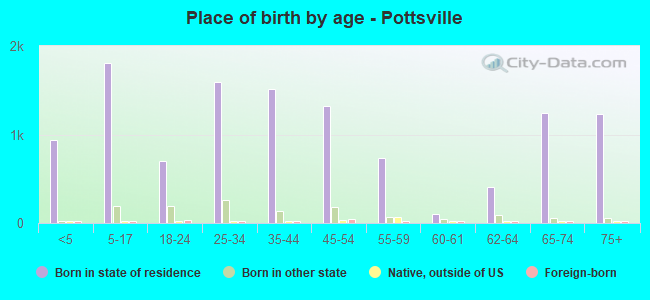
Place of birth - Born in state of residence (%)
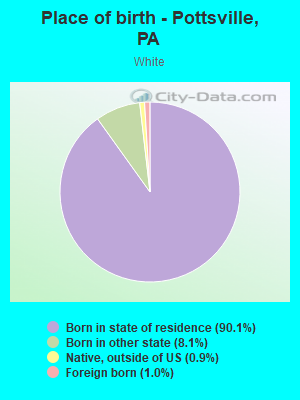
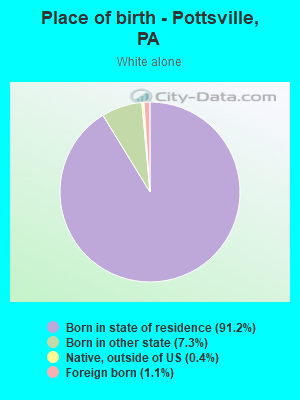
Place of birth - Born in state of residence (%) - White
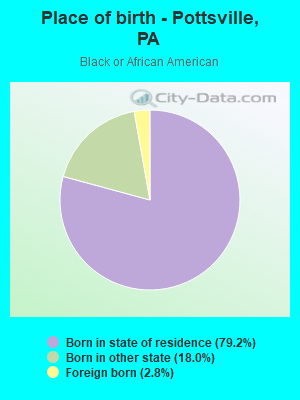
Place of birth - Born in state of residence (%) - Black or African American
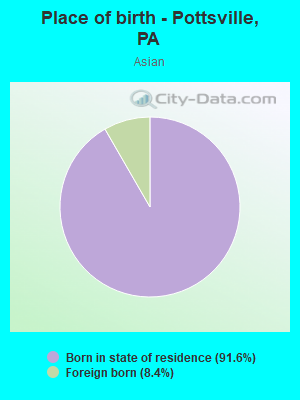
Place of birth - Born in state of residence (%) - Asian
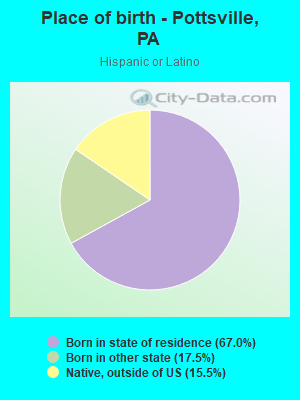
Place of birth - Born in state of residence (%) - Hispanic or Latino
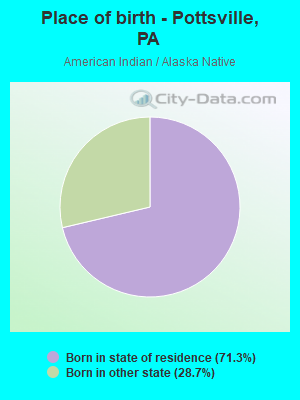
Place of birth - Born in state of residence (%) - American Indian and Alaska Native
Place of birth - Born in state of residence (%) - Multirace
Place of birth - Born in state of residence (%) - Other Race
Place of birth - Born in other state (%)
Place of birth - Born in other state (%) - White
Place of birth - Born in other state (%) - Black or African American
Place of birth - Born in other state (%) - Asian
Place of birth - Born in other state (%) - Hispanic or Latino
Place of birth - Born in other state (%) - American Indian and Alaska Native
Place of birth - Born in other state (%) - Multirace
Place of birth - Born in other state (%) - Other Race
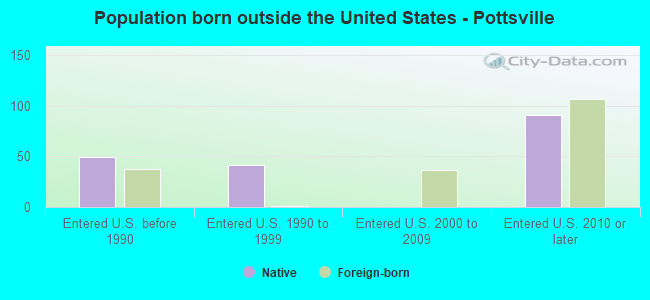
Place of birth - Native, outside of US (%)
Place of birth - Native, outside of US (%) - White
Place of birth - Native, outside of US (%) - Black or African American
Place of birth - Native, outside of US (%) - Asian
Place of birth - Native, outside of US (%) - Hispanic or Latino
Place of birth - Native, outside of US (%) - American Indian and Alaska Native
Place of birth - Native, outside of US (%) - Multirace
Place of birth - Native, outside of US (%) - Other Race
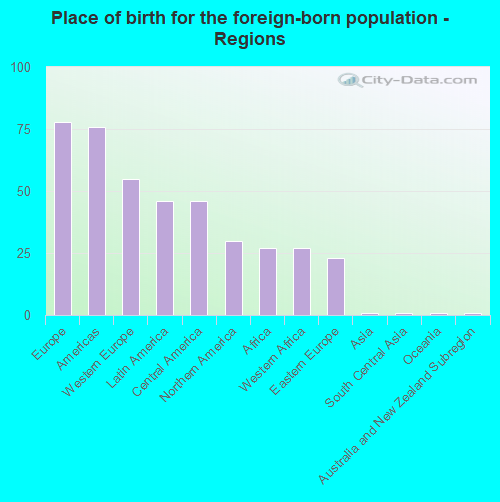
Place of birth - Foreign born (%)
Place of birth - Foreign born (%) - White
Place of birth - Foreign born (%) - Black or African American
Place of birth - Foreign born (%) - Asian
Place of birth - Foreign born (%) - Hispanic or Latino
Place of birth - Foreign born (%) - American Indian and Alaska Native
Place of birth - Foreign born (%) - Multirace
Place of birth - Foreign born (%) - Other Race
Residents speaking English at home (%)
Residents speaking English at home - Born in the United States (%)
Residents speaking English at home - Native, born elsewhere (%)
Residents speaking English at home - Foreign born (%)
Residents speaking Spanish at home (%)
Residents speaking Spanish at home - Born in the United States (%)
Residents speaking Spanish at home - Native, born elsewhere (%)
Residents speaking Spanish at home - Foreign born (%)
Residents speaking other language at home (%)
Residents speaking other language at home - Born in the United States (%)
Residents speaking other language at home - Native, born elsewhere (%)
Residents speaking other language at home - Foreign born (%)
Marital status - Never married (%)
Marital status - Now married (%)
Marital status - Separated (%)
Marital status - Widowed (%)
Marital status - Divorced (%)
Ancestries Reported - Arab (%)
Ancestries Reported - Czech (%)
Ancestries Reported - Danish (%)
Ancestries Reported - Dutch (%)
Ancestries Reported - English (%)
Ancestries Reported - French (%)
Ancestries Reported - French Canadian (%)
Ancestries Reported - German (%)
Ancestries Reported - Greek (%)
Ancestries Reported - Hungarian (%)
Ancestries Reported - Irish (%)
Ancestries Reported - Italian (%)
Ancestries Reported - Lithuanian (%)
Ancestries Reported - Norwegian (%)
Ancestries Reported - Polish (%)
Ancestries Reported - Portuguese (%)
Ancestries Reported - Russian (%)
Ancestries Reported - Scotch-Irish (%)
Ancestries Reported - Scottish (%)
Ancestries Reported - Slovak (%)
Ancestries Reported - Subsaharan African (%)
Ancestries Reported - Swedish (%)
Ancestries Reported - Swiss (%)
Ancestries Reported - Ukrainian (%)
Ancestries Reported - United States (%)
Ancestries Reported - Welsh (%)
Ancestries Reported - West Indian (%)
Ancestries Reported - Other (%)
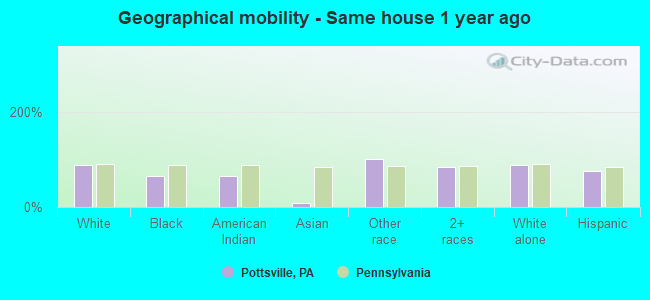
Geographical mobility - Same house 1 year ago (%)
Geographical mobility - Same house 1 year ago (%) - White
Geographical mobility - Same house 1 year ago (%) - Black or African American
Geographical mobility - Same house 1 year ago (%) - Asian
Geographical mobility - Same house 1 year ago (%) - Hispanic or Latino
Geographical mobility - Same house 1 year ago (%) - American Indian and Alaska Native
Geographical mobility - Same house 1 year ago (%) - Multirace
Geographical mobility - Same house 1 year ago (%) - Other Race
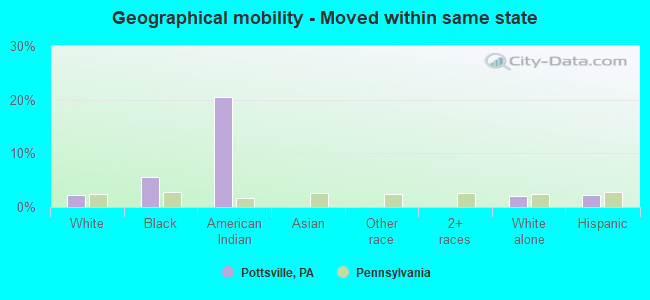
Geographical mobility - Moved within same county (%)
Geographical mobility - Moved within same county (%) - White
Geographical mobility - Moved within same county (%) - Black or African American
Geographical mobility - Moved within same county (%) - Asian
Geographical mobility - Moved within same county (%) - Hispanic or Latino
Geographical mobility - Moved within same county (%) - American Indian and Alaska Native
Geographical mobility - Moved within same county (%) - Multirace
Geographical mobility - Moved within same county (%) - Other Race
Geographical mobility - Moved from different county within same state (%)
Geographical mobility - Moved from different county within same state (%) - White
Geographical mobility - Moved from different county within same state (%) - Black or African American
Geographical mobility - Moved from different county within same state (%) - Asian
Geographical mobility - Moved from different county within same state (%) - Hispanic or Latino
Geographical mobility - Moved from different county within same state (%) - American Indian and Alaska Native
Geographical mobility - Moved from different county within same state (%) - Multirace
Geographical mobility - Moved from different county within same state (%) - Other Race
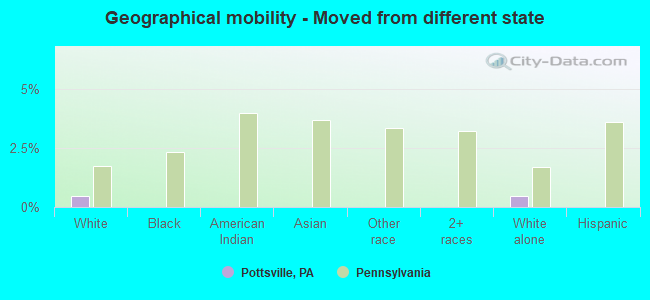
Geographical mobility - Moved from different state (%)
Geographical mobility - Moved from different state (%) - White
Geographical mobility - Moved from different state (%) - Black or African American
Geographical mobility - Moved from different state (%) - Asian
Geographical mobility - Moved from different state (%) - Hispanic or Latino
Geographical mobility - Moved from different state (%) - American Indian and Alaska Native
Geographical mobility - Moved from different state (%) - Multirace
Geographical mobility - Moved from different state (%) - Other Race
Geographical mobility - Moved from abroad (%)
Geographical mobility - Moved from abroad (%) - White
Geographical mobility - Moved from abroad (%) - Black or African American
Geographical mobility - Moved from abroad (%) - Asian
Geographical mobility - Moved from abroad (%) - Hispanic or Latino
Geographical mobility - Moved from abroad (%) - American Indian and Alaska Native
Geographical mobility - Moved from abroad (%) - Multirace
Geographical mobility - Moved from abroad (%) - Other Race
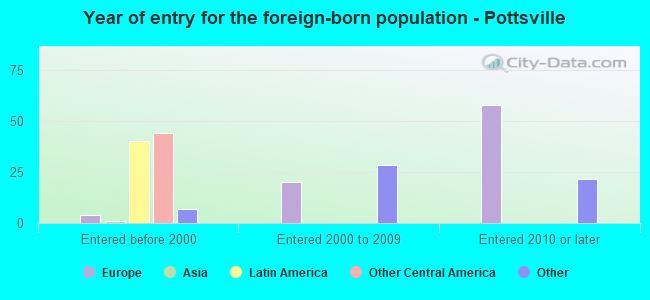
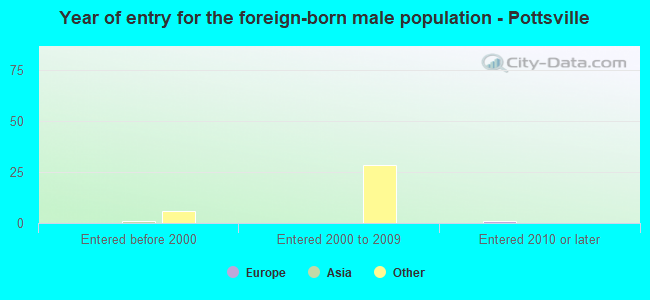
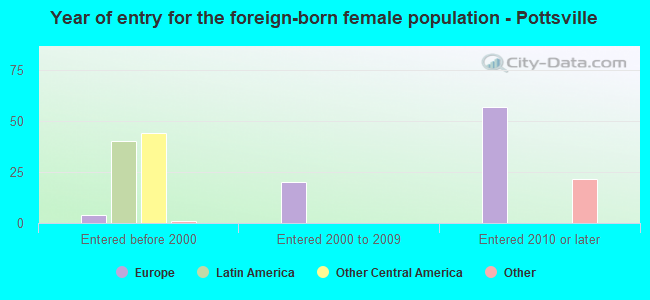
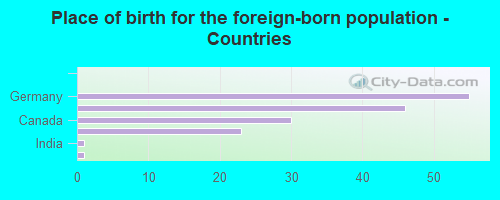
Place of birth for the foreign-born population - Ireland (%)
Place of birth for the foreign-born population - Denmark (%)
Place of birth for the foreign-born population - Norway (%)
Place of birth for the foreign-born population - Sweden (%)
Place of birth for the foreign-born population - United Kingdom (%)
Place of birth for the foreign-born population - England (%)
Place of birth for the foreign-born population - Scotland (%)
Place of birth for the foreign-born population - Other Northern Europe (%)
Place of birth for the foreign-born population - Austria (%)
Place of birth for the foreign-born population - Belgium (%)
Place of birth for the foreign-born population - France (%)
Place of birth for the foreign-born population - Germany (%)
Place of birth for the foreign-born population - Netherlands (%)
Place of birth for the foreign-born population - Switzerland (%)
Place of birth for the foreign-born population - Other Western Europe (%)
Place of birth for the foreign-born population - Greece (%)
Place of birth for the foreign-born population - Italy (%)
Place of birth for the foreign-born population - Portugal (%)
Place of birth for the foreign-born population - Spain (%)
Place of birth for the foreign-born population - Other Southern Europe (%)
Place of birth for the foreign-born population - Albania (%)
Place of birth for the foreign-born population - Belarus (%)
Place of birth for the foreign-born population - Bosnia and Herzegovina (%)
Place of birth for the foreign-born population - Bulgaria (%)
Place of birth for the foreign-born population - Croatia (%)
Place of birth for the foreign-born population - Czechoslovakia (%)
Place of birth for the foreign-born population - Hungary (%)
Place of birth for the foreign-born population - Latvia (%)
Place of birth for the foreign-born population - Lithuania (%)
Place of birth for the foreign-born population - North Macedonia (Macedonia) (%)
Place of birth for the foreign-born population - Moldova (%)
Place of birth for the foreign-born population - Poland (%)
Place of birth for the foreign-born population - Romania (%)
Place of birth for the foreign-born population - Russia (%)
Place of birth for the foreign-born population - Serbia (%)
Place of birth for the foreign-born population - Ukraine (%)
Place of birth for the foreign-born population - Other Eastern Europe (%)
Place of birth for the foreign-born population - China (%)
Place of birth for the foreign-born population - Hong Kong (%)
Place of birth for the foreign-born population - Taiwan (%)
Place of birth for the foreign-born population - Japan (%)
Place of birth for the foreign-born population - Korea (%)
Place of birth for the foreign-born population - Other Eastern Asia (%)
Place of birth for the foreign-born population - Afghanistan (%)
Place of birth for the foreign-born population - Bangladesh (%)
Place of birth for the foreign-born population - India (%)
Place of birth for the foreign-born population - Iran (%)
Place of birth for the foreign-born population - Kazakhstan (%)
Place of birth for the foreign-born population - Nepal (%)
Place of birth for the foreign-born population - Pakistan (%)
Place of birth for the foreign-born population - Sri Lanka (%)
Place of birth for the foreign-born population - Uzbekistan (%)
Place of birth for the foreign-born population - Other South Central Asia (%)
Place of birth for the foreign-born population - Burma (%)
Place of birth for the foreign-born population - Cambodia (%)
Place of birth for the foreign-born population - Indonesia (%)
Place of birth for the foreign-born population - Laos (%)
Place of birth for the foreign-born population - Malaysia (%)
Place of birth for the foreign-born population - Philippines (%)
Place of birth for the foreign-born population - Singapore (%)
Place of birth for the foreign-born population - Thailand (%)
Place of birth for the foreign-born population - Vietnam (%)
Place of birth for the foreign-born population - Other South Eastern Asia (%)
Place of birth for the foreign-born population - Armenia (%)
Place of birth for the foreign-born population - Iraq (%)
Place of birth for the foreign-born population - Israel (%)
Place of birth for the foreign-born population - Jordan (%)
Place of birth for the foreign-born population - Kuwait (%)
Place of birth for the foreign-born population - Lebanon (%)
Place of birth for the foreign-born population - Saudi Arabia (%)
Place of birth for the foreign-born population - Syria (%)
Place of birth for the foreign-born population - Turkey (%)
Place of birth for the foreign-born population - Yemen (%)
Place of birth for the foreign-born population - Other Western Asia (%)
Place of birth for the foreign-born population - Eritrea (%)
Place of birth for the foreign-born population - Ethiopia (%)
Place of birth for the foreign-born population - Kenya (%)
Place of birth for the foreign-born population - Somalia (%)
Place of birth for the foreign-born population - Uganda (%)
Place of birth for the foreign-born population - Zimbabwe (%)
Place of birth for the foreign-born population - Other Eastern Africa (%)
Place of birth for the foreign-born population - Cameroon (%)
Place of birth for the foreign-born population - Congo (%)
Place of birth for the foreign-born population - Democratic Republic of Congo (Zaire) (%)
Place of birth for the foreign-born population - Other Middle Africa (%)
Place of birth for the foreign-born population - Egypt (%)
Place of birth for the foreign-born population - Morocco (%)
Place of birth for the foreign-born population - Sudan (%)
Place of birth for the foreign-born population - Other Northern Africa (%)
Place of birth for the foreign-born population - South Africa (%)
Place of birth for the foreign-born population - Other Southern Africa (%)
Place of birth for the foreign-born population - Cabo Verde (%)
Place of birth for the foreign-born population - Ghana (%)
Place of birth for the foreign-born population - Liberia (%)
Place of birth for the foreign-born population - Nigeria (%)
Place of birth for the foreign-born population - Senegal (%)
Place of birth for the foreign-born population - Sierra Leone (%)
Place of birth for the foreign-born population - Other Western Africa (%)
Place of birth for the foreign-born population - Australia (%)
Place of birth for the foreign-born population - New Zealand (%)
Place of birth for the foreign-born population - Fiji (%)
Place of birth for the foreign-born population - Micronesia (%)
Place of birth for the foreign-born population - Bahamas (%)
Place of birth for the foreign-born population - Barbados (%)
Place of birth for the foreign-born population - Cuba (%)
Place of birth for the foreign-born population - Dominica (%)
Place of birth for the foreign-born population - Dominican Republic (%)
Place of birth for the foreign-born population - Grenada (%)
Place of birth for the foreign-born population - Haiti (%)
Place of birth for the foreign-born population - Jamaica (%)
Place of birth for the foreign-born population - St. Vincent and the Grenadines (%)
Place of birth for the foreign-born population - Trinidad and Tobago (%)
Place of birth for the foreign-born population - West Indies (%)
Place of birth for the foreign-born population - Other Caribbean (%)
Place of birth for the foreign-born population - Belize (%)
Place of birth for the foreign-born population - Costa Rica (%)
Place of birth for the foreign-born population - El Salvador (%)
Place of birth for the foreign-born population - Guatemala (%)
Place of birth for the foreign-born population - Honduras (%)
Place of birth for the foreign-born population - Mexico (%)
Place of birth for the foreign-born population - Nicaragua (%)
Place of birth for the foreign-born population - Panama (%)
Place of birth for the foreign-born population - Other Central America (%)
Place of birth for the foreign-born population - Argentina (%)
Place of birth for the foreign-born population - Bolivia (%)
Place of birth for the foreign-born population - Brazil (%)
Place of birth for the foreign-born population - Chile (%)
Place of birth for the foreign-born population - Colombia (%)
Place of birth for the foreign-born population - Ecuador (%)
Place of birth for the foreign-born population - Guyana (%)
Place of birth for the foreign-born population - Peru (%)
Place of birth for the foreign-born population - Uruguay (%)
Place of birth for the foreign-born population - Venezuela (%)
Place of birth for the foreign-born population - Other South America (%)
Place of birth for the foreign-born population - Canada (%)
Place of birth for the foreign-born population - Other Northern America (%)
Place of birth for the foreign-born population - Other (%)
Latest news about races in Pottsville, PA collected exclusively by city-data.com from local newspapers, TV, and radio stations
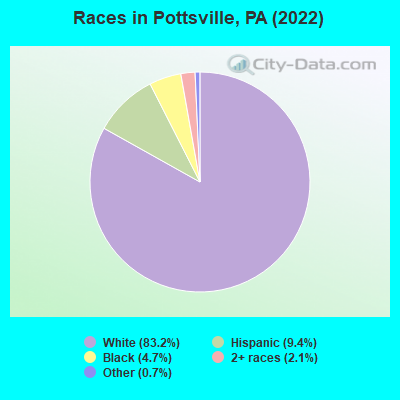
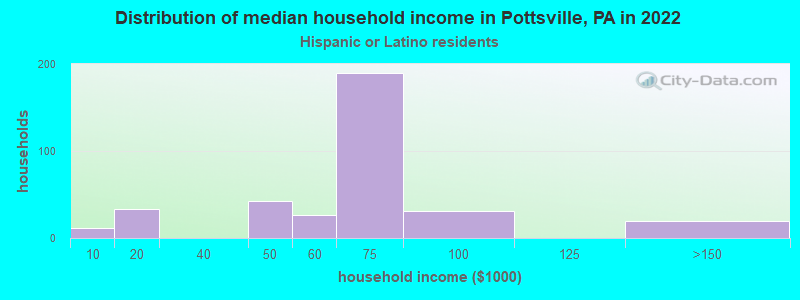
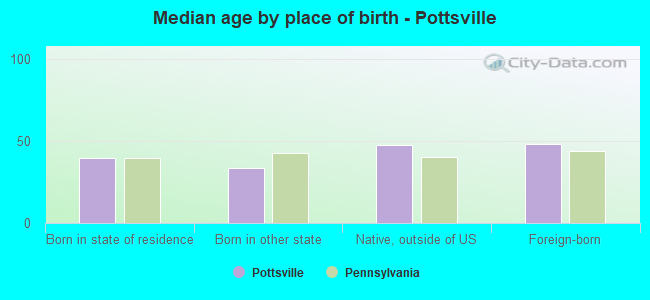
According to 2022 data, the most numerous races in Pottsville, PA are White alone (11,132 residents), Black alone (634 residents), and Hispanic (1,259 residents). 94.4% of Pottsville residents speak English at home. 1.4% of Pottsville, PA residents are foreign-born , which is 408.9% less than the foreign-born rate of 7.0% across the entire state of Pennsylvania.
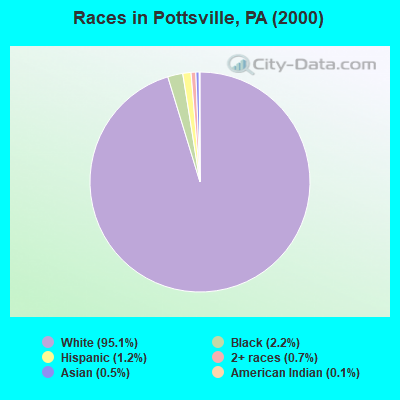
Race distribution in Pottsville
2000 2022
10,322,455 84.1% White alone 1,202,437 9.8% Black alone 394,088 3.2% Hispanic 218,296 1.8% Asian alone 113,097 0.9% Two or more races 13,086 0.1% Other race alone 14,904 0.1% American Indian alone 2,691 0.02% Native Hawaiian and Other
9,487,228 73.1% White alone 1,311,581 10.1% Black alone 1,115,997 8.6% Hispanic 493,942 3.8% Two or more races 487,124 3.8% Asian alone 63,582 0.5% Other race alone 10,130 0.08% American Indian alone 2,424 0.02% Native Hawaiian and Other
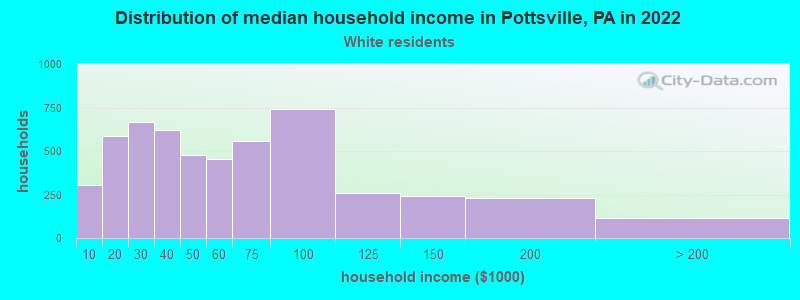
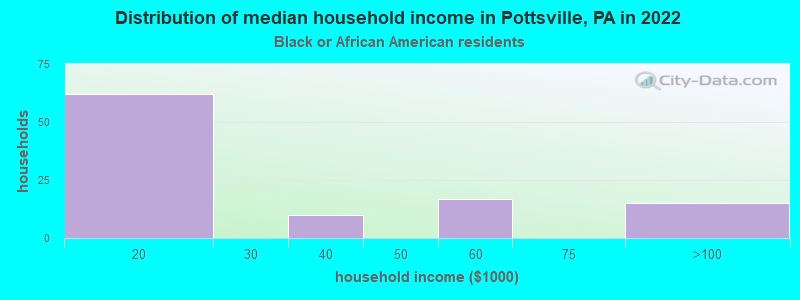
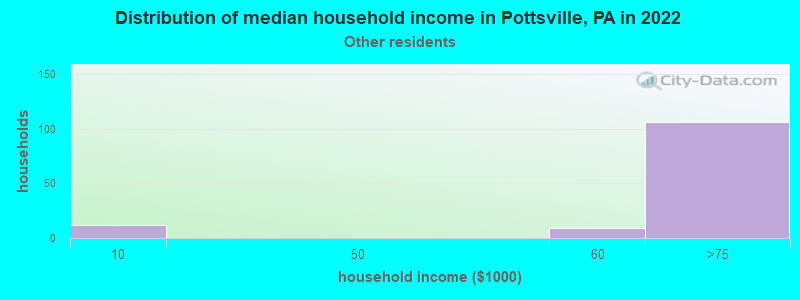
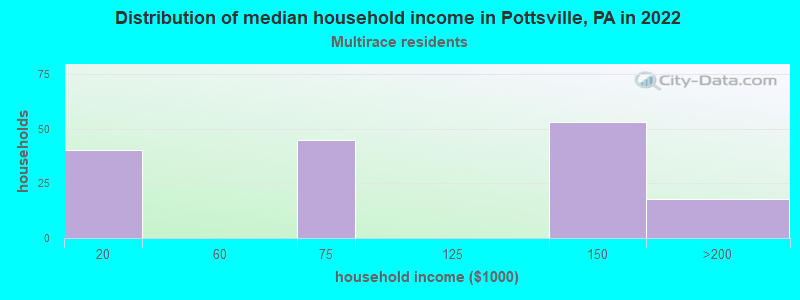
Income and house value in Pottsville Median household income in 2022 $44,691 White non-Hispanic householders$90,432 Some other race householders$69,494 Hispanic or Latino race householdersMedian 2022 house value $100,510 White Non-Hispanic householders$108,459 Black or African American householders $261,785 Asian householders$132,482 Some other race householders$79,489 Two or more races householders$224,514 Hispanic or Latino householders
Median age by race in Pottsville
43.7 Median age for White residents46.4 36.9 15.1 Median age for Black or African American residents34.4 10.0 -642,857,142.2 Median age for American Indian / Alaska Native residents-714,583,332.6 -577,519,379.3 -679,849,340.2 Median age for Asian residents-680,115,273.1 -683,333,332.6 -680,432,644.4 Median age for Native Hawaiian / Pacific Islander residents-666,666,666.0 -666,666,666.0 21.8 Median age for Other race residents53.1 24.4 26.2 Median age for Two or more races residents21.0 52.8 43.6 Median age for White alone residents46.7 37.5 18.0 Median age for Hispanic or Latino residents4.6 24.7
Owner/renter occupied households by race in Pottsville
House owners and renters - White residents 3,090 58.9% Owner occupied2,155 41.1% Renter occupiedHouse owners and renters - Black or African American residents 51 38.1% Owner occupied83 61.9% Renter occupiedHouse owners and renters - American Indian / Alaska Native residents 8 100.0% Renter occupiedHouse owners and renters - Other race residents 47 29.9% Owner occupied110 70.1% Renter occupiedHouse owners and renters - Two or more races residents 168 78.9% Owner occupied45 21.1% Renter occupiedHouse owners and renters - White alone residents 2,943 57.8% Owner occupied2,145 42.2% Renter occupiedHouse owners and renters - Hispanic or Latino residents 224 58.3% Owner occupied160 41.7% Renter occupied
Language usage in Pottsville
English speakers - Total 94.4% of residents of Pottsville speak English at home.
3.1% of residents speak Spanish at home 351 90.5% Speak English very well37 9.5% Speak English less than very well2.4% of residents speak other language at home 225 75.0% Speak English very well75 25.0% Speak English less than very well
English speakers - Born in the United States 83.7% of residents of Pottsville speak English at home.
6.5% of residents speak Spanish at home 58 67.4% Speak English very well28 32.6% Speak English less than very well14.7% of residents speak other language at home 194 100.0% Speak English very well
English speakers - Native, born elsewhere 6.0% of residents of Pottsville speak English at home.
74.7% of residents speak Spanish at home 179 96.2% Speak English very well7 3.8% Speak English less than very well10.4% of residents speak other language at home 26 100.0% Speak English very well
English speakers - Foreign-born 41.8% of residents of Pottsville speak English at home.
64.4% of residents speak other language at home 41 36.0% Speak English very well73 64.0% Speak English less than very well
White (Caucasian) - Speak only English Native:
96.5% (10,260)Foreign-born:
37.8% (41)
White (Caucasian) - Speak another language Native:
3.1% (325)Foreign-born:
62.3% (68)
Black or African American - Speak another language Native:
0.2% (1)Foreign-born:
91.9% (22)
White alone - Speak only English Native:
97.3% (10,073)Foreign-born:
37.7% (45)
White alone - Speak another language Native:
2.6% (265)Foreign-born:
62.3% (74)
Foreign-born residents in Pottsville 184 residents are foreign born
This city:
1.4%Pennsylvania:
7.3%
Marital status for residents in Pottsville Marital status - White (Caucasian) population 15 years and over
Males 35.9% Never married37.2% Now married4.0% Separated6.1% Widowed16.7% DivorcedFemales 36.3% Never married31.9% Now married2.9% Separated11.7% Widowed17.2% DivorcedWomen who gave birth in the past 12 months Now married:
34.8% (88)Unmarried:
65.2% (164)
Women who did not give birth in the past 12 months Now married:
28.3% (715)Unmarried:
71.7% (1,811)
Marital status - Black or African American population 15 years and over
Males 68.5% Never married21.5% Now married6.8% Separated0.0% Widowed3.2% DivorcedFemales 70.8% Never married21.9% Now married0.0% Separated7.3% Widowed0.0% DivorcedWomen who gave birth in the past 12 months Now married:
100.0% (16)Unmarried:
0.0% (0)
Women who did not give birth in the past 12 months Now married:
0.0% (0)Unmarried:
100.0% (102)
Marital status - Asian population 15 years and over
Males 100.0% Never married0.0% Now married0.0% Separated0.0% Widowed0.0% DivorcedFemales 0.0% Never married0.0% Now married0.0% Separated100.0% Widowed0.0% DivorcedMarital status - Other race population 15 years and over
Males 10.5% Never married71.1% Now married0.0% Separated0.0% Widowed18.4% DivorcedFemales 84.8% Never married12.2% Now married0.0% Separated0.0% Widowed3.0% DivorcedWomen who did not give birth in the past 12 months Now married:
12.4% (30)Unmarried:
87.6% (212)
Marital status - Two or more races population 15 years and over
Males 52.7% Never married47.3% Now married0.0% Separated0.0% Widowed0.0% DivorcedFemales 34.8% Never married27.7% Now married0.0% Separated37.6% Widowed0.0% DivorcedWomen who gave birth in the past 12 months Now married:
19.4% (11)Unmarried:
80.6% (47)
Women who did not give birth in the past 12 months Now married:
23.1% (20)Unmarried:
76.9% (65)
Marital status - White alone, not Hispanic / Latino population 15 years and over
Males 35.1% Never married37.7% Now married4.1% Separated6.2% Widowed17.0% DivorcedFemales 35.3% Never married32.8% Now married3.1% Separated12.4% Widowed16.4% DivorcedWomen who gave birth in the past 12 months Now married:
25.1% (56)Unmarried:
74.9% (167)
Women who did not give birth in the past 12 months Now married:
29.7% (714)Unmarried:
70.3% (1,688)
Marital status - Hispanic or Latino population 15 years and over
Males 79.7% Never married11.4% Now married0.0% Separated0.0% Widowed8.9% DivorcedFemales 67.7% Never married10.6% Now married0.0% Separated2.7% Widowed19.0% DivorcedWomen who gave birth in the past 12 months Now married:
54.7% (47)Unmarried:
45.3% (39)
Women who did not give birth in the past 12 months Now married:
4.4% (21)Unmarried:
95.6% (462)
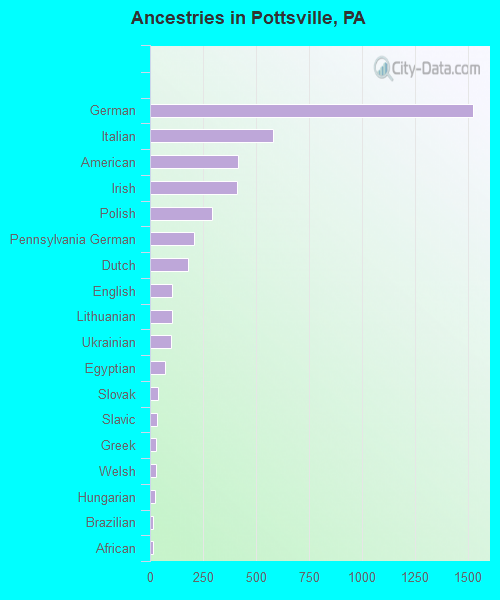
Ancestries in Pottsville
1,523 31.7% German582 12.1% Italian414 8.6% American410 8.5% Irish294 6.1% Polish207 4.3% Pennsylvania German180 3.7% Dutch104 2.2% English104 2.2% Lithuanian99 2.1% Ukrainian73 1.5% Egyptian40 0.8% Slovak31 0.6% Slavic28 0.6% Greek28 0.6% Welsh25 0.5% Hungarian16 0.3% Brazilian16 0.3% African12 0.2% Cajun11 0.2% Scottish9 0.2% Danish9 0.2% Swedish8 0.2% Lebanese8 0.2% Czechoslovakian7 0.1% French Canadian5 0.1% Czech5 0.1% Norwegian4 0.08% Russian
Children Nativity (place of birth) in Pottsville
Children under 6 years - Living with two parents Both parents native 275 100.0% NativeBoth parents foreign-born 27 100.0% NativeChildren under 6 years - Living with one parent Native parent 673 100.0% NativeChildren 6 to 17 years - Living with two parents Both parents native 562 100.0% NativeChildren 6 to 17 years - Living with one parent Native parent 1,153 100.0% NativeForeign-born parent 132 52.6% Native118 47.4% Foreign-born
Grandparents responsible for own grandchildren in Pottsville
Grandparents (30 to 59 years) White / Caucasian 57 100.0% Responsible for grandchildrenWhite alone, not Hispanic / Latino 57 100.0% Responsible for grandchildrenGrandparents (60 years and over) White / Caucasian 78 35.1% Responsible for grandchildren144 64.9% Not responsible for grandchildrenWhite alone, not Hispanic / Latino 84 36.3% Responsible for grandchildren147 63.7% Not responsible for grandchildren