Races in Poulsbo, Washington (WA) Detailed Stats
Ancestries, Foreign-born residents, place of birth
Settings
X


Recent posts about races in Poulsbo, Washington on our local forum with over 2,400,000 registered users:

Latest news about races in Poulsbo, WA collected exclusively by city-data.com from local newspapers, TV, and radio stations
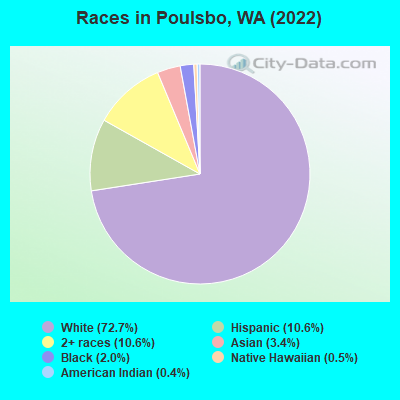
According to 2022 data, the most numerous races in Poulsbo, WA are White alone (8,669 residents), Hispanic (1,269 residents), and Asian alone (402 residents). 91.2% of Poulsbo residents speak English at home. 7.3% of Poulsbo, WA residents are foreign-born (3.3% born in Latin America, 2.7% born in Asia), which is 104.4% less than the foreign-born rate of 15.0% across the entire state of Washington.
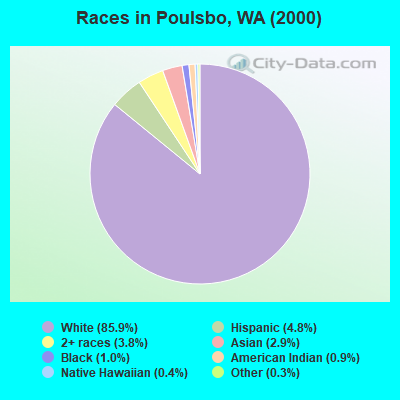
Race distribution in Poulsbo
2000
2022

- 5,84985.9%White alone
- 3304.8%Hispanic
- 2583.8%Two or more races
- 1992.9%Asian alone
- 691.0%Black alone
- 630.9%American Indian alone
- 260.4%Native Hawaiian and Other
Pacific Islander alone - 190.3%Other race alone
-
- 8,66972.7%White alone
- 1,26910.6%Hispanic
- 1,25910.6%Two or more races
- 4023.4%Asian alone
- 2352.0%Black alone
- 600.5%Native Hawaiian and Other
Pacific Islander alone - 430.4%American Indian alone
2000
2022
-
- 4,652,49078.9%White alone
- 441,5097.5%Hispanic
- 319,4015.4%Asian alone
- 184,6313.1%Black alone
- 175,9263.0%Two or more races
- 85,3961.4%American Indian alone
- 22,7790.4%Native Hawaiian and Other
Pacific Islander alone - 11,9890.2%Other race alone

-
- 4,941,45663.5%White alone
- 1,093,31314.0%Hispanic
- 755,8329.7%Asian alone
- 523,4486.7%Two or more races
- 299,5373.8%Black alone
- 69,0240.9%American Indian alone
- 52,2310.7%Native Hawaiian and Other
Pacific Islander alone - 50,9450.7%Other race alone

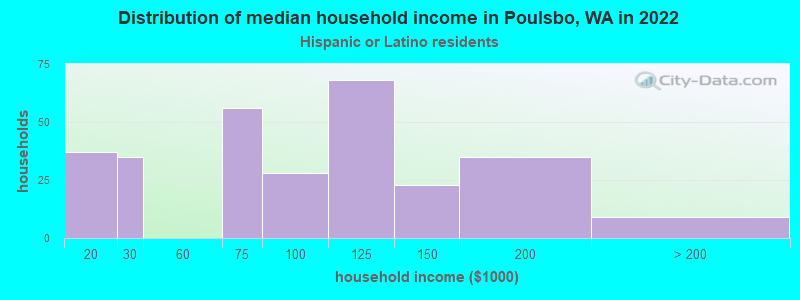
Income and house value in Poulsbo
- Median household income in 2022
- $92,315White non-Hispanic householders
- $86,423Black householders
- $113,546Asian householders
- $97,495Two or more races householders
- $93,587Hispanic or Latino race householders
- Median 2022 house value
- $645,934White Non-Hispanic householders
- $730,033Black or African American householders
- $632,696American Indian or Alaska Native householders
- $519,005Asian householders
- $369,883Native Hawaiian and other Pacific Islander householders
- $578,186Two or more races householders
- $632,696Hispanic or Latino householders
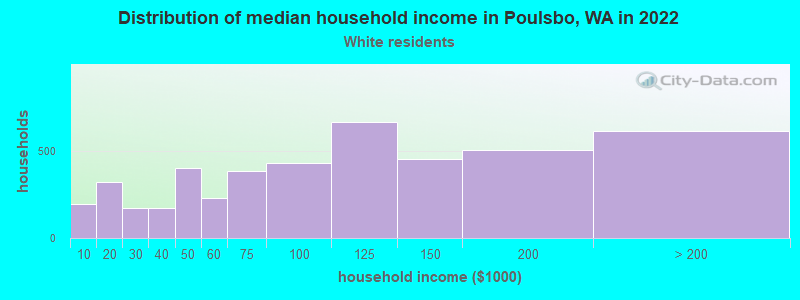
Household income for White non-Hispanic householders
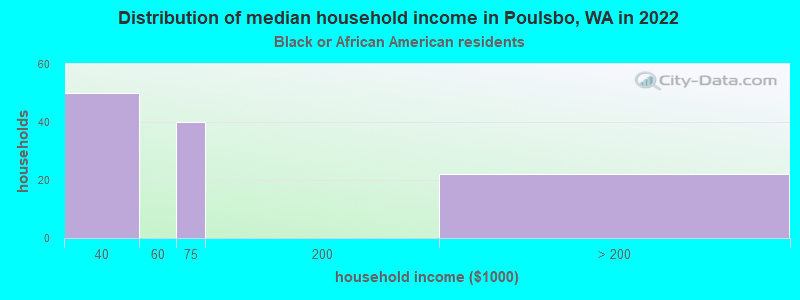
Household income for Black householders
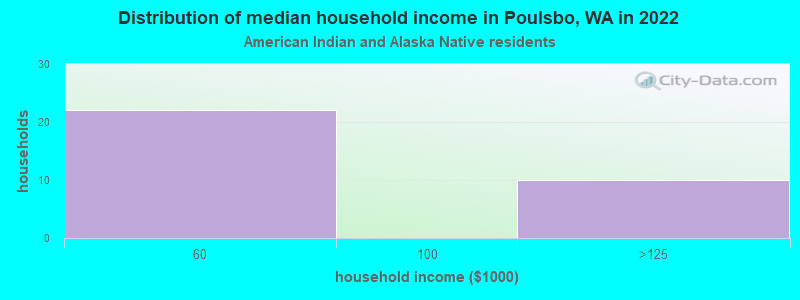
Household income for American Indian and Alaska Native householders
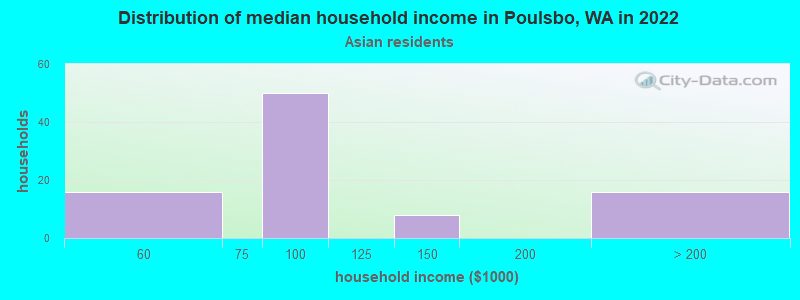
Household income for Asian householders
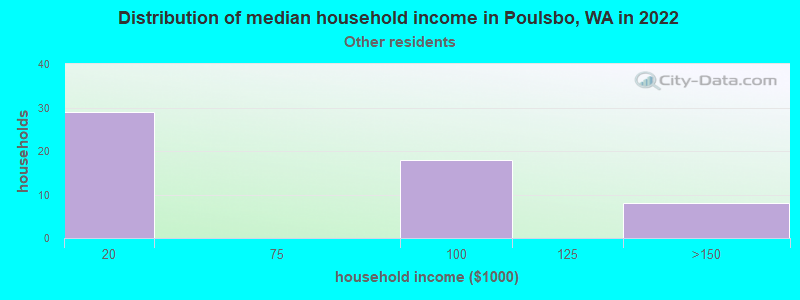
Household income for Some other race householders
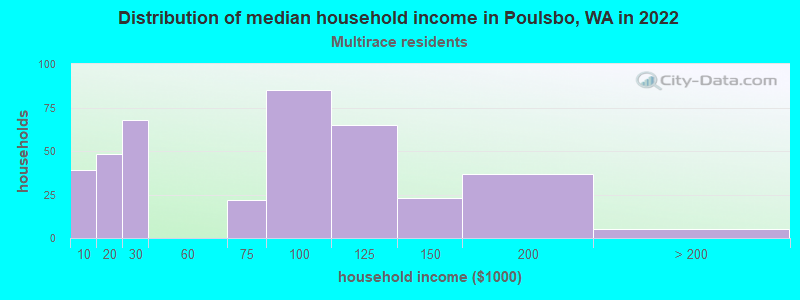
Household income for Two or more races householders
Household income for Hispanic or Latino race householders
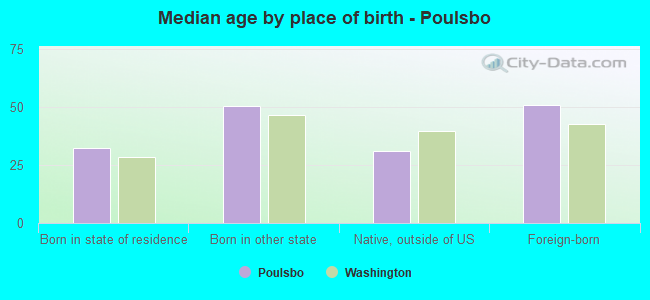
Median age by race in Poulsbo
- 47.2Median age for White residents
- 45.7Males
- 50.4Females
- 38.6Median age for Black or African American residents
- 38.4Males
- 85.0Females
- 44.2Median age for American Indian / Alaska Native residents
- 16.0Males
- -649,076,516.5Females
- 48.4Median age for Asian residents
- 50.0Males
- 41.1Females
- 38.9Median age for Native Hawaiian / Pacific Islander residents
- -639,639,639.0Males
- 43.9Females
- 41.7Median age for Other race residents
- 21.6Males
- 39.0Females
- 17.2Median age for Two or more races residents
- 15.2Males
- 19.4Females
- 48.8Median age for White alone residents
- 47.7Males
- 52.8Females
- 22.6Median age for Hispanic or Latino residents
- 19.1Males
- 32.4Females
Owner/renter occupied households by race in Poulsbo
- House owners and renters - White residents
- 2,82261.1%Owner occupied
- 1,79938.9%Renter occupied
- House owners and renters - Black or African American residents
- 1817.7%Owner occupied
- 8382.3%Renter occupied
- House owners and renters - American Indian / Alaska Native residents
- 2165.8%Owner occupied
- 1134.2%Renter occupied
- House owners and renters - Asian residents
- 7885.0%Owner occupied
- 1415.0%Renter occupied
- House owners and renters - Native Hawaiian / Pacific Islander residents
- 5100.0%Renter occupied
- House owners and renters - Other race residents
- 1118.9%Owner occupied
- 4981.1%Renter occupied
- House owners and renters - Two or more races residents
- 23770.2%Owner occupied
- 10029.8%Renter occupied
- House owners and renters - White alone residents
- 2,76161.1%Owner occupied
- 1,76038.9%Renter occupied
- House owners and renters - Hispanic or Latino residents
- 18365.1%Owner occupied
- 9834.9%Renter occupied
Language usage in Poulsbo
- English speakers - Total
- 91.2% of residents of Poulsbo speak English at home.
- 5.1% of residents speak Spanish at home
- 32857.6%Speak English very well
- 24142.4%Speak English less than very well
- 3.8% of residents speak other language at home
- 26060.3%Speak English very well
- 17139.7%Speak English less than very well
- English speakers - Born in the United States
- 97.5% of residents of Poulsbo speak English at home.
- 1.9% of residents speak Spanish at home
- 8890.7%Speak English very well
- 99.3%Speak English less than very well
- 0.5% of residents speak other language at home
- 24100.0%Speak English very well
- English speakers - Native, born elsewhere
- 97.6% of residents of Poulsbo speak English at home.
- 6.4% of residents speak other language at home
- 29100.0%Speak English very well
- English speakers - Foreign-born
- 29.9% of residents of Poulsbo speak English at home.
- 37.8% of residents speak Spanish at home
- 9125.8%Speak English very well
- 26274.2%Speak English less than very well
- 36.4% of residents speak other language at home
- 17451.2%Speak English very well
- 16648.8%Speak English less than very well
White (Caucasian) - Speak only English
| Native: | 98.6% (8,252) |
| Foreign-born: | 26.9% (96) |
White (Caucasian) - Speak another language
| Native: | 1.4% (118) |
| Foreign-born: | 81.0% (288) |
Black or African American - Speak only English
| Native: | 100.0% (128) |
| Foreign-born: | 100.0% (125) |
Asian - Speak only English
| Native: | 100.0% (187) |
| Foreign-born: | 8.6% (18) |
Other race - Speak another language
| Native: | 75.5% (96) |
| Foreign-born: | 100.0% (117) |
Two or more races - Speak only English
| Native: | 92.0% (1,345) |
| Foreign-born: | 64.3% (64) |
Two or more races - Speak another language
| Native: | 7.3% (107) |
| Foreign-born: | 25.3% (25) |
White alone - Speak only English
| Native: | 99.4% (8,060) |
| Foreign-born: | 39.5% (96) |
White alone - Speak another language
| Native: | 0.6% (49) |
| Foreign-born: | 65.9% (159) |
Hispanic or Latino - Speak only English
| Native: | 69.2% (532) |
| Foreign-born: | 9.6% (37) |
Hispanic or Latino - Speak another language
| Native: | 31.1% (239) |
| Foreign-born: | 90.1% (345) |
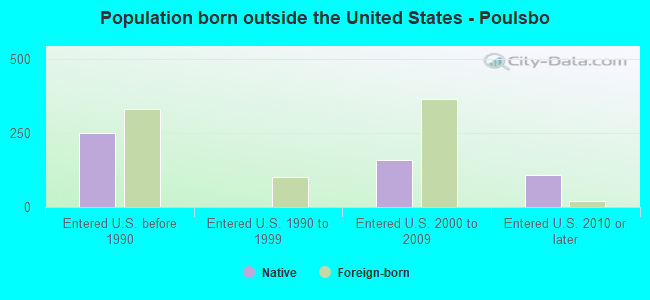
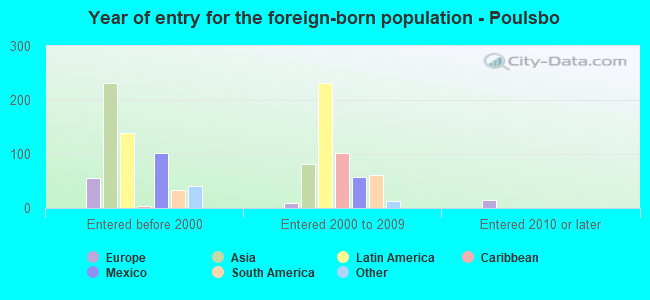
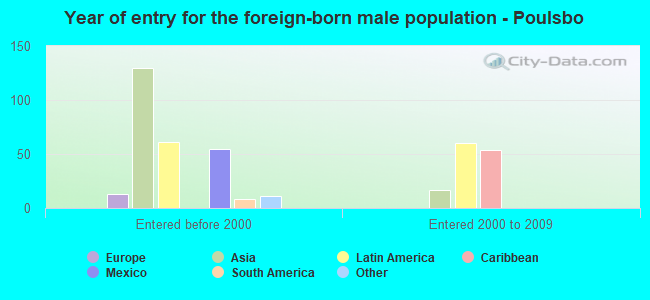
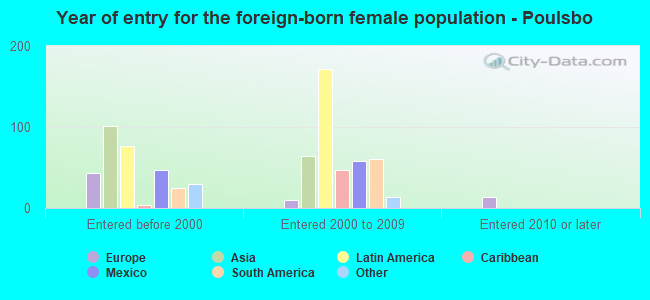
Foreign-born residents in Poulsbo
875 residents are foreign born (3.3% Latin America, 2.7% Asia).
| This city: | 7.3% |
| Washington: | 14.9% |
Marital status for residents in Poulsbo
Marital status - White (Caucasian) population 15 years and over
- Males
- 23.4%Never married
- 62.4%Now married
- 0.6%Separated
- 2.3%Widowed
- 11.3%Divorced
- Females
- 22.4%Never married
- 48.0%Now married
- 1.3%Separated
- 11.3%Widowed
- 17.0%Divorced
Women who gave birth in the past 12 months
| Now married: | 100.0% (102) |
| Unmarried: | 0.0% (0) |
Women who did not give birth in the past 12 months
| Now married: | 47.7% (896) |
| Unmarried: | 52.3% (983) |
Marital status - Black or African American population 15 years and over
- Males
- 52.9%Never married
- 47.1%Now married
- 0.0%Separated
- 0.0%Widowed
- 0.0%Divorced
- Females
- 0.0%Never married
- 31.9%Now married
- 0.0%Separated
- 68.1%Widowed
- 0.0%Divorced
Women who did not give birth in the past 12 months
| Now married: | 100.0% (18) |
| Unmarried: | 0.0% (0) |
Marital status - American Indian / Alaska Native population 15 years and over
- Males
- 0.0%Never married
- 30.0%Now married
- 0.0%Separated
- 70.0%Widowed
- 0.0%Divorced
- Females
- 0.0%Never married
- 100.0%Now married
- 0.0%Separated
- 0.0%Widowed
- 0.0%Divorced
Women who did not give birth in the past 12 months
| Now married: | 100.0% (14) |
| Unmarried: | 0.0% (0) |
Marital status - Asian population 15 years and over
- Males
- 11.0%Never married
- 70.3%Now married
- 0.0%Separated
- 0.0%Widowed
- 18.7%Divorced
- Females
- 37.1%Never married
- 50.9%Now married
- 0.0%Separated
- 4.0%Widowed
- 8.0%Divorced
Women who did not give birth in the past 12 months
| Now married: | 42.0% (51) |
| Unmarried: | 58.0% (71) |
Marital status - Native Hawaiian / Pacific Islander population 15 years and over
- Males
- 47.1%Never married
- 52.9%Now married
- 0.0%Separated
- 0.0%Widowed
- 0.0%Divorced
- Females
- 0.0%Never married
- 100.0%Now married
- 0.0%Separated
- 0.0%Widowed
- 0.0%Divorced
Women who did not give birth in the past 12 months
| Now married: | 100.0% (40) |
| Unmarried: | 0.0% (0) |
Marital status - Other race population 15 years and over
- Males
- 46.9%Never married
- 53.1%Now married
- 0.0%Separated
- 0.0%Widowed
- 0.0%Divorced
- Females
- 18.1%Never married
- 62.5%Now married
- 0.0%Separated
- 0.0%Widowed
- 19.4%Divorced
Women who did not give birth in the past 12 months
| Now married: | 77.6% (106) |
| Unmarried: | 22.4% (31) |
Marital status - Two or more races population 15 years and over
- Males
- 54.8%Never married
- 40.8%Now married
- 0.0%Separated
- 0.0%Widowed
- 4.4%Divorced
- Females
- 46.7%Never married
- 34.7%Now married
- 2.0%Separated
- 6.0%Widowed
- 10.6%Divorced
Women who gave birth in the past 12 months
| Now married: | 100.0% (113) |
| Unmarried: | 0.0% (0) |
Women who did not give birth in the past 12 months
| Now married: | 8.1% (26) |
| Unmarried: | 91.9% (296) |
Marital status - White alone, not Hispanic / Latino population 15 years and over
- Males
- 24.2%Never married
- 61.1%Now married
- 0.6%Separated
- 2.4%Widowed
- 11.7%Divorced
- Females
- 22.9%Never married
- 46.1%Now married
- 1.3%Separated
- 11.9%Widowed
- 17.7%Divorced
Women who gave birth in the past 12 months
| Now married: | 100.0% (27) |
| Unmarried: | 0.0% (0) |
Women who did not give birth in the past 12 months
| Now married: | 46.0% (824) |
| Unmarried: | 54.0% (966) |
Marital status - Hispanic or Latino population 15 years and over
- Males
- 44.3%Never married
- 55.7%Now married
- 0.0%Separated
- 0.0%Widowed
- 0.0%Divorced
- Females
- 28.0%Never married
- 66.0%Now married
- 0.0%Separated
- 0.0%Widowed
- 6.0%Divorced
Women who gave birth in the past 12 months
| Now married: | 100.0% (79) |
| Unmarried: | 0.0% (0) |
Women who did not give birth in the past 12 months
| Now married: | 56.2% (172) |
| Unmarried: | 43.8% (134) |
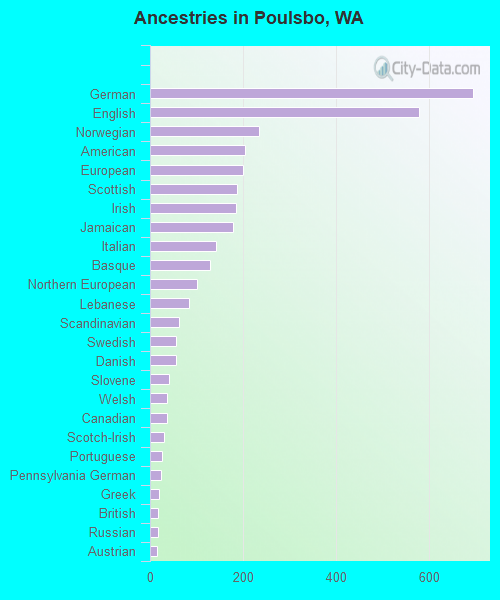
Ancestries in Poulsbo

- 69513.2%German
- 58011.0%English
- 2354.5%Norwegian
- 2043.9%American
- 2013.8%European
- 1883.6%Scottish
- 1863.5%Irish
- 1793.4%Jamaican
- 1432.7%Italian
- 1292.5%Basque
- 1011.9%Northern European
- 841.6%Lebanese
- 621.2%Scandinavian
- 571.1%Swedish
- 561.1%Danish
- 410.8%Slovene
- 370.7%Welsh
- 360.7%Canadian
- 310.6%Scotch-Irish
- 250.5%Portuguese
- 230.4%Pennsylvania German
- 190.4%Greek
- 180.3%British
- 170.3%Russian
- 150.3%Austrian
- 140.3%Ukrainian
- 130.2%Finnish
- 130.2%French
- 120.2%Belgian
- 40.08%Polish
- 30.06%Trinidadian and Tobagonian
- 10.02%Swiss
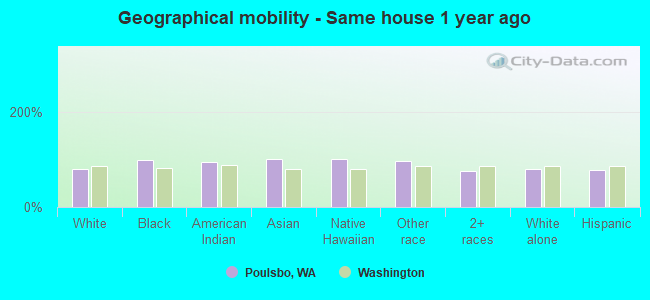
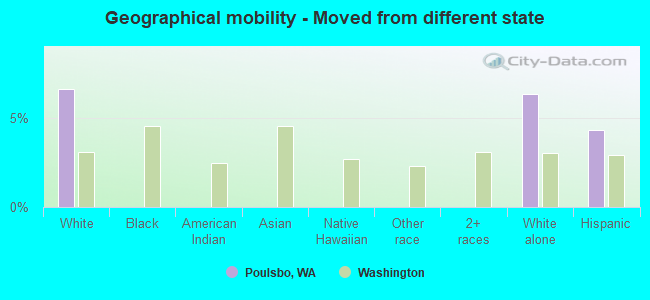
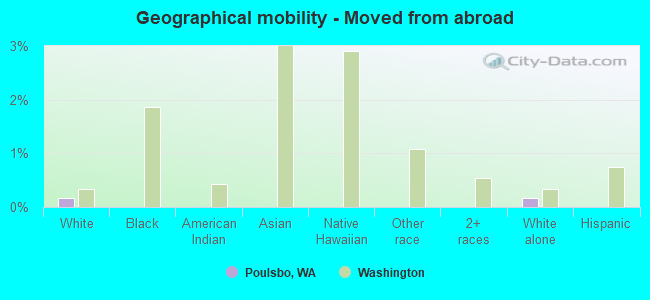
Geographical mobility in Poulsbo

- Same house 1 year ago
- 7,24779.4%White (Caucasian)
- 24999.5%Black or African American
- 5593.7%American Indian / Alaska Native
- 405100.0%Asian
- 77100.0%Native Hawaiian / Pacific Islander
- 21195.8%Other race
- 1,29076.3%Two or more races
- 6,85979.2%White alone, not Hispanic / Latino
- 92377.1%Hispanic or Latino
-
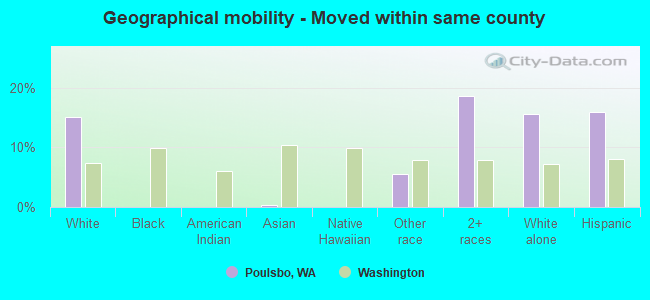
- Moved within same county
- 1,37315.1%White / Caucasian
- 20.4%Asian
- 125.6%Other race
- 31418.6%Two or more races
- 1,34915.6%White alone, not Hispanic / Latino
- 19116.0%Hispanic or Latino
-
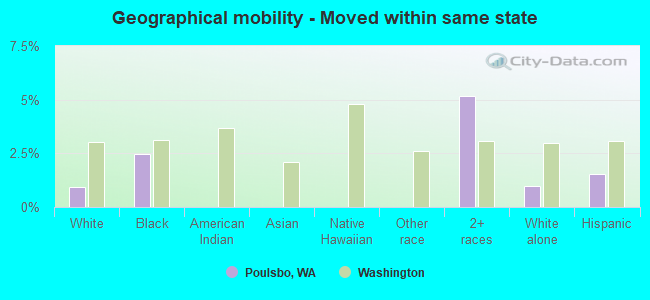
- Moved within same state
- 840.9%White / Caucasian
- 62.5%Black or African American
- 885.2%Two or more races
- 861.0%White alone, not Hispanic / Latino
- 181.5%Hispanic or Latino
-
- Moved from different state
- 6006.6%White / Caucasian
- 5466.3%White alone, not Hispanic / Latino
- 524.3%Hispanic or Latino
-
- Moved from abroad
- 150.2%White
- 150.2%White alone, not Hispanic / Latino
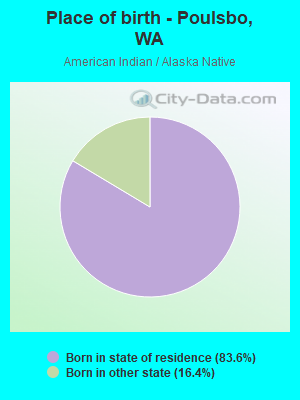
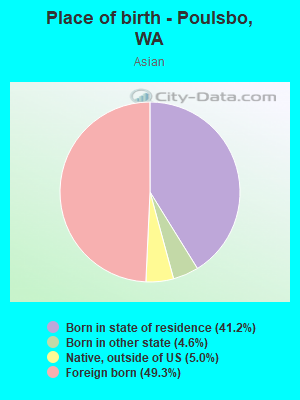
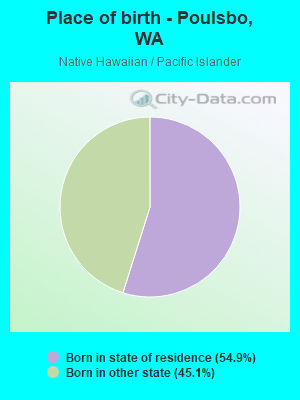
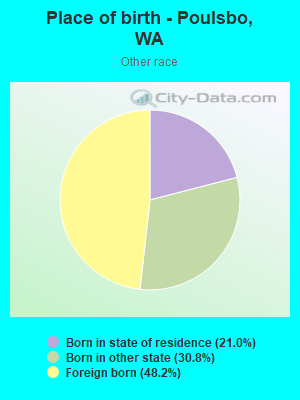
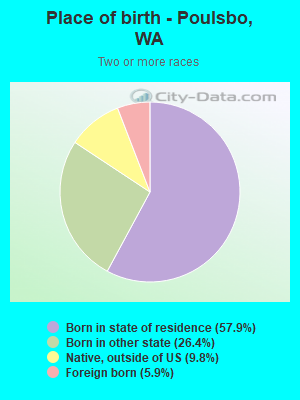
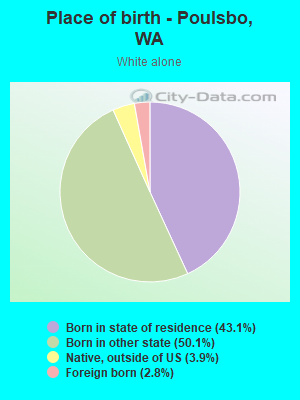
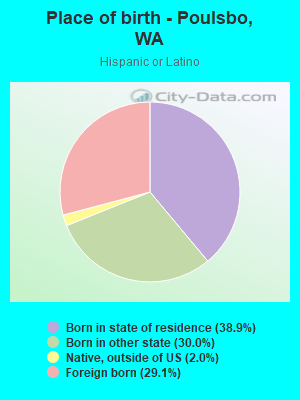
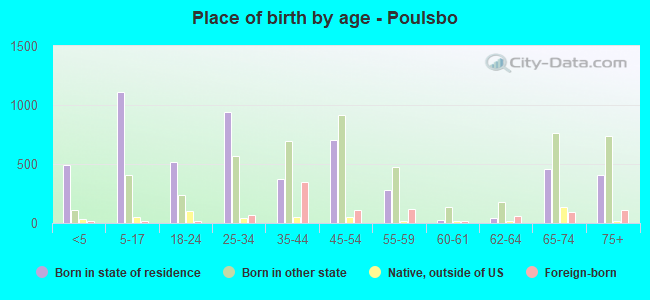
Children Nativity (place of birth) in Poulsbo
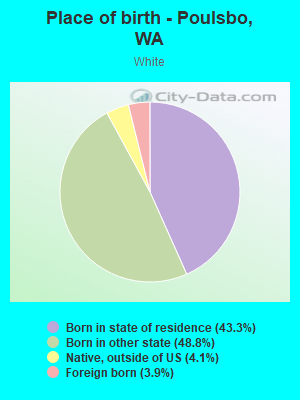
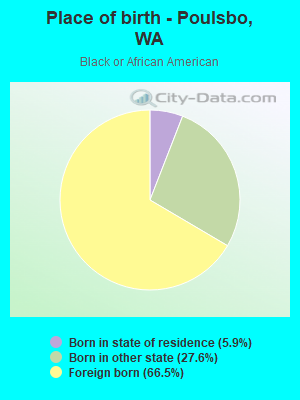
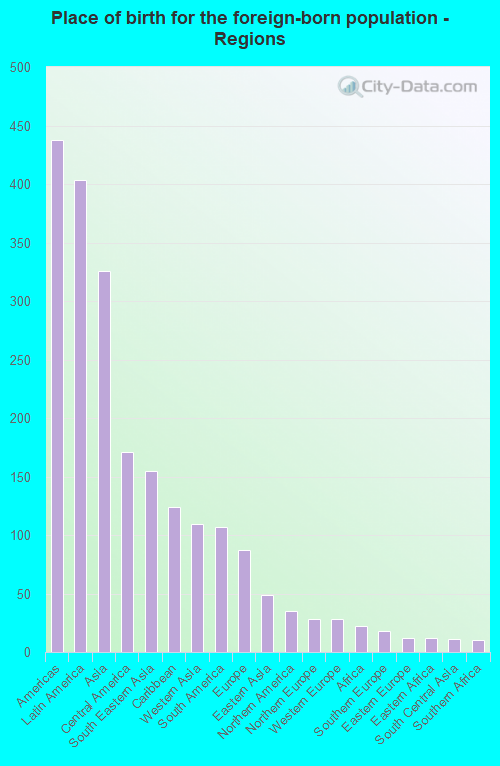
Place of birth for residents in Poulsbo
![Place of birth for the foreign-born population - Regions]()
- 438Americas
- 403Latin America
- 326Asia
- 171Central America
- 155South Eastern Asia
- 124Caribbean
- 109Western Asia
- 107South America
- 87Europe
- 49Eastern Asia
- 35Northern America
- 28Northern Europe
- 28Western Europe
- 22Africa
- 18Southern Europe
- 12Eastern Europe
- 12Eastern Africa
- 11South Central Asia
- 10Southern Africa
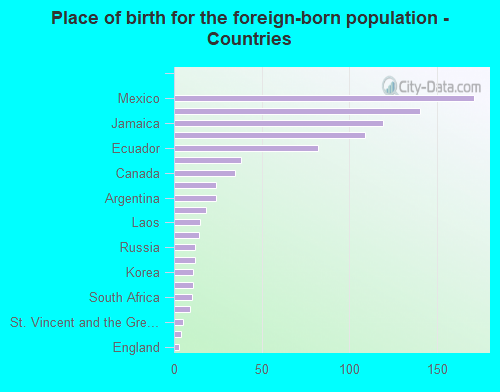
![Place of birth for the foreign-born population - Countries]()
- 171Mexico
- 140Philippines
- 119Jamaica
- 109Lebanon
- 82Ecuador
- 38Japan
- 35Canada
- 24United Kingdom
- 24Argentina
- 18Spain
- 15Laos
- 14Switzerland
- 12Russia
- 12Kenya
- 11Korea
- 11India
- 10South Africa
- 9Germany
- 5St. Vincent and the Grenadines
- 4France
- 3England
Grandparents responsible for own grandchildren in Poulsbo
Zip codes: 98370.