Races in Powderville, South Carolina (SC) Detailed Stats
Ancestries, Foreign-born residents, place of birth

Discuss Powderville, South Carolina races on our local forum with over 2,400,000 registered users
1.8% of Powderville, SC residents are foreign-born , which is 182.2% less than the foreign-born rate of 5.0% across the entire state of South Carolina.
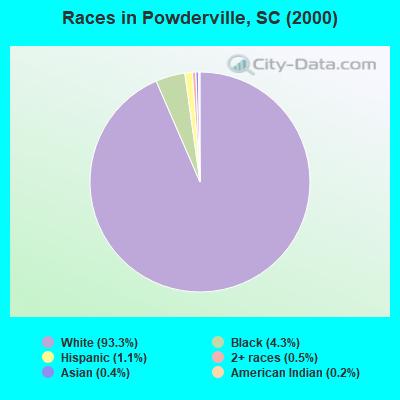
Race distribution in Powderville

- 5,00493.3%White alone
- 2334.3%Black alone
- 611.1%Hispanic
- 270.5%Two or more races
- 200.4%Asian alone
- 130.2%American Indian alone
- 30.06%Native Hawaiian and Other
Pacific Islander alone - 10.02%Other race alone
2000
2022
-
- 2,652,29166.1%White alone
- 1,178,48629.4%Black alone
- 95,0762.4%Hispanic
- 35,5680.9%Asian alone
- 33,2900.8%Two or more races
- 12,7650.3%American Indian alone
- 3,2660.08%Other race alone
- 1,2700.03%Native Hawaiian and Other
Pacific Islander alone

-
- 3,301,73962.5%White alone
- 1,313,29024.9%Black alone
- 343,7836.5%Hispanic
- 190,5083.6%Two or more races
- 89,8881.7%Asian alone
- 29,3900.6%Other race alone
- 12,1120.2%American Indian alone
- 1,9240.04%Native Hawaiian and Other
Pacific Islander alone

Income and house value in Powderville
- Median household income in 2022
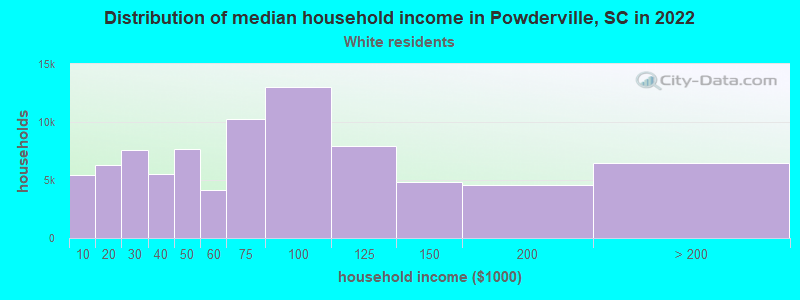
- $84,085White non-Hispanic householders
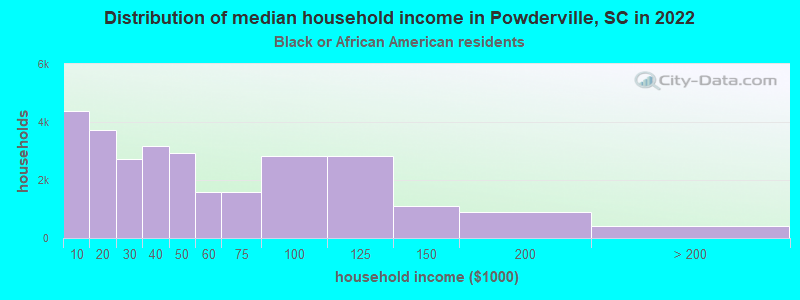
- $90,806Black householders
- $142,034Some other race householders
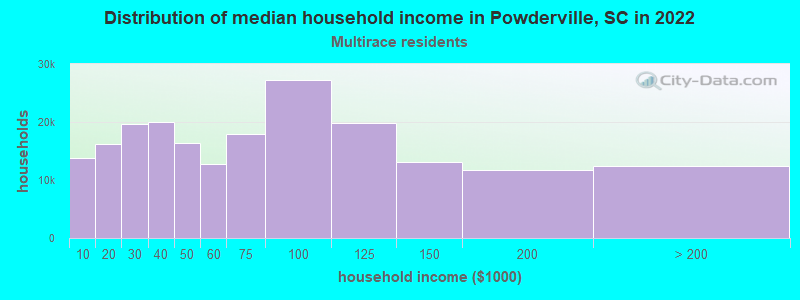
- $89,865Two or more races householders
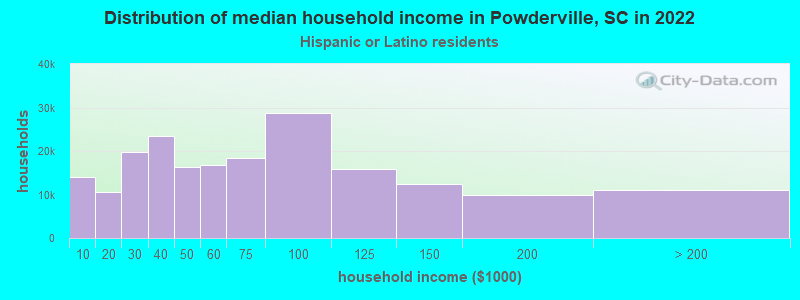
- over $200,000Hispanic or Latino race householders
- Median 2022 house value
- $393,776White Non-Hispanic householders
- $332,035Black or African American householders
- $782,432Some other race householders
- $156,486Two or more races householders
- $782,432Hispanic or Latino householders
Household income for White non-Hispanic householders
Household income for Black householders
Household income for Two or more races householders
Household income for Hispanic or Latino race householders
Foreign-born residents in Powderville
95 residents are foreign born
| This city: | 1.8% |
| South Carolina: | 2.9% |
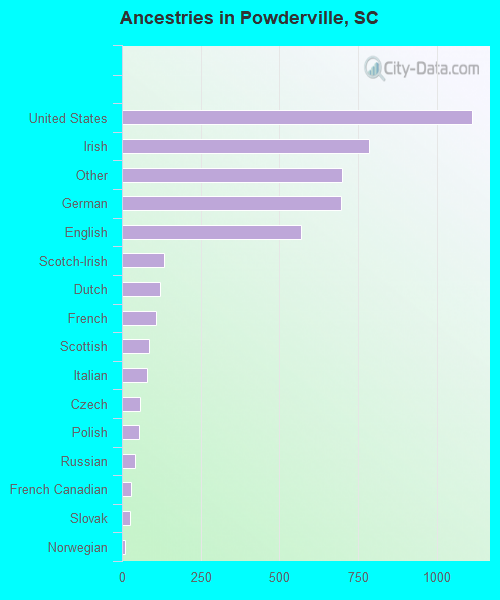
Ancestries in Powderville

- 1,11123.9%United States
- 78516.9%Irish
- 70015.1%Other
- 69514.9%German
- 57012.3%English
- 1352.9%Scotch-Irish
- 1202.6%Dutch
- 1092.3%French
- 861.8%Scottish
- 801.7%Italian
- 571.2%Czech
- 531.1%Polish
- 400.9%Russian
- 290.6%French Canadian
- 260.6%Slovak
- 110.2%Norwegian
- 80.2%Hungarian
- 70.2%Danish
- 70.2%Greek
- 70.2%Lithuanian
- 70.2%Subsaharan African
- 70.2%Swedish
Zip codes: 29642.