Races in Powell, Ohio (OH) Detailed Stats
Ancestries, Foreign-born residents, place of birth
Settings
X


Recent posts about races in Powell, Ohio on our local forum with over 2,400,000 registered users:
 | African American family from DC relocating to Dublin (12 replies) |
| Will Kasich endorse Biden at Democratic Convention? (37 replies) |
| Job Offer In Columbus, Ohio from Dallas, Texas (15 replies) |
| Train noise: Is it that bad? (6 replies) |
| Need help figuring out suburbs! Hilliard, Dublin, Powell? (26 replies) |
| Powell vs. Dublin - Husband working at Doctor's West (28 replies) |
Latest news about races in Powell, OH collected exclusively by city-data.com from local newspapers, TV, and radio stations
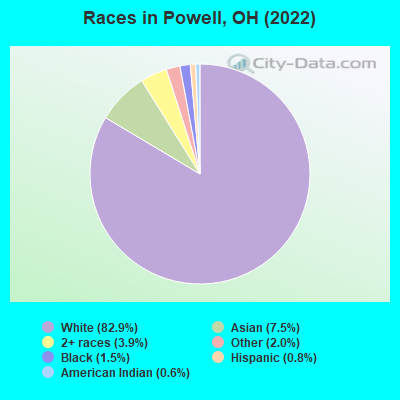
According to 2022 data, the most numerous races in Powell, OH are White alone (12,247 residents), Black alone (217 residents), and Two or more races (572 residents). 88.2% of Powell residents speak English at home. 8.2% of Powell, OH residents are foreign-born (6.8% born in Asia, 1.2% born in Europe), which is 51.1% greater than the foreign-born rate of 4.0% across the entire state of Ohio.
Race distribution in Powell
2000
2022

- 5,83893.5%White alone
- 1863.0%Asian alone
- 971.6%Black alone
- 681.1%Hispanic
- 430.7%Two or more races
- 80.1%Other race alone
- 70.1%American Indian alone

-
- 12,24782.9%White alone
- 1,1077.5%Asian alone
- 5723.9%Two or more races
- 2972.0%Other race alone
- 2171.5%Black alone
- 1160.8%Hispanic
- 930.6%American Indian alone
2000
2022
-
- 9,538,11184.0%White alone
- 1,290,66211.4%Black alone
- 217,1231.9%Hispanic
- 137,7701.2%Two or more races
- 131,6701.2%Asian alone
- 21,9850.2%American Indian alone
- 13,4830.1%Other race alone
- 2,3360.02%Native Hawaiian and Other
Pacific Islander alone

-
- 8,948,79376.1%White alone
- 1,401,40311.9%Black alone
- 529,2914.5%Two or more races
- 517,2324.4%Hispanic
- 293,3872.5%Asian alone
- 52,8050.4%Other race alone
- 9,7850.08%American Indian alone
- 3,3620.03%Native Hawaiian and Other
Pacific Islander alone

Income and house value in Powell
- Median household income in 2022
- $174,708White non-Hispanic householders
- over $200,000Asian householders
- over $200,000Some other race householders
- $191,857Two or more races householders
- Median 2022 house value
- $515,186White Non-Hispanic householders
- $465,297Black or African American householders
- $575,807Asian householders
- $695,660Two or more races householders
- $319,804Hispanic or Latino householders
Household income for White non-Hispanic householders

Household income for Black householders

Household income for Asian householders

Household income for Some other race householders

Household income for Two or more races householders

Median age by race in Powell
- 44.2Median age for White residents
- 44.5Males
- 44.2Females
- 47.7Median age for Black or African American residents
- 51.8Males
- 41.0Females
- 9.9Median age for American Indian / Alaska Native residents
- 10.4Males
- -658,163,264.6Females
- 41.7Median age for Asian residents
- 42.6Males
- 43.1Females
- -800,387,596.1Median age for Native Hawaiian / Pacific Islander residents
- -666,666,666.0Males
- -666,666,666.0Females
- 43.1Median age for Other race residents
- 44.9Males
- 43.2Females
- 16.0Median age for Two or more races residents
- 13.0Males
- 23.6Females
- 44.3Median age for White alone residents
- 44.5Males
- 44.2Females
- 46.7Median age for Hispanic or Latino residents
- -550,116,549.6Males
- 63.9Females
Owner/renter occupied households by race in Powell
- House owners and renters - White residents
- 3,88590.1%Owner occupied
- 4269.9%Renter occupied
- House owners and renters - Black or African American residents
- 64100.0%Owner occupied
- House owners and renters - Asian residents
- 460100.0%Owner occupied
- House owners and renters - Other race residents
- 61100.0%Owner occupied
- House owners and renters - Two or more races residents
- 183100.0%Owner occupied
- House owners and renters - White alone residents
- 3,90290.0%Owner occupied
- 43210.0%Renter occupied
- House owners and renters - Hispanic or Latino residents
- 34100.0%Owner occupied
Language usage in Powell
- English speakers - Total
- 88.2% of residents of Powell speak English at home.
- 0.4% of residents speak Spanish at home
- 5493.1%Speak English very well
- 46.9%Speak English less than very well
- 11.0% of residents speak other language at home
- 1,32085.1%Speak English very well
- 23214.9%Speak English less than very well
- English speakers - Born in the United States
- 99.3% of residents of Powell speak English at home.
- 0.4% of residents speak Spanish at home
- 16100.0%Speak English very well
- 0.5% of residents speak other language at home
- 21100.0%Speak English very well
- English speakers - Native, born elsewhere
- 68.0% of residents of Powell speak English at home.
- 9.4% of residents speak other language at home
- 12100.0%Speak English very well
- English speakers - Foreign-born
- 21.1% of residents of Powell speak English at home.
- 2.2% of residents speak Spanish at home
- 2787.1%Speak English very well
- 412.9%Speak English less than very well
- 74.4% of residents speak other language at home
- 80576.2%Speak English very well
- 25223.8%Speak English less than very well
White (Caucasian) - Speak only English
| Native: | 96.8% (11,108) |
| Foreign-born: | 55.3% (129) |
White (Caucasian) - Speak another language
| Native: | 3.2% (371) |
| Foreign-born: | 42.0% (98) |
Asian - Speak only English
| Native: | 83.9% (243) |
| Foreign-born: | 15.5% (121) |
Asian - Speak another language
| Native: | 21.2% (62) |
| Foreign-born: | 84.3% (658) |
Other race - Speak only English
| Native: | 87.7% (114) |
| Foreign-born: | 15.0% (38) |
Other race - Speak another language
| Native: | 10.0% (13) |
| Foreign-born: | 83.1% (211) |
Two or more races - Speak another language
| Native: | 11.5% (44) |
| Foreign-born: | 100.0% (74) |
White alone - Speak only English
| Native: | 96.6% (11,153) |
| Foreign-born: | 52.3% (133) |
White alone - Speak another language
| Native: | 3.5% (400) |
| Foreign-born: | 44.7% (114) |
Foreign-born residents in Powell
1,210 residents are foreign born (6.8% Asia, 1.2% Europe).
| This city: | 8.2% |
| Ohio: | 4.9% |


Marital status for residents in Powell
Marital status - White (Caucasian) population 15 years and over
- Males
- 18.9%Never married
- 70.8%Now married
- 0.4%Separated
- 1.3%Widowed
- 8.6%Divorced
- Females
- 17.5%Never married
- 67.0%Now married
- 0.0%Separated
- 7.3%Widowed
- 8.2%Divorced
Women who gave birth in the past 12 months
| Now married: | 100.0% (77) |
| Unmarried: | 0.0% (0) |
Women who did not give birth in the past 12 months
| Now married: | 65.0% (1,525) |
| Unmarried: | 35.0% (821) |
Marital status - Black or African American population 15 years and over
- Males
- 9.4%Never married
- 87.5%Now married
- 0.0%Separated
- 3.1%Widowed
- 0.0%Divorced
- Females
- 42.5%Never married
- 32.9%Now married
- 0.0%Separated
- 24.7%Widowed
- 0.0%Divorced
Women who did not give birth in the past 12 months
| Now married: | 0.0% (0) |
| Unmarried: | 100.0% (28) |
Marital status - Asian population 15 years and over
- Males
- 15.7%Never married
- 79.0%Now married
- 0.0%Separated
- 0.0%Widowed
- 5.4%Divorced
- Females
- 1.6%Never married
- 79.6%Now married
- 0.0%Separated
- 3.5%Widowed
- 15.3%Divorced
Women who gave birth in the past 12 months
| Now married: | 100.0% (47) |
| Unmarried: | 0.0% (0) |
Women who did not give birth in the past 12 months
| Now married: | 81.5% (175) |
| Unmarried: | 18.5% (40) |
Marital status - Other race population 15 years and over
- Males
- 34.3%Never married
- 65.7%Now married
- 0.0%Separated
- 0.0%Widowed
- 0.0%Divorced
- Females
- 23.6%Never married
- 19.4%Now married
- 0.0%Separated
- 0.0%Widowed
- 57.0%Divorced
Women who did not give birth in the past 12 months
| Now married: | 13.8% (22) |
| Unmarried: | 86.2% (140) |
Marital status - Two or more races population 15 years and over
- Males
- 44.4%Never married
- 33.3%Now married
- 0.0%Separated
- 22.2%Widowed
- 0.0%Divorced
- Females
- 30.1%Never married
- 49.6%Now married
- 0.0%Separated
- 20.3%Widowed
- 0.0%Divorced
Women who did not give birth in the past 12 months
| Now married: | 51.2% (62) |
| Unmarried: | 48.8% (59) |
Marital status - White alone, not Hispanic / Latino population 15 years and over
- Males
- 18.9%Never married
- 70.8%Now married
- 0.4%Separated
- 1.3%Widowed
- 8.6%Divorced
- Females
- 17.5%Never married
- 67.0%Now married
- 0.0%Separated
- 7.3%Widowed
- 8.2%Divorced
Women who gave birth in the past 12 months
| Now married: | 100.0% (78) |
| Unmarried: | 0.0% (0) |
Women who did not give birth in the past 12 months
| Now married: | 65.0% (1,527) |
| Unmarried: | 35.0% (822) |
Marital status - Hispanic or Latino population 15 years and over
- Males
- 84.4%Never married
- 15.6%Now married
- 0.0%Separated
- 0.0%Widowed
- 0.0%Divorced
- Females
- 0.0%Never married
- 50.0%Now married
- 0.0%Separated
- 3.3%Widowed
- 46.7%Divorced
Women who did not give birth in the past 12 months
| Now married: | 33.3% (16) |
| Unmarried: | 66.7% (32) |
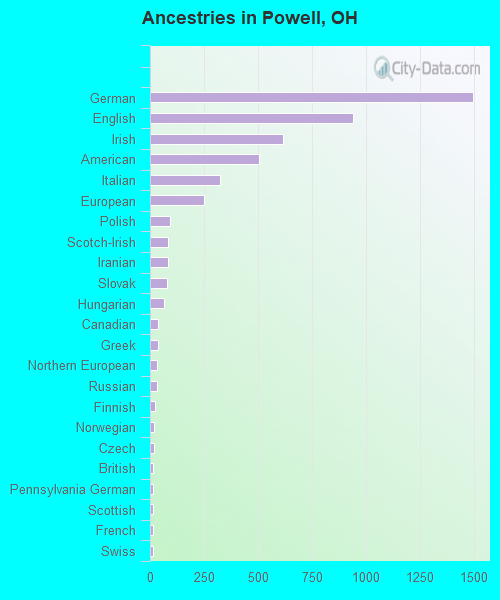
Ancestries in Powell

- 1,49723.2%German
- 94214.6%English
- 6169.6%Irish
- 5077.9%American
- 3265.1%Italian
- 2513.9%European
- 941.5%Polish
- 851.3%Scotch-Irish
- 841.3%Iranian
- 771.2%Slovak
- 661.0%Hungarian
- 350.5%Canadian
- 350.5%Greek
- 320.5%Northern European
- 320.5%Russian
- 210.3%Finnish
- 180.3%Norwegian
- 170.3%Czech
- 160.2%British
- 160.2%Pennsylvania German
- 160.2%Scottish
- 150.2%French
- 150.2%Swiss
- 120.2%Welsh
- 80.1%Swedish
- 50.08%Lithuanian
- 20.03%African
Geographical mobility in Powell

- Same house 1 year ago
- 11,47595.1%White (Caucasian)
- 17980.7%Black or African American
- 1631.9%American Indian / Alaska Native
- 90381.3%Asian
- 38498.6%Other race
- 48993.0%Two or more races
- 11,57395.3%White alone, not Hispanic / Latino
- 9083.2%Hispanic or Latino

-
- Moved within same county
- 550.5%White / Caucasian
- 31.3%Black or African American
- 40.8%Two or more races
- 550.5%White alone, not Hispanic / Latino
- 21.6%Hispanic or Latino

-
- Moved within same state
- 3883.2%White / Caucasian
- 3515.7%Black or African American
- 11210.1%Asian
- 366.9%Two or more races
- 3783.1%White alone, not Hispanic / Latino
- 2018.6%Hispanic or Latino

-
- Moved from different state
- 1431.2%White / Caucasian
- 4183.4%American Indian / Alaska Native
- 615.5%Asian
- 1361.1%White alone, not Hispanic / Latino

Children Nativity (place of birth) in Powell
Place of birth for residents in Powell
![Place of birth for the foreign-born population - Regions]()
- 977Asia
- 754South Central Asia
- 170Europe
- 111South Eastern Asia
- 82Eastern Asia
- 82China
- 64Northern Europe
- 48Eastern Europe
- 39Western Europe
- 35Americas
- 29Latin America
- 29Central America
- 28Western Asia
- 23Oceania
- 23Australia and New Zealand Subregion
- 18Southern Europe
- 6Northern America
- 2Africa
- 2Eastern Africa

![Place of birth for the foreign-born population - Countries]()
- 632India
- 97Philippines
- 82China
- 47United Kingdom
- 43Iran
- 39Germany
- 39Sri Lanka
- 38Pakistan
- 29Guatemala
- 28Israel
- 23New Zealand
- 18Italy
- 18Russia
- 17England
- 14Vietnam
- 6Canada

Zip codes: 43065.