Races in Powell, Tennessee (TN) Detailed Stats
Ancestries, Foreign-born residents, place of birth
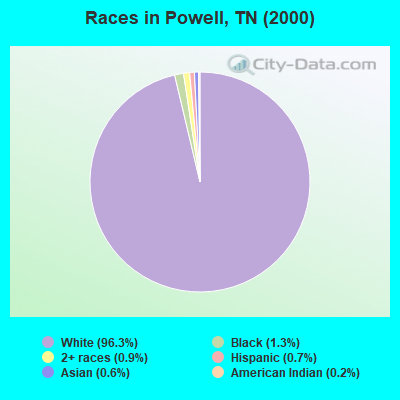
Race distribution in Powell

- 13,09496.3%White alone
- 1741.3%Black alone
- 1290.9%Two or more races
- 910.7%Hispanic
- 760.6%Asian alone
- 260.2%American Indian alone
- 60.04%Native Hawaiian and Other
Pacific Islander alone - 40.03%Other race alone
2000
2022
-
- 4,505,93079.2%White alone
- 928,20416.3%Black alone
- 123,8382.2%Hispanic
- 54,8241.0%Two or more races
- 56,0771.0%Asian alone
- 13,8200.2%American Indian alone
- 4,7800.08%Other race alone
- 1,8100.03%Native Hawaiian and Other
Pacific Islander alone

-
- 5,070,02671.9%White alone
- 1,089,73815.5%Black alone
- 442,6296.3%Hispanic
- 279,3814.0%Two or more races
- 131,8171.9%Asian alone
- 26,9720.4%Other race alone
- 6,3870.09%American Indian alone
- 4,3890.06%Native Hawaiian and Other
Pacific Islander alone

Income and house value in Powell
- Median household income in 2022
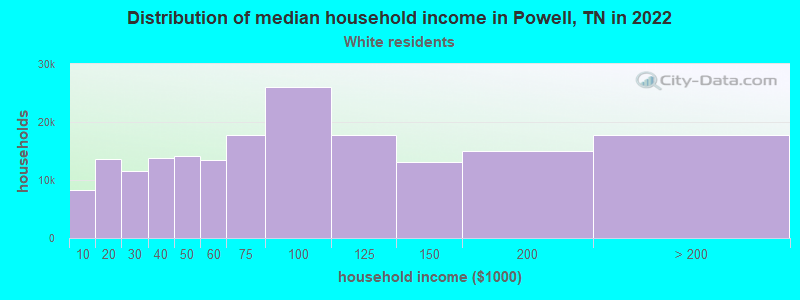
- $79,270White non-Hispanic householders
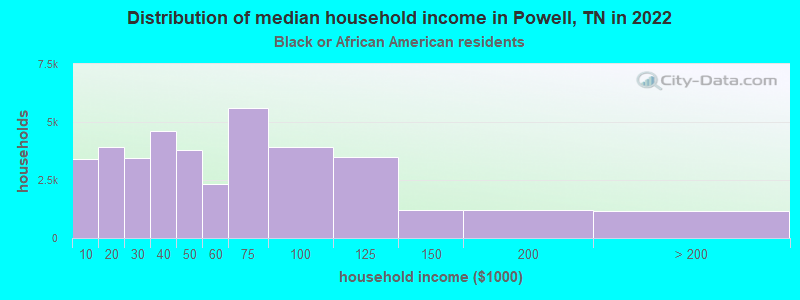
- $115,755Black householders
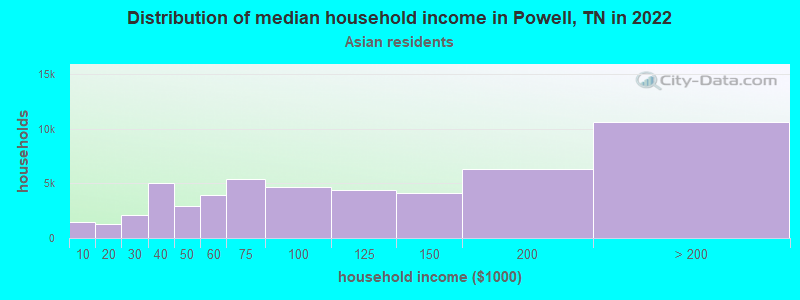
- $125,250Asian householders
- $100,904Two or more races householders
- Median 2022 house value
- $324,228White Non-Hispanic householders
- $417,092Black or African American householders
- $542,507Asian householders
- $303,166Native Hawaiian and other Pacific Islander householders
- $261,361Two or more races householders
Household income for White non-Hispanic householders
Household income for Black householders
Household income for Asian householders
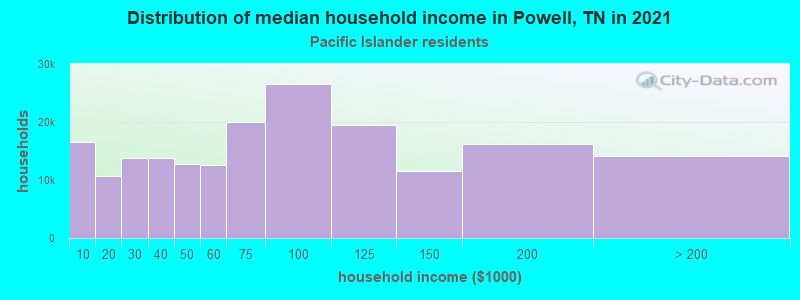
Household income for Native Hawaiian and other Pacific Islander householders
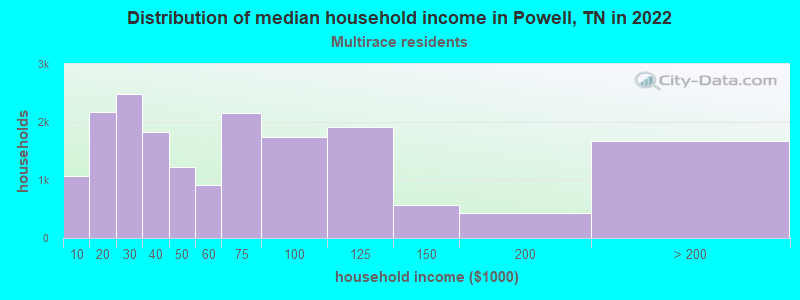
Household income for Two or more races householders
Zip code: 37849