Races in Prairie Village, Kansas (KS) Detailed Stats
Data:
Races - White alone (%)
Races - White alone (% change since 2000)
Races - Black alone (%)
Races - Black alone (% change since 2000)
Races - American Indian alone (%)
Races - American Indian alone (% change since 2000)
Races - Asian alone (%)
Races - Asian alone (% change since 2000)
Races - Hispanic (%)
Races - Hispanic (% change since 2000)
Races - Native Hawaiian and Other Pacific Islander alone (%)
Races - Native Hawaiian and Other Pacific Islander alone (% change since 2000)
Races - Two or more races(%)
Races - Two or more races(% change since 2000)
Races - Other race alone (%)
Races - Other race alone (% change since 2000)
Racial diversity
Place of birth - Born in state of residence (%)
Place of birth - Born in state of residence (%) - White
Place of birth - Born in state of residence (%) - Black or African American
Place of birth - Born in state of residence (%) - Asian
Place of birth - Born in state of residence (%) - Hispanic or Latino
Place of birth - Born in state of residence (%) - American Indian and Alaska Native
Place of birth - Born in state of residence (%) - Multirace
Place of birth - Born in state of residence (%) - Other Race
Place of birth - Born in other state (%)
Place of birth - Born in other state (%) - White
Place of birth - Born in other state (%) - Black or African American
Place of birth - Born in other state (%) - Asian
Place of birth - Born in other state (%) - Hispanic or Latino
Place of birth - Born in other state (%) - American Indian and Alaska Native
Place of birth - Born in other state (%) - Multirace
Place of birth - Born in other state (%) - Other Race
Place of birth - Native, outside of US (%)
Place of birth - Native, outside of US (%) - White
Place of birth - Native, outside of US (%) - Black or African American
Place of birth - Native, outside of US (%) - Asian
Place of birth - Native, outside of US (%) - Hispanic or Latino
Place of birth - Native, outside of US (%) - American Indian and Alaska Native
Place of birth - Native, outside of US (%) - Multirace
Place of birth - Native, outside of US (%) - Other Race
Place of birth - Foreign born (%)
Place of birth - Foreign born (%) - White
Place of birth - Foreign born (%) - Black or African American
Place of birth - Foreign born (%) - Asian
Place of birth - Foreign born (%) - Hispanic or Latino
Place of birth - Foreign born (%) - American Indian and Alaska Native
Place of birth - Foreign born (%) - Multirace
Place of birth - Foreign born (%) - Other Race
Residents speaking English at home (%)
Residents speaking English at home - Born in the United States (%)
Residents speaking English at home - Native, born elsewhere (%)
Residents speaking English at home - Foreign born (%)
Residents speaking Spanish at home (%)
Residents speaking Spanish at home - Born in the United States (%)
Residents speaking Spanish at home - Native, born elsewhere (%)
Residents speaking Spanish at home - Foreign born (%)
Residents speaking other language at home (%)
Residents speaking other language at home - Born in the United States (%)
Residents speaking other language at home - Native, born elsewhere (%)
Residents speaking other language at home - Foreign born (%)
Marital status - Never married (%)
Marital status - Now married (%)
Marital status - Separated (%)
Marital status - Widowed (%)
Marital status - Divorced (%)
Ancestries Reported - Arab (%)
Ancestries Reported - Czech (%)
Ancestries Reported - Danish (%)
Ancestries Reported - Dutch (%)
Ancestries Reported - English (%)
Ancestries Reported - French (%)
Ancestries Reported - French Canadian (%)
Ancestries Reported - German (%)
Ancestries Reported - Greek (%)
Ancestries Reported - Hungarian (%)
Ancestries Reported - Irish (%)
Ancestries Reported - Italian (%)
Ancestries Reported - Lithuanian (%)
Ancestries Reported - Norwegian (%)
Ancestries Reported - Polish (%)
Ancestries Reported - Portuguese (%)
Ancestries Reported - Russian (%)
Ancestries Reported - Scotch-Irish (%)
Ancestries Reported - Scottish (%)
Ancestries Reported - Slovak (%)
Ancestries Reported - Subsaharan African (%)
Ancestries Reported - Swedish (%)
Ancestries Reported - Swiss (%)
Ancestries Reported - Ukrainian (%)
Ancestries Reported - United States (%)
Ancestries Reported - Welsh (%)
Ancestries Reported - West Indian (%)
Ancestries Reported - Other (%)
Geographical mobility - Same house 1 year ago (%)
Geographical mobility - Same house 1 year ago (%) - White
Geographical mobility - Same house 1 year ago (%) - Black or African American
Geographical mobility - Same house 1 year ago (%) - Asian
Geographical mobility - Same house 1 year ago (%) - Hispanic or Latino
Geographical mobility - Same house 1 year ago (%) - American Indian and Alaska Native
Geographical mobility - Same house 1 year ago (%) - Multirace
Geographical mobility - Same house 1 year ago (%) - Other Race
Geographical mobility - Moved within same county (%)
Geographical mobility - Moved within same county (%) - White
Geographical mobility - Moved within same county (%) - Black or African American
Geographical mobility - Moved within same county (%) - Asian
Geographical mobility - Moved within same county (%) - Hispanic or Latino
Geographical mobility - Moved within same county (%) - American Indian and Alaska Native
Geographical mobility - Moved within same county (%) - Multirace
Geographical mobility - Moved within same county (%) - Other Race
Geographical mobility - Moved from different county within same state (%)
Geographical mobility - Moved from different county within same state (%) - White
Geographical mobility - Moved from different county within same state (%) - Black or African American
Geographical mobility - Moved from different county within same state (%) - Asian
Geographical mobility - Moved from different county within same state (%) - Hispanic or Latino
Geographical mobility - Moved from different county within same state (%) - American Indian and Alaska Native
Geographical mobility - Moved from different county within same state (%) - Multirace
Geographical mobility - Moved from different county within same state (%) - Other Race
Geographical mobility - Moved from different state (%)
Geographical mobility - Moved from different state (%) - White
Geographical mobility - Moved from different state (%) - Black or African American
Geographical mobility - Moved from different state (%) - Asian
Geographical mobility - Moved from different state (%) - Hispanic or Latino
Geographical mobility - Moved from different state (%) - American Indian and Alaska Native
Geographical mobility - Moved from different state (%) - Multirace
Geographical mobility - Moved from different state (%) - Other Race
Geographical mobility - Moved from abroad (%)
Geographical mobility - Moved from abroad (%) - White
Geographical mobility - Moved from abroad (%) - Black or African American
Geographical mobility - Moved from abroad (%) - Asian
Geographical mobility - Moved from abroad (%) - Hispanic or Latino
Geographical mobility - Moved from abroad (%) - American Indian and Alaska Native
Geographical mobility - Moved from abroad (%) - Multirace
Geographical mobility - Moved from abroad (%) - Other Race
Place of birth for the foreign-born population - Ireland (%)
Place of birth for the foreign-born population - Denmark (%)
Place of birth for the foreign-born population - Norway (%)
Place of birth for the foreign-born population - Sweden (%)
Place of birth for the foreign-born population - United Kingdom (%)
Place of birth for the foreign-born population - England (%)
Place of birth for the foreign-born population - Scotland (%)
Place of birth for the foreign-born population - Other Northern Europe (%)
Place of birth for the foreign-born population - Austria (%)
Place of birth for the foreign-born population - Belgium (%)
Place of birth for the foreign-born population - France (%)
Place of birth for the foreign-born population - Germany (%)
Place of birth for the foreign-born population - Netherlands (%)
Place of birth for the foreign-born population - Switzerland (%)
Place of birth for the foreign-born population - Other Western Europe (%)
Place of birth for the foreign-born population - Greece (%)
Place of birth for the foreign-born population - Italy (%)
Place of birth for the foreign-born population - Portugal (%)
Place of birth for the foreign-born population - Spain (%)
Place of birth for the foreign-born population - Other Southern Europe (%)
Place of birth for the foreign-born population - Albania (%)
Place of birth for the foreign-born population - Belarus (%)
Place of birth for the foreign-born population - Bosnia and Herzegovina (%)
Place of birth for the foreign-born population - Bulgaria (%)
Place of birth for the foreign-born population - Croatia (%)
Place of birth for the foreign-born population - Czechoslovakia (%)
Place of birth for the foreign-born population - Hungary (%)
Place of birth for the foreign-born population - Latvia (%)
Place of birth for the foreign-born population - Lithuania (%)
Place of birth for the foreign-born population - North Macedonia (Macedonia) (%)
Place of birth for the foreign-born population - Moldova (%)
Place of birth for the foreign-born population - Poland (%)
Place of birth for the foreign-born population - Romania (%)
Place of birth for the foreign-born population - Russia (%)
Place of birth for the foreign-born population - Serbia (%)
Place of birth for the foreign-born population - Ukraine (%)
Place of birth for the foreign-born population - Other Eastern Europe (%)
Place of birth for the foreign-born population - China (%)
Place of birth for the foreign-born population - Hong Kong (%)
Place of birth for the foreign-born population - Taiwan (%)
Place of birth for the foreign-born population - Japan (%)
Place of birth for the foreign-born population - Korea (%)
Place of birth for the foreign-born population - Other Eastern Asia (%)
Place of birth for the foreign-born population - Afghanistan (%)
Place of birth for the foreign-born population - Bangladesh (%)
Place of birth for the foreign-born population - India (%)
Place of birth for the foreign-born population - Iran (%)
Place of birth for the foreign-born population - Kazakhstan (%)
Place of birth for the foreign-born population - Nepal (%)
Place of birth for the foreign-born population - Pakistan (%)
Place of birth for the foreign-born population - Sri Lanka (%)
Place of birth for the foreign-born population - Uzbekistan (%)
Place of birth for the foreign-born population - Other South Central Asia (%)
Place of birth for the foreign-born population - Burma (%)
Place of birth for the foreign-born population - Cambodia (%)
Place of birth for the foreign-born population - Indonesia (%)
Place of birth for the foreign-born population - Laos (%)
Place of birth for the foreign-born population - Malaysia (%)
Place of birth for the foreign-born population - Philippines (%)
Place of birth for the foreign-born population - Singapore (%)
Place of birth for the foreign-born population - Thailand (%)
Place of birth for the foreign-born population - Vietnam (%)
Place of birth for the foreign-born population - Other South Eastern Asia (%)
Place of birth for the foreign-born population - Armenia (%)
Place of birth for the foreign-born population - Iraq (%)
Place of birth for the foreign-born population - Israel (%)
Place of birth for the foreign-born population - Jordan (%)
Place of birth for the foreign-born population - Kuwait (%)
Place of birth for the foreign-born population - Lebanon (%)
Place of birth for the foreign-born population - Saudi Arabia (%)
Place of birth for the foreign-born population - Syria (%)
Place of birth for the foreign-born population - Turkey (%)
Place of birth for the foreign-born population - Yemen (%)
Place of birth for the foreign-born population - Other Western Asia (%)
Place of birth for the foreign-born population - Eritrea (%)
Place of birth for the foreign-born population - Ethiopia (%)
Place of birth for the foreign-born population - Kenya (%)
Place of birth for the foreign-born population - Somalia (%)
Place of birth for the foreign-born population - Uganda (%)
Place of birth for the foreign-born population - Zimbabwe (%)
Place of birth for the foreign-born population - Other Eastern Africa (%)
Place of birth for the foreign-born population - Cameroon (%)
Place of birth for the foreign-born population - Congo (%)
Place of birth for the foreign-born population - Democratic Republic of Congo (Zaire) (%)
Place of birth for the foreign-born population - Other Middle Africa (%)
Place of birth for the foreign-born population - Egypt (%)
Place of birth for the foreign-born population - Morocco (%)
Place of birth for the foreign-born population - Sudan (%)
Place of birth for the foreign-born population - Other Northern Africa (%)
Place of birth for the foreign-born population - South Africa (%)
Place of birth for the foreign-born population - Other Southern Africa (%)
Place of birth for the foreign-born population - Cabo Verde (%)
Place of birth for the foreign-born population - Ghana (%)
Place of birth for the foreign-born population - Liberia (%)
Place of birth for the foreign-born population - Nigeria (%)
Place of birth for the foreign-born population - Senegal (%)
Place of birth for the foreign-born population - Sierra Leone (%)
Place of birth for the foreign-born population - Other Western Africa (%)
Place of birth for the foreign-born population - Australia (%)
Place of birth for the foreign-born population - New Zealand (%)
Place of birth for the foreign-born population - Fiji (%)
Place of birth for the foreign-born population - Micronesia (%)
Place of birth for the foreign-born population - Bahamas (%)
Place of birth for the foreign-born population - Barbados (%)
Place of birth for the foreign-born population - Cuba (%)
Place of birth for the foreign-born population - Dominica (%)
Place of birth for the foreign-born population - Dominican Republic (%)
Place of birth for the foreign-born population - Grenada (%)
Place of birth for the foreign-born population - Haiti (%)
Place of birth for the foreign-born population - Jamaica (%)
Place of birth for the foreign-born population - St. Vincent and the Grenadines (%)
Place of birth for the foreign-born population - Trinidad and Tobago (%)
Place of birth for the foreign-born population - West Indies (%)
Place of birth for the foreign-born population - Other Caribbean (%)
Place of birth for the foreign-born population - Belize (%)
Place of birth for the foreign-born population - Costa Rica (%)
Place of birth for the foreign-born population - El Salvador (%)
Place of birth for the foreign-born population - Guatemala (%)
Place of birth for the foreign-born population - Honduras (%)
Place of birth for the foreign-born population - Mexico (%)
Place of birth for the foreign-born population - Nicaragua (%)
Place of birth for the foreign-born population - Panama (%)
Place of birth for the foreign-born population - Other Central America (%)
Place of birth for the foreign-born population - Argentina (%)
Place of birth for the foreign-born population - Bolivia (%)
Place of birth for the foreign-born population - Brazil (%)
Place of birth for the foreign-born population - Chile (%)
Place of birth for the foreign-born population - Colombia (%)
Place of birth for the foreign-born population - Ecuador (%)
Place of birth for the foreign-born population - Guyana (%)
Place of birth for the foreign-born population - Peru (%)
Place of birth for the foreign-born population - Uruguay (%)
Place of birth for the foreign-born population - Venezuela (%)
Place of birth for the foreign-born population - Other South America (%)
Place of birth for the foreign-born population - Canada (%)
Place of birth for the foreign-born population - Other Northern America (%)
Place of birth for the foreign-born population - Other (%)
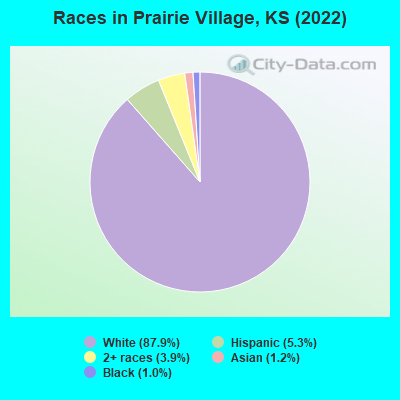
According to 2022 data, the most numerous races in Prairie Village, KS are White alone (20,432 residents), Hispanic (1,233 residents), and Black alone (233 residents). 98.0% of Prairie Village residents speak English at home. 2.8% of Prairie Village, KS residents are foreign-born (1.1% born in Asia, 0.8% born in Europe, 0.7% born in Latin America), which is 148.7% less than the foreign-born rate of 7.0% across the entire state of Kansas.
Race distribution in Prairie Village
2000 2022
2,233,997 83.1% White alone 188,252 7.0% Hispanic 151,407 5.6% Black alone 46,301 1.7% Asian alone 42,508 1.6% Two or more races 22,322 0.8% American Indian alone 2,477 0.09% Other race alone 1,154 0.04% Native Hawaiian and Other
2,147,943 73.1% White alone 381,746 13.0% Hispanic 147,666 5.0% Black alone 145,362 4.9% Two or more races 85,085 2.9% Asian alone 13,263 0.5% Other race alone 12,065 0.4% American Indian alone 4,020 0.1% Native Hawaiian and Other
Income and house value in Prairie Village Median household income in 2022 $93,729 White non-Hispanic householders$124,729 Asian householders$100,066 Two or more races householders$118,634 Hispanic or Latino race householdersMedian 2022 house value $401,395 White Non-Hispanic householders$324,028 Black or African American householders$392,545 American Indian or Alaska Native householders $449,642 Asian householders$265,503 Some other race householders$389,404 Two or more races householders$299,190 Hispanic or Latino householders
Median age by race in Prairie Village
42.5 Median age for White residents42.7 42.3 36.8 Median age for Black or African American residents39.1 31.8 -663,316,582.3 Median age for American Indian / Alaska Native residents-657,836,643.9 -627,147,765.7 37.0 Median age for Asian residents35.8 49.3 -1,068,376,067.3 Median age for Native Hawaiian / Pacific Islander residents-669,240,668.6 -641,269,840.6 54.9 Median age for Other race residents-713,557,593.6 53.2 18.0 Median age for Two or more races residents18.9 18.8 42.3 Median age for White alone residents42.7 42.2 28.8 Median age for Hispanic or Latino residents27.8 33.2
Owner/renter occupied households by race in Prairie Village
House owners and renters - White residents 7,103 74.2% Owner occupied2,468 25.8% Renter occupiedHouse owners and renters - Black or African American residents 40 33.6% Owner occupied80 66.4% Renter occupiedHouse owners and renters - American Indian / Alaska Native residents 29 100.0% Owner occupiedHouse owners and renters - Asian residents 140 87.6% Owner occupied20 12.4% Renter occupiedHouse owners and renters - Other race residents 7 100.0% Owner occupiedHouse owners and renters - Two or more races residents 263 51.3% Owner occupied249 48.7% Renter occupiedHouse owners and renters - White alone residents 7,053 74.4% Owner occupied2,422 25.6% Renter occupiedHouse owners and renters - Hispanic or Latino residents 196 55.3% Owner occupied159 44.7% Renter occupied
Language usage in Prairie Village
English speakers - Total 98.0% of residents of Prairie Village speak English at home.
1.0% of residents speak Spanish at home 139 64.1% Speak English very well78 35.9% Speak English less than very well1.8% of residents speak other language at home 262 66.7% Speak English very well131 33.3% Speak English less than very well
English speakers - Born in the United States 98.3% of residents of Prairie Village speak English at home.
0.6% of residents speak Spanish at home 70 82.4% Speak English very well15 17.6% Speak English less than very well1.0% of residents speak other language at home 86 60.6% Speak English very well56 39.4% Speak English less than very well
English speakers - Native, born elsewhere 92.4% of residents of Prairie Village speak English at home.
1.7% of residents speak Spanish at home 3 100.0% Speak English very well8.7% of residents speak other language at home 15 100.0% Speak English very well
English speakers - Foreign-born 45.8% of residents of Prairie Village speak English at home.
15.1% of residents speak Spanish at home 46 48.4% Speak English very well49 51.6% Speak English less than very well37.5% of residents speak other language at home 170 72.0% Speak English very well66 28.0% Speak English less than very well
White (Caucasian) - Speak only English Native:
99.7% (19,361)Foreign-born:
72.0% (157)
White (Caucasian) - Speak another language Native:
0.8% (158)Foreign-born:
39.7% (87)
Black or African American - Speak only English Native:
99.9% (231)Foreign-born:
24.4% (9)
Asian - Speak only English Native:
66.9% (64)Foreign-born:
17.3% (32)
Asian - Speak another language Native:
31.0% (30)Foreign-born:
82.3% (154)
Two or more races - Speak only English Native:
96.0% (1,134)Foreign-born:
67.7% (109)
Two or more races - Speak another language Native:
2.7% (32)Foreign-born:
24.7% (40)
White alone - Speak only English Native:
99.1% (18,895)Foreign-born:
70.4% (151)
White alone - Speak another language Native:
0.9% (174)Foreign-born:
30.3% (65)
Hispanic or Latino - Speak only English Native:
100.0% (1,059)Foreign-born:
13.1% (14)
Hispanic or Latino - Speak another language Native:
5.4% (57)Foreign-born:
88.3% (95)
Foreign-born residents in Prairie Village 654 residents are foreign born (1.1% Asia , 0.8% Europe , 0.7% Latin America ).
This city:
2.8%Kansas:
7.1%
Marital status for residents in Prairie Village Marital status - White (Caucasian) population 15 years and over
Males 26.1% Never married63.7% Now married0.7% Separated2.9% Widowed6.6% DivorcedFemales 24.7% Never married51.2% Now married0.3% Separated8.4% Widowed15.5% DivorcedWomen who gave birth in the past 12 months Now married:
94.9% (284)Unmarried:
5.1% (15)
Women who did not give birth in the past 12 months Now married:
50.3% (2,319)Unmarried:
49.7% (2,292)
Marital status - Black or African American population 15 years and over
Males 45.5% Never married54.5% Now married0.0% Separated0.0% Widowed0.0% DivorcedFemales 74.1% Never married20.4% Now married0.0% Separated0.0% Widowed5.6% DivorcedWomen who did not give birth in the past 12 months Now married:
21.6% (24)Unmarried:
78.4% (87)
Marital status - American Indian / Alaska Native population 15 years and over
Males 0.0% Never married0.0% Now married100.0% Separated0.0% Widowed0.0% DivorcedFemales 0.0% Never married100.0% Now married0.0% Separated0.0% Widowed0.0% DivorcedWomen who did not give birth in the past 12 months Now married:
100.0% (9)Unmarried:
0.0% (0)
Marital status - Asian population 15 years and over
Males 0.0% Never married100.0% Now married0.0% Separated0.0% Widowed0.0% DivorcedFemales 17.4% Never married79.0% Now married0.0% Separated0.0% Widowed3.6% DivorcedWomen who did not give birth in the past 12 months Now married:
71.7% (67)Unmarried:
28.3% (26)
Marital status - Other race population 15 years and over
Males 100.0% Never married0.0% Now married0.0% Separated0.0% Widowed0.0% DivorcedFemales 21.7% Never married30.4% Now married0.0% Separated47.8% Widowed0.0% DivorcedWomen who did not give birth in the past 12 months Now married:
0.0% (0)Unmarried:
100.0% (7)
Marital status - Two or more races population 15 years and over
Males 42.1% Never married57.6% Now married0.0% Separated0.0% Widowed0.3% DivorcedFemales 49.2% Never married38.6% Now married0.0% Separated0.0% Widowed12.2% DivorcedWomen who did not give birth in the past 12 months Now married:
34.3% (121)Unmarried:
65.7% (231)
Marital status - White alone, not Hispanic / Latino population 15 years and over
Males 25.5% Never married64.1% Now married0.8% Separated3.0% Widowed6.7% DivorcedFemales 24.9% Never married51.3% Now married0.3% Separated8.5% Widowed15.0% DivorcedWomen who gave birth in the past 12 months Now married:
94.9% (291)Unmarried:
5.1% (16)
Women who did not give birth in the past 12 months Now married:
50.5% (2,337)Unmarried:
49.5% (2,290)
Marital status - Hispanic or Latino population 15 years and over
Males 53.1% Never married43.8% Now married0.0% Separated0.0% Widowed3.1% DivorcedFemales 10.2% Never married56.2% Now married0.0% Separated3.9% Widowed29.7% DivorcedWomen who did not give birth in the past 12 months Now married:
57.9% (124)Unmarried:
42.1% (90)
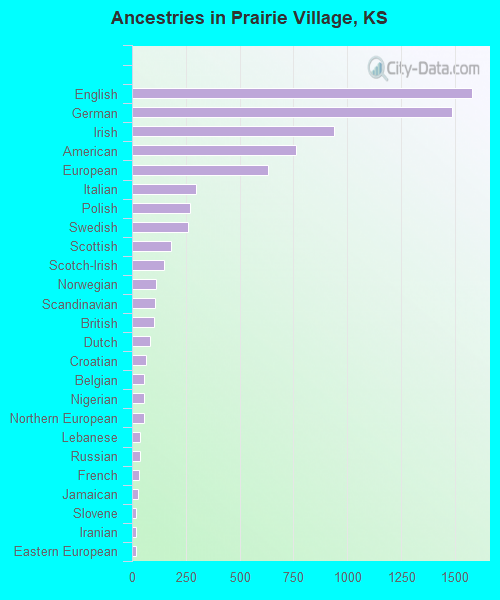
Ancestries in Prairie Village
1,579 18.3% English1,485 17.2% German939 10.9% Irish763 8.8% American631 7.3% European298 3.4% Italian271 3.1% Polish259 3.0% Swedish183 2.1% Scottish148 1.7% Scotch-Irish111 1.3% Norwegian106 1.2% Scandinavian102 1.2% British84 1.0% Dutch67 0.8% Croatian56 0.6% Belgian56 0.6% Nigerian54 0.6% Northern European38 0.4% Lebanese36 0.4% Russian31 0.4% French29 0.3% Jamaican20 0.2% Slovene19 0.2% Iranian18 0.2% Eastern European16 0.2% Czech12 0.1% Danish10 0.1% Greek9 0.1% Welsh8 0.09% Pennsylvania German7 0.08% Serbian6 0.07% Czechoslovakian5 0.06% Luxembourger5 0.06% Trinidadian and Tobagonian4 0.05% Slavic1 0.01% Swiss
Geographical mobility in Prairie Village Same house 1 year ago 18,062 88.3% White (Caucasian)138 51.5% Black or African American30 75.5% American Indian / Alaska Native208 73.1% Asian47 100.0% Other race1,257 78.4% Two or more races17,867 88.4% White alone, not Hispanic / Latino1,048 86.3% Hispanic or LatinoMoved within same county 987 4.8% White / Caucasian32 12.1% Black or African American7 17.7% American Indian / Alaska Native35 12.5% Asian133 8.3% Two or more races1,006 5.0% White alone, not Hispanic / Latino57 4.7% Hispanic or LatinoMoved within same state 222 1.1% White / Caucasian69 26.0% Black or African American5 1.8% Asian32 2.0% Two or more races192 1.0% White alone, not Hispanic / Latino42 3.5% Hispanic or LatinoMoved from different state 1,236 6.0% White / Caucasian25 9.4% Black or African American23 8.0% Asian123 7.7% Two or more races1,198 5.9% White alone, not Hispanic / Latino49 4.1% Hispanic or LatinoMoved from abroad 18 0.1% White23 8.6% Black or African American20 0.1% White alone, not Hispanic / Latino
Children Nativity (place of birth) in Prairie Village
Children under 6 years - Living with two parents Both parents native 1,474 100.0% NativeOne native, one foreign-born parent 74 100.0% NativeChildren under 6 years - Living with one parent Native parent 74 100.0% NativeChildren 6 to 17 years - Living with two parents Both parents native 2,741 99.4% Native16 0.6% Foreign-bornBoth parents foreign-born 18 100.0% NativeOne native, one foreign-born parent 109 100.0% NativeChildren 6 to 17 years - Living with one parent Native parent 476 100.0% NativeForeign-born parent 8 55.0% Native6 45.0% Foreign-born