Races in Priest Point, Washington (WA) Detailed Stats
Ancestries, Foreign-born residents, place of birth

Recent posts about races in Priest Point, Washington on our local forum with over 2,400,000 registered users:

4.0% of Priest Point, WA residents are foreign-born (1.4% born in Latin America, 1.0% born in North America, 0.6% born in Europe, 0.6% born in Asia), which is 276.9% less than the foreign-born rate of 15.0% across the entire state of Washington.
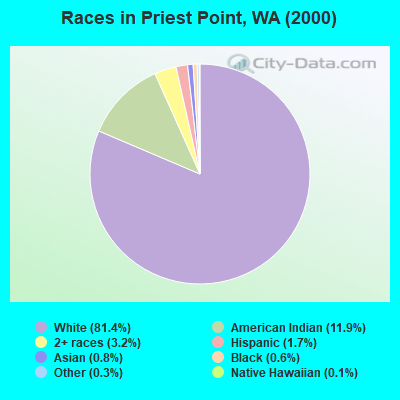
Race distribution in Priest Point

- 63481.4%White alone
- 9311.9%American Indian alone
- 253.2%Two or more races
- 131.7%Hispanic
- 60.8%Asian alone
- 50.6%Black alone
- 20.3%Other race alone
- 10.1%Native Hawaiian and Other
Pacific Islander alone
2000
2022
-
- 4,652,49078.9%White alone
- 441,5097.5%Hispanic
- 319,4015.4%Asian alone
- 184,6313.1%Black alone
- 175,9263.0%Two or more races
- 85,3961.4%American Indian alone
- 22,7790.4%Native Hawaiian and Other
Pacific Islander alone - 11,9890.2%Other race alone

-
- 4,941,45663.5%White alone
- 1,093,31314.0%Hispanic
- 755,8329.7%Asian alone
- 523,4486.7%Two or more races
- 299,5373.8%Black alone
- 69,0240.9%American Indian alone
- 52,2310.7%Native Hawaiian and Other
Pacific Islander alone - 50,9450.7%Other race alone

Income and house value in Priest Point
- Median household income in 2022
- $94,780White non-Hispanic householders
- $165,588Black householders
- over $200,000American Indian and Alaska Native householders
- $94,937Asian householders
- $123,873Two or more races householders
- $44,713Hispanic or Latino race householders
- Median 2022 house value
- over $1,000,000White Non-Hispanic householders
- $819,461American Indian or Alaska Native householders
- over $1,000,000Hispanic or Latino householders
Household income for White non-Hispanic householders

Household income for Black householders

Household income for American Indian and Alaska Native householders

Household income for Asian householders

Household income for Two or more races householders

Household income for Hispanic or Latino race householders

Foreign-born residents in Priest Point
31 residents are foreign born (1.4% Latin America, 1.0% North America, 0.6% Europe, 0.6% Asia).
| This city: | 4.0% |
| Washington: | 10.4% |
Ancestries in Priest Point

- 17118.4%English
- 15716.9%Other
- 15116.2%German
- 12213.1%Irish
- 849.0%Norwegian
- 424.5%Swedish
- 303.2%Danish
- 272.9%Dutch
- 252.7%French
- 242.6%Italian
- 212.3%United States
- 151.6%Scotch-Irish
- 151.6%Welsh
- 131.4%French Canadian
- 121.3%Scottish
- 60.6%Czech
- 40.4%Polish
- 40.4%Russian
- 30.3%Portuguese
- 20.2%Greek
- 20.2%Swiss

Zip codes: 98271.