Races in Princeton, Indiana (IN) Detailed Stats
Data:
Races - White alone (%)
Races - White alone (% change since 2000)
Races - Black alone (%)
Races - Black alone (% change since 2000)
Races - American Indian alone (%)
Races - American Indian alone (% change since 2000)
Races - Asian alone (%)
Races - Asian alone (% change since 2000)
Races - Hispanic (%)
Races - Hispanic (% change since 2000)
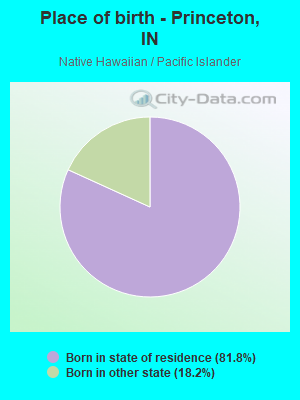
Races - Native Hawaiian and Other Pacific Islander alone (%)
Races - Native Hawaiian and Other Pacific Islander alone (% change since 2000)
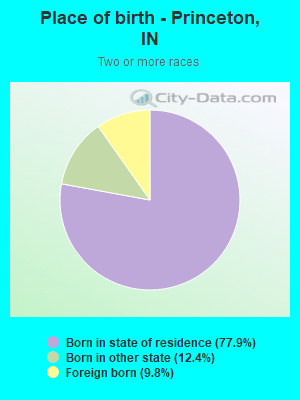
Races - Two or more races(%)
Races - Two or more races(% change since 2000)
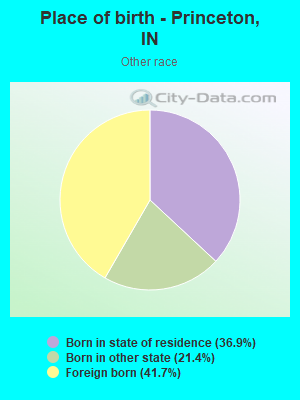
Races - Other race alone (%)
Races - Other race alone (% change since 2000)
Racial diversity
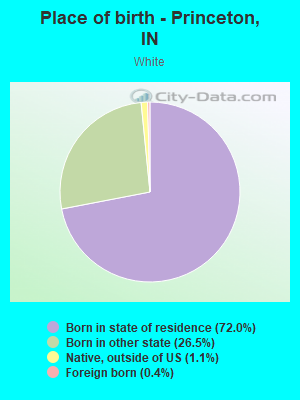
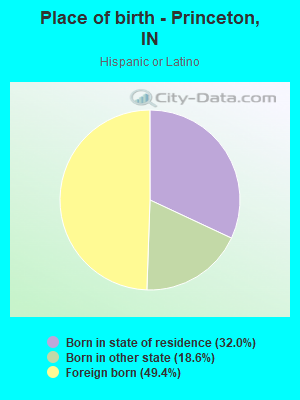
Place of birth - Born in state of residence (%)
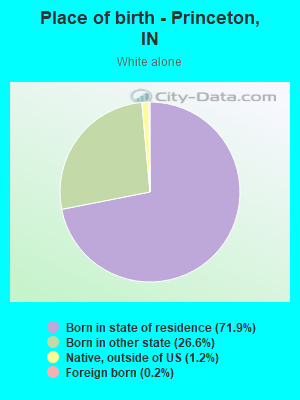
Place of birth - Born in state of residence (%) - White
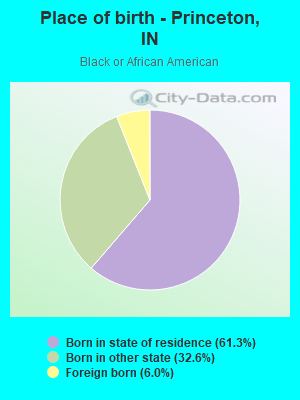
Place of birth - Born in state of residence (%) - Black or African American
Place of birth - Born in state of residence (%) - Asian
Place of birth - Born in state of residence (%) - Hispanic or Latino
Place of birth - Born in state of residence (%) - American Indian and Alaska Native
Place of birth - Born in state of residence (%) - Multirace
Place of birth - Born in state of residence (%) - Other Race
Place of birth - Born in other state (%)
Place of birth - Born in other state (%) - White
Place of birth - Born in other state (%) - Black or African American
Place of birth - Born in other state (%) - Asian
Place of birth - Born in other state (%) - Hispanic or Latino
Place of birth - Born in other state (%) - American Indian and Alaska Native
Place of birth - Born in other state (%) - Multirace
Place of birth - Born in other state (%) - Other Race
Place of birth - Native, outside of US (%)
Place of birth - Native, outside of US (%) - White
Place of birth - Native, outside of US (%) - Black or African American
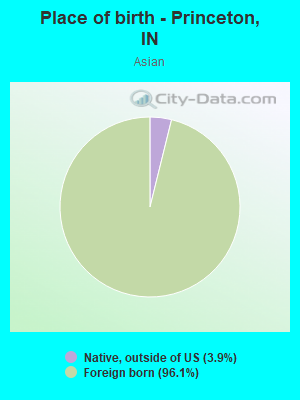
Place of birth - Native, outside of US (%) - Asian
Place of birth - Native, outside of US (%) - Hispanic or Latino
Place of birth - Native, outside of US (%) - American Indian and Alaska Native
Place of birth - Native, outside of US (%) - Multirace
Place of birth - Native, outside of US (%) - Other Race
Place of birth - Foreign born (%)
Place of birth - Foreign born (%) - White
Place of birth - Foreign born (%) - Black or African American
Place of birth - Foreign born (%) - Asian
Place of birth - Foreign born (%) - Hispanic or Latino
Place of birth - Foreign born (%) - American Indian and Alaska Native
Place of birth - Foreign born (%) - Multirace
Place of birth - Foreign born (%) - Other Race
Residents speaking English at home (%)
Residents speaking English at home - Born in the United States (%)
Residents speaking English at home - Native, born elsewhere (%)
Residents speaking English at home - Foreign born (%)
Residents speaking Spanish at home (%)
Residents speaking Spanish at home - Born in the United States (%)
Residents speaking Spanish at home - Native, born elsewhere (%)
Residents speaking Spanish at home - Foreign born (%)
Residents speaking other language at home (%)
Residents speaking other language at home - Born in the United States (%)
Residents speaking other language at home - Native, born elsewhere (%)
Residents speaking other language at home - Foreign born (%)
Marital status - Never married (%)
Marital status - Now married (%)
Marital status - Separated (%)
Marital status - Widowed (%)
Marital status - Divorced (%)
Ancestries Reported - Arab (%)
Ancestries Reported - Czech (%)
Ancestries Reported - Danish (%)
Ancestries Reported - Dutch (%)
Ancestries Reported - English (%)
Ancestries Reported - French (%)
Ancestries Reported - French Canadian (%)
Ancestries Reported - German (%)
Ancestries Reported - Greek (%)
Ancestries Reported - Hungarian (%)
Ancestries Reported - Irish (%)
Ancestries Reported - Italian (%)
Ancestries Reported - Lithuanian (%)
Ancestries Reported - Norwegian (%)
Ancestries Reported - Polish (%)
Ancestries Reported - Portuguese (%)
Ancestries Reported - Russian (%)
Ancestries Reported - Scotch-Irish (%)
Ancestries Reported - Scottish (%)
Ancestries Reported - Slovak (%)
Ancestries Reported - Subsaharan African (%)
Ancestries Reported - Swedish (%)
Ancestries Reported - Swiss (%)
Ancestries Reported - Ukrainian (%)
Ancestries Reported - United States (%)
Ancestries Reported - Welsh (%)
Ancestries Reported - West Indian (%)
Ancestries Reported - Other (%)
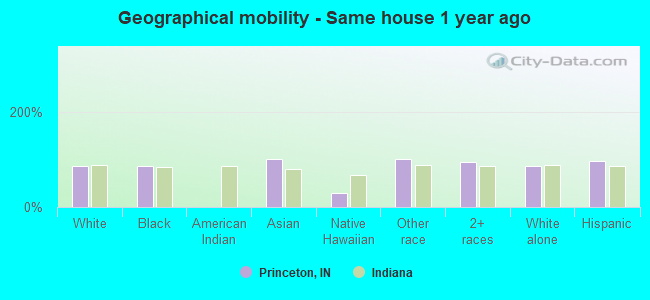
Geographical mobility - Same house 1 year ago (%)
Geographical mobility - Same house 1 year ago (%) - White
Geographical mobility - Same house 1 year ago (%) - Black or African American
Geographical mobility - Same house 1 year ago (%) - Asian
Geographical mobility - Same house 1 year ago (%) - Hispanic or Latino
Geographical mobility - Same house 1 year ago (%) - American Indian and Alaska Native
Geographical mobility - Same house 1 year ago (%) - Multirace
Geographical mobility - Same house 1 year ago (%) - Other Race
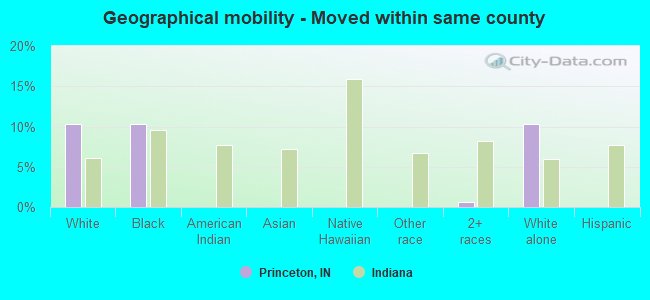
Geographical mobility - Moved within same county (%)
Geographical mobility - Moved within same county (%) - White
Geographical mobility - Moved within same county (%) - Black or African American
Geographical mobility - Moved within same county (%) - Asian
Geographical mobility - Moved within same county (%) - Hispanic or Latino
Geographical mobility - Moved within same county (%) - American Indian and Alaska Native
Geographical mobility - Moved within same county (%) - Multirace
Geographical mobility - Moved within same county (%) - Other Race
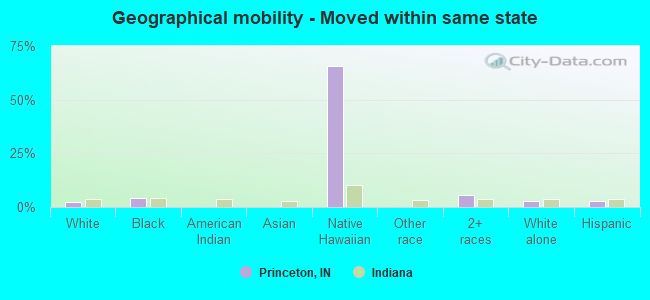
Geographical mobility - Moved from different county within same state (%)
Geographical mobility - Moved from different county within same state (%) - White
Geographical mobility - Moved from different county within same state (%) - Black or African American
Geographical mobility - Moved from different county within same state (%) - Asian
Geographical mobility - Moved from different county within same state (%) - Hispanic or Latino
Geographical mobility - Moved from different county within same state (%) - American Indian and Alaska Native
Geographical mobility - Moved from different county within same state (%) - Multirace
Geographical mobility - Moved from different county within same state (%) - Other Race
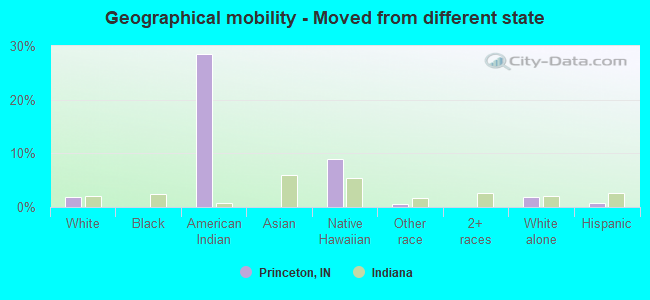
Geographical mobility - Moved from different state (%)
Geographical mobility - Moved from different state (%) - White
Geographical mobility - Moved from different state (%) - Black or African American
Geographical mobility - Moved from different state (%) - Asian
Geographical mobility - Moved from different state (%) - Hispanic or Latino
Geographical mobility - Moved from different state (%) - American Indian and Alaska Native
Geographical mobility - Moved from different state (%) - Multirace
Geographical mobility - Moved from different state (%) - Other Race
Geographical mobility - Moved from abroad (%)
Geographical mobility - Moved from abroad (%) - White
Geographical mobility - Moved from abroad (%) - Black or African American
Geographical mobility - Moved from abroad (%) - Asian
Geographical mobility - Moved from abroad (%) - Hispanic or Latino
Geographical mobility - Moved from abroad (%) - American Indian and Alaska Native
Geographical mobility - Moved from abroad (%) - Multirace
Geographical mobility - Moved from abroad (%) - Other Race
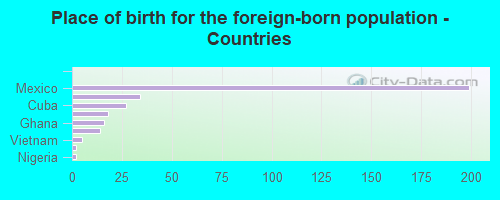
Place of birth for the foreign-born population - Ireland (%)
Place of birth for the foreign-born population - Denmark (%)
Place of birth for the foreign-born population - Norway (%)
Place of birth for the foreign-born population - Sweden (%)
Place of birth for the foreign-born population - United Kingdom (%)
Place of birth for the foreign-born population - England (%)
Place of birth for the foreign-born population - Scotland (%)
Place of birth for the foreign-born population - Other Northern Europe (%)
Place of birth for the foreign-born population - Austria (%)
Place of birth for the foreign-born population - Belgium (%)
Place of birth for the foreign-born population - France (%)
Place of birth for the foreign-born population - Germany (%)
Place of birth for the foreign-born population - Netherlands (%)
Place of birth for the foreign-born population - Switzerland (%)
Place of birth for the foreign-born population - Other Western Europe (%)
Place of birth for the foreign-born population - Greece (%)
Place of birth for the foreign-born population - Italy (%)
Place of birth for the foreign-born population - Portugal (%)
Place of birth for the foreign-born population - Spain (%)
Place of birth for the foreign-born population - Other Southern Europe (%)
Place of birth for the foreign-born population - Albania (%)
Place of birth for the foreign-born population - Belarus (%)
Place of birth for the foreign-born population - Bosnia and Herzegovina (%)
Place of birth for the foreign-born population - Bulgaria (%)
Place of birth for the foreign-born population - Croatia (%)
Place of birth for the foreign-born population - Czechoslovakia (%)
Place of birth for the foreign-born population - Hungary (%)
Place of birth for the foreign-born population - Latvia (%)
Place of birth for the foreign-born population - Lithuania (%)
Place of birth for the foreign-born population - North Macedonia (Macedonia) (%)
Place of birth for the foreign-born population - Moldova (%)
Place of birth for the foreign-born population - Poland (%)
Place of birth for the foreign-born population - Romania (%)
Place of birth for the foreign-born population - Russia (%)
Place of birth for the foreign-born population - Serbia (%)
Place of birth for the foreign-born population - Ukraine (%)
Place of birth for the foreign-born population - Other Eastern Europe (%)
Place of birth for the foreign-born population - China (%)
Place of birth for the foreign-born population - Hong Kong (%)
Place of birth for the foreign-born population - Taiwan (%)
Place of birth for the foreign-born population - Japan (%)
Place of birth for the foreign-born population - Korea (%)
Place of birth for the foreign-born population - Other Eastern Asia (%)
Place of birth for the foreign-born population - Afghanistan (%)
Place of birth for the foreign-born population - Bangladesh (%)
Place of birth for the foreign-born population - India (%)
Place of birth for the foreign-born population - Iran (%)
Place of birth for the foreign-born population - Kazakhstan (%)
Place of birth for the foreign-born population - Nepal (%)
Place of birth for the foreign-born population - Pakistan (%)
Place of birth for the foreign-born population - Sri Lanka (%)
Place of birth for the foreign-born population - Uzbekistan (%)
Place of birth for the foreign-born population - Other South Central Asia (%)
Place of birth for the foreign-born population - Burma (%)
Place of birth for the foreign-born population - Cambodia (%)
Place of birth for the foreign-born population - Indonesia (%)
Place of birth for the foreign-born population - Laos (%)
Place of birth for the foreign-born population - Malaysia (%)
Place of birth for the foreign-born population - Philippines (%)
Place of birth for the foreign-born population - Singapore (%)
Place of birth for the foreign-born population - Thailand (%)
Place of birth for the foreign-born population - Vietnam (%)
Place of birth for the foreign-born population - Other South Eastern Asia (%)
Place of birth for the foreign-born population - Armenia (%)
Place of birth for the foreign-born population - Iraq (%)
Place of birth for the foreign-born population - Israel (%)
Place of birth for the foreign-born population - Jordan (%)
Place of birth for the foreign-born population - Kuwait (%)
Place of birth for the foreign-born population - Lebanon (%)
Place of birth for the foreign-born population - Saudi Arabia (%)
Place of birth for the foreign-born population - Syria (%)
Place of birth for the foreign-born population - Turkey (%)
Place of birth for the foreign-born population - Yemen (%)
Place of birth for the foreign-born population - Other Western Asia (%)
Place of birth for the foreign-born population - Eritrea (%)
Place of birth for the foreign-born population - Ethiopia (%)
Place of birth for the foreign-born population - Kenya (%)
Place of birth for the foreign-born population - Somalia (%)
Place of birth for the foreign-born population - Uganda (%)
Place of birth for the foreign-born population - Zimbabwe (%)
Place of birth for the foreign-born population - Other Eastern Africa (%)
Place of birth for the foreign-born population - Cameroon (%)
Place of birth for the foreign-born population - Congo (%)
Place of birth for the foreign-born population - Democratic Republic of Congo (Zaire) (%)
Place of birth for the foreign-born population - Other Middle Africa (%)
Place of birth for the foreign-born population - Egypt (%)
Place of birth for the foreign-born population - Morocco (%)
Place of birth for the foreign-born population - Sudan (%)
Place of birth for the foreign-born population - Other Northern Africa (%)
Place of birth for the foreign-born population - South Africa (%)
Place of birth for the foreign-born population - Other Southern Africa (%)
Place of birth for the foreign-born population - Cabo Verde (%)
Place of birth for the foreign-born population - Ghana (%)
Place of birth for the foreign-born population - Liberia (%)
Place of birth for the foreign-born population - Nigeria (%)
Place of birth for the foreign-born population - Senegal (%)
Place of birth for the foreign-born population - Sierra Leone (%)
Place of birth for the foreign-born population - Other Western Africa (%)
Place of birth for the foreign-born population - Australia (%)
Place of birth for the foreign-born population - New Zealand (%)
Place of birth for the foreign-born population - Fiji (%)
Place of birth for the foreign-born population - Micronesia (%)
Place of birth for the foreign-born population - Bahamas (%)
Place of birth for the foreign-born population - Barbados (%)
Place of birth for the foreign-born population - Cuba (%)
Place of birth for the foreign-born population - Dominica (%)
Place of birth for the foreign-born population - Dominican Republic (%)
Place of birth for the foreign-born population - Grenada (%)
Place of birth for the foreign-born population - Haiti (%)
Place of birth for the foreign-born population - Jamaica (%)
Place of birth for the foreign-born population - St. Vincent and the Grenadines (%)
Place of birth for the foreign-born population - Trinidad and Tobago (%)
Place of birth for the foreign-born population - West Indies (%)
Place of birth for the foreign-born population - Other Caribbean (%)
Place of birth for the foreign-born population - Belize (%)
Place of birth for the foreign-born population - Costa Rica (%)
Place of birth for the foreign-born population - El Salvador (%)
Place of birth for the foreign-born population - Guatemala (%)
Place of birth for the foreign-born population - Honduras (%)
Place of birth for the foreign-born population - Mexico (%)
Place of birth for the foreign-born population - Nicaragua (%)
Place of birth for the foreign-born population - Panama (%)
Place of birth for the foreign-born population - Other Central America (%)
Place of birth for the foreign-born population - Argentina (%)
Place of birth for the foreign-born population - Bolivia (%)
Place of birth for the foreign-born population - Brazil (%)
Place of birth for the foreign-born population - Chile (%)
Place of birth for the foreign-born population - Colombia (%)
Place of birth for the foreign-born population - Ecuador (%)
Place of birth for the foreign-born population - Guyana (%)
Place of birth for the foreign-born population - Peru (%)
Place of birth for the foreign-born population - Uruguay (%)
Place of birth for the foreign-born population - Venezuela (%)
Place of birth for the foreign-born population - Other South America (%)
Place of birth for the foreign-born population - Canada (%)
Place of birth for the foreign-born population - Other Northern America (%)
Place of birth for the foreign-born population - Other (%)
Latest news about races in Princeton, IN collected exclusively by city-data.com from local newspapers, TV, and radio stations
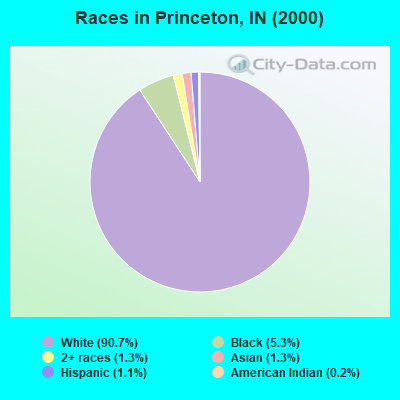
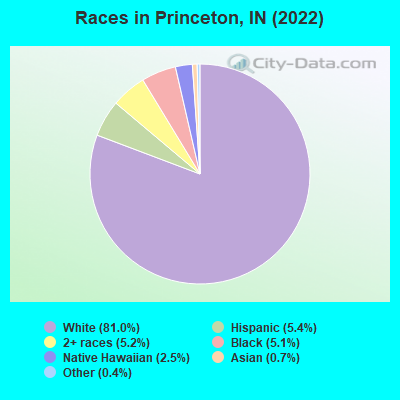
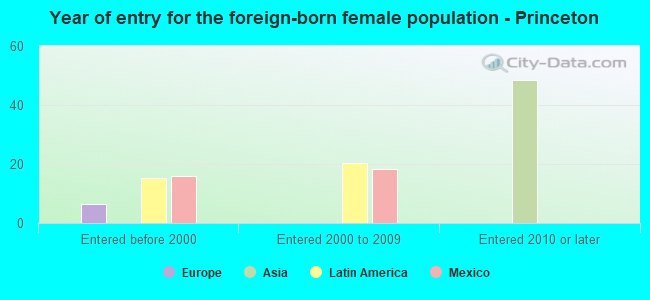
According to 2022 data, the most numerous races in Princeton, IN are White alone (6,805 residents), Black alone (428 residents), and Hispanic (452 residents). 94.3% of Princeton residents speak English at home. 3.8% of Princeton, IN residents are foreign-born (2.5% born in Latin America, 0.7% born in Asia), which is 57.6% less than the foreign-born rate of 6.0% across the entire state of Indiana.
Race distribution in Princeton
2000 2022
5,219,373 85.8% White alone 505,462 8.3% Black alone 214,536 3.5% Hispanic 61,115 1.0% Two or more races 58,424 1.0% Asian alone 13,654 0.2% American Indian alone 6,348 0.1% Other race alone 1,573 0.03% Native Hawaiian and Other
5,192,455 76.0% White alone 628,054 9.2% Black alone 534,528 7.8% Hispanic 263,242 3.9% Two or more races 172,880 2.5% Asian alone 33,467 0.5% Other race alone 5,866 0.09% American Indian alone 2,545 0.04% Native Hawaiian and Other
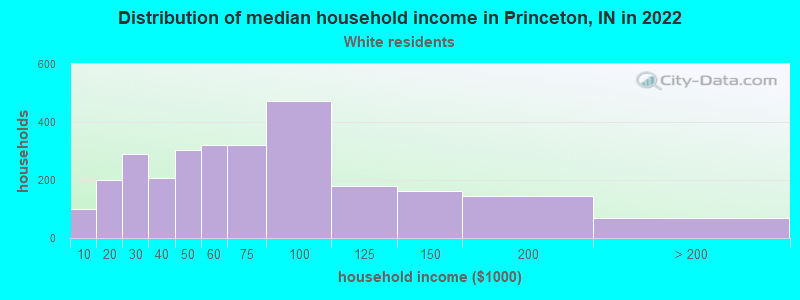
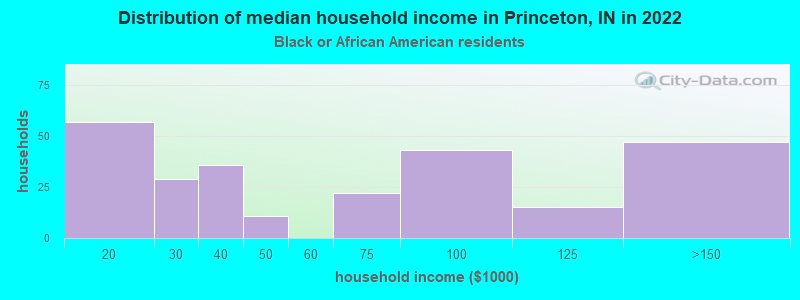
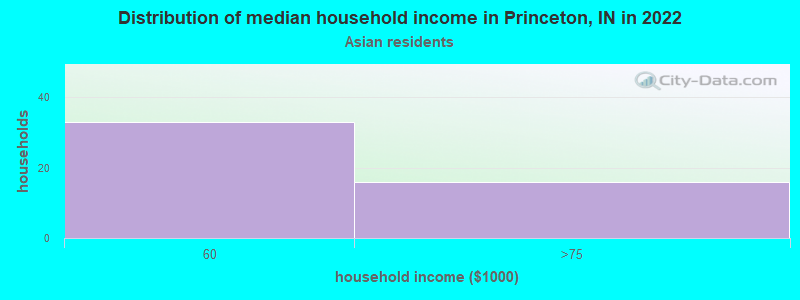
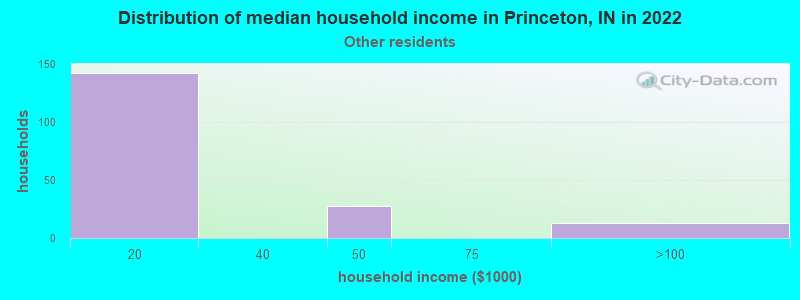
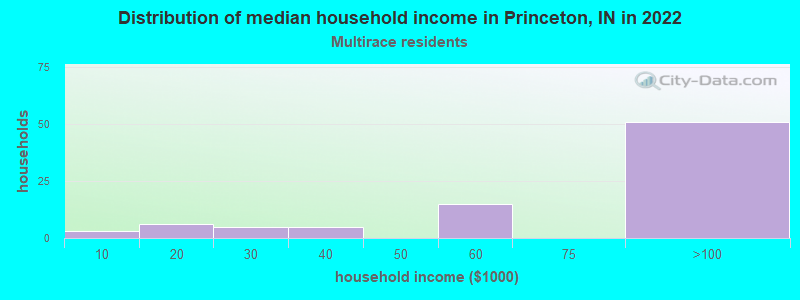
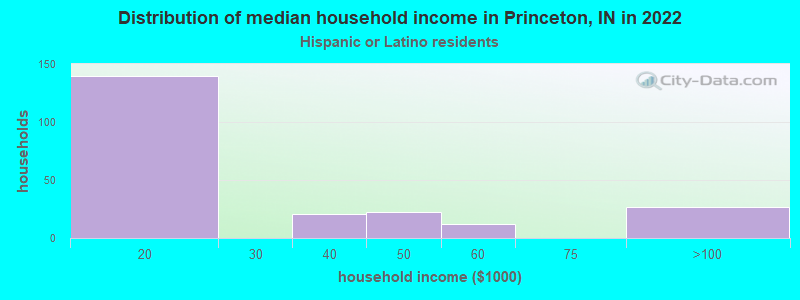
Income and house value in Princeton Median household income in 2022 $57,584 White non-Hispanic householders$16,098 Some other race householders$77,685 Two or more races householdersMedian 2022 house value $139,534 White Non-Hispanic householders$49,693 Black or African American householders$159,118 Native Hawaiian and other Pacific Islander householders$673,194 Some other race householders$619,583 Hispanic or Latino householders
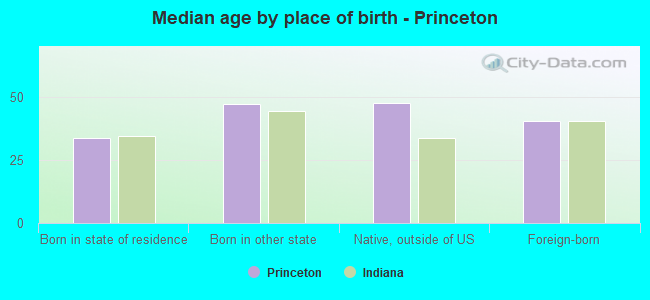
Median age by race in Princeton
42.0 Median age for White residents42.8 40.8 46.7 Median age for Black or African American residents37.2 49.6 -558,797,523.8 Median age for American Indian / Alaska Native residents-654,255,318.5 -491,600,353.2 31.8 Median age for Asian residents-693,422,518.8 31.0 21.0 Median age for Native Hawaiian / Pacific Islander residents21.3 18.6 21.9 Median age for Other race residents33.1 11.9 18.0 Median age for Two or more races residents6.2 25.4 41.9 Median age for White alone residents42.9 40.9 28.4 Median age for Hispanic or Latino residents30.9 17.4
Owner/renter occupied households by race in Princeton
House owners and renters - White residents 1,853 66.8% Owner occupied920 33.2% Renter occupiedHouse owners and renters - Black or African American residents 116 43.8% Owner occupied148 56.2% Renter occupiedHouse owners and renters - Asian residents 18 39.1% Owner occupied28 60.9% Renter occupiedHouse owners and renters - Native Hawaiian / Pacific Islander residents 20 100.0% Owner occupiedHouse owners and renters - Other race residents 24 15.4% Owner occupied133 84.6% Renter occupiedHouse owners and renters - Two or more races residents 50 60.4% Owner occupied33 39.6% Renter occupiedHouse owners and renters - White alone residents 1,857 67.1% Owner occupied912 32.9% Renter occupiedHouse owners and renters - Hispanic or Latino residents 33 16.6% Owner occupied166 83.4% Renter occupied
Language usage in Princeton
English speakers - Total 94.3% of residents of Princeton speak English at home.
4.3% of residents speak Spanish at home 159 45.7% Speak English very well189 54.3% Speak English less than very well0.9% of residents speak other language at home 68 95.8% Speak English very well3 4.2% Speak English less than very well
English speakers - Born in the United States 95.0% of residents of Princeton speak English at home.
4.2% of residents speak Spanish at home 89 100.0% Speak English very well0.6% of residents speak other language at home 12 100.0% Speak English very well
All residents speak only English at home
English speakers - Foreign-born 19.3% of residents of Princeton speak English at home.
62.9% of residents speak Spanish at home 16 7.9% Speak English very well186 92.1% Speak English less than very well18.4% of residents speak other language at home 56 94.9% Speak English very well3 5.1% Speak English less than very well
White (Caucasian) - Speak only English Native:
100.0% (6,477)Foreign-born:
100.0% (28)
Black or African American - Speak only English Native:
99.5% (380)Foreign-born:
68.2% (18)
Asian - Speak only English Native:
94.8% (2)Foreign-born:
9.2% (5)
Other race - Speak another language Native:
58.5% (144)Foreign-born:
97.7% (176)
White alone - Speak only English Native:
99.6% (6,494)Foreign-born:
93.1% (13)
Hispanic or Latino - Speak only English Native:
34.6% (75)Foreign-born:
12.6% (29)
Hispanic or Latino - Speak another language Native:
66.6% (145)Foreign-born:
87.5% (199)
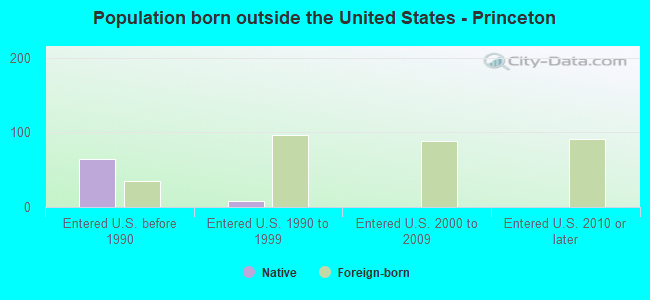
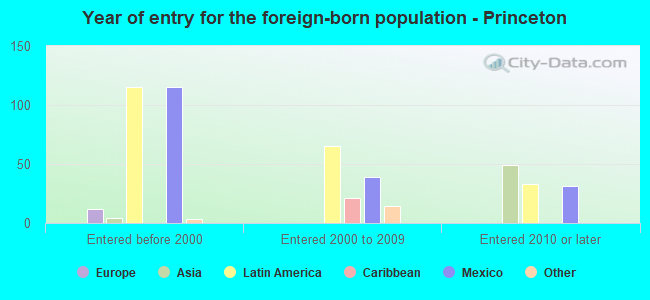
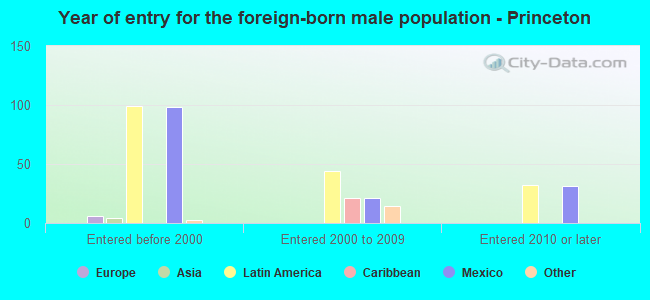
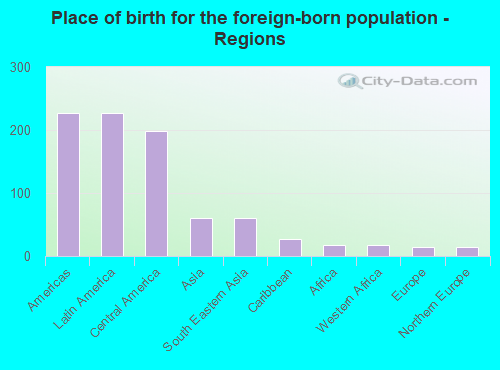
Foreign-born residents in Princeton 320 residents are foreign born (2.5% Latin America , 0.7% Asia ).
This city:
3.8%Indiana:
5.6%
Marital status for residents in Princeton Marital status - White (Caucasian) population 15 years and over
Males 30.2% Never married46.2% Now married1.0% Separated5.5% Widowed17.2% DivorcedFemales 23.5% Never married46.2% Now married0.0% Separated12.5% Widowed17.8% DivorcedWomen who gave birth in the past 12 months Now married:
45.7% (71)Unmarried:
54.3% (85)
Women who did not give birth in the past 12 months Now married:
44.3% (617)Unmarried:
55.7% (778)
Marital status - Black or African American population 15 years and over
Males 46.0% Never married36.5% Now married8.7% Separated0.0% Widowed8.7% DivorcedFemales 36.0% Never married30.5% Now married0.0% Separated6.7% Widowed26.8% DivorcedWomen who did not give birth in the past 12 months Now married:
36.4% (32)Unmarried:
63.6% (56)
Marital status - Asian population 15 years and over
Males 0.0% Never married100.0% Now married0.0% Separated0.0% Widowed0.0% DivorcedFemales 0.0% Never married40.4% Now married0.0% Separated0.0% Widowed59.6% DivorcedWomen who gave birth in the past 12 months Now married:
100.0% (4)Unmarried:
0.0% (0)
Women who did not give birth in the past 12 months Now married:
35.4% (18)Unmarried:
64.6% (32)
Marital status - Native Hawaiian / Pacific Islander population 15 years and over
Males 77.0% Never married23.0% Now married0.0% Separated0.0% Widowed0.0% DivorcedFemales 55.0% Never married21.2% Now married0.0% Separated0.0% Widowed23.8% DivorcedWomen who did not give birth in the past 12 months Now married:
21.3% (18)Unmarried:
78.8% (66)
Marital status - Other race population 15 years and over
Males 21.4% Never married76.9% Now married1.6% Separated0.0% Widowed0.0% DivorcedFemales 47.5% Never married52.5% Now married0.0% Separated0.0% Widowed0.0% DivorcedWomen who did not give birth in the past 12 months Now married:
52.5% (39)Unmarried:
47.5% (35)
Marital status - Two or more races population 15 years and over
Males 67.1% Never married9.4% Now married20.0% Separated0.0% Widowed3.5% DivorcedFemales 58.7% Never married15.4% Now married0.0% Separated3.8% Widowed22.1% DivorcedWomen who did not give birth in the past 12 months Now married:
17.9% (16)Unmarried:
82.1% (75)
Marital status - White alone, not Hispanic / Latino population 15 years and over
Males 29.6% Never married46.6% Now married1.0% Separated5.5% Widowed17.4% DivorcedFemales 23.6% Never married46.0% Now married0.0% Separated12.6% Widowed17.8% DivorcedWomen who gave birth in the past 12 months Now married:
41.7% (62)Unmarried:
58.3% (86)
Women who did not give birth in the past 12 months Now married:
44.3% (628)Unmarried:
55.7% (791)
Marital status - Hispanic or Latino population 15 years and over
Males 28.6% Never married62.5% Now married8.9% Separated0.0% Widowed0.0% DivorcedFemales 33.7% Never married50.0% Now married0.0% Separated0.0% Widowed16.3% DivorcedWomen who gave birth in the past 12 months Now married:
100.0% (12)Unmarried:
0.0% (0)
Women who did not give birth in the past 12 months Now married:
52.5% (34)Unmarried:
47.5% (31)
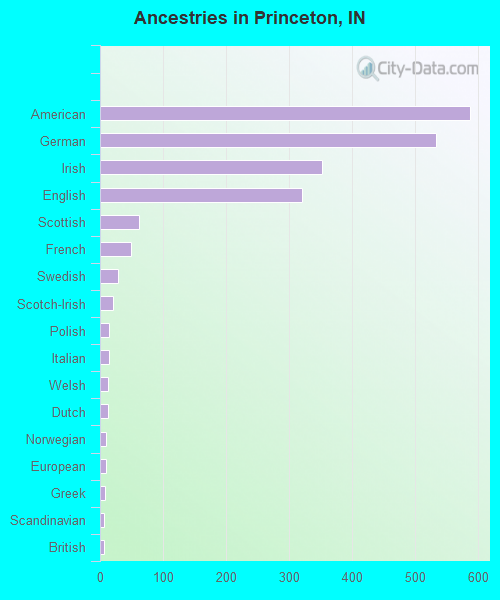
Ancestries in Princeton
588 19.7% American533 17.8% German352 11.8% Irish321 10.7% English62 2.1% Scottish49 1.6% French28 0.9% Swedish21 0.7% Scotch-Irish15 0.5% Polish14 0.5% Italian13 0.4% Welsh12 0.4% Dutch10 0.3% Norwegian9 0.3% European8 0.3% Greek7 0.2% Scandinavian6 0.2% British3 0.1% Nigerian1 0.03% Swiss
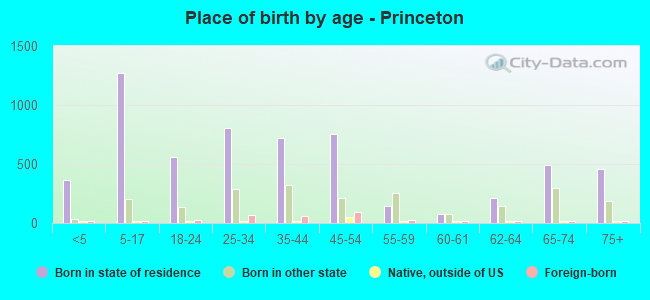
Children Nativity (place of birth) in Princeton
Children under 6 years - Living with two parents Both parents native 255 100.0% NativeOne native, one foreign-born parent 4 100.0% NativeChildren under 6 years - Living with one parent Native parent 217 100.0% Native
Children 6 to 17 years - Living with two parents Both parents native 870 100.0% NativeBoth parents foreign-born 98 100.0% NativeChildren 6 to 17 years - Living with one parent Native parent 319 100.0% Native
Grandparents responsible for own grandchildren in Princeton
Grandparents (30 to 59 years) White / Caucasian 6 15.1% Responsible for grandchildren32 84.9% Not responsible for grandchildrenOther race 28 100.0% Not responsible for grandchildrenWhite alone, not Hispanic / Latino 6 14.7% Responsible for grandchildren34 85.3% Not responsible for grandchildrenHispanic or Latino 18 100.0% Not responsible for grandchildrenGrandparents (60 years and over) White / Caucasian 7 24.0% Responsible for grandchildren22 76.0% Not responsible for grandchildrenWhite alone, not Hispanic / Latino 7 23.9% Responsible for grandchildren23 76.1% Not responsible for grandchildren