Races in Prospect Heights, Illinois (IL) Detailed Stats
Data:
Races - White alone (%)
Races - White alone (% change since 2000)
Races - Black alone (%)
Races - Black alone (% change since 2000)
Races - American Indian alone (%)
Races - American Indian alone (% change since 2000)
Races - Asian alone (%)
Races - Asian alone (% change since 2000)
Races - Hispanic (%)
Races - Hispanic (% change since 2000)
Races - Native Hawaiian and Other Pacific Islander alone (%)
Races - Native Hawaiian and Other Pacific Islander alone (% change since 2000)
Races - Two or more races(%)
Races - Two or more races(% change since 2000)
Races - Other race alone (%)
Races - Other race alone (% change since 2000)
Racial diversity
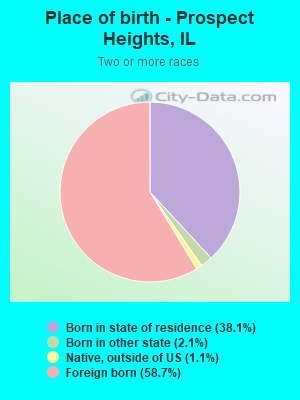
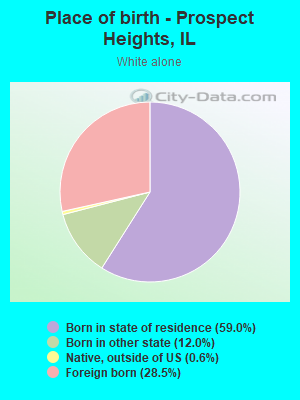
Place of birth - Born in state of residence (%)
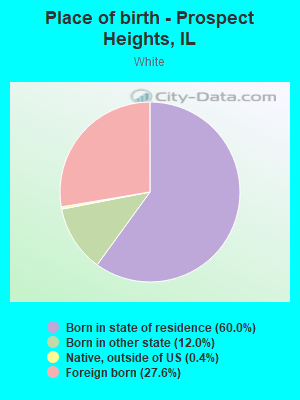
Place of birth - Born in state of residence (%) - White
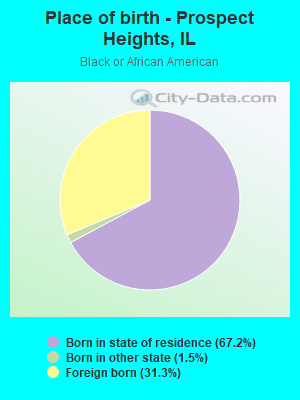
Place of birth - Born in state of residence (%) - Black or African American
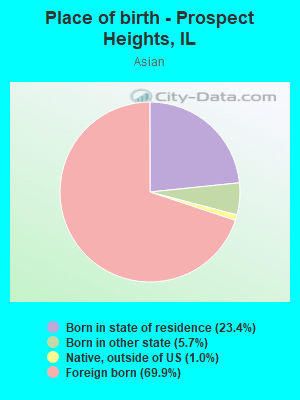
Place of birth - Born in state of residence (%) - Asian
Place of birth - Born in state of residence (%) - Hispanic or Latino
Place of birth - Born in state of residence (%) - American Indian and Alaska Native
Place of birth - Born in state of residence (%) - Multirace
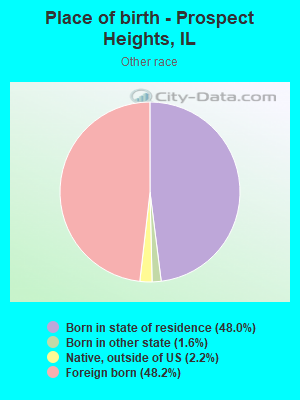
Place of birth - Born in state of residence (%) - Other Race
Place of birth - Born in other state (%)
Place of birth - Born in other state (%) - White
Place of birth - Born in other state (%) - Black or African American
Place of birth - Born in other state (%) - Asian
Place of birth - Born in other state (%) - Hispanic or Latino
Place of birth - Born in other state (%) - American Indian and Alaska Native
Place of birth - Born in other state (%) - Multirace
Place of birth - Born in other state (%) - Other Race
Place of birth - Native, outside of US (%)
Place of birth - Native, outside of US (%) - White
Place of birth - Native, outside of US (%) - Black or African American
Place of birth - Native, outside of US (%) - Asian
Place of birth - Native, outside of US (%) - Hispanic or Latino
Place of birth - Native, outside of US (%) - American Indian and Alaska Native
Place of birth - Native, outside of US (%) - Multirace
Place of birth - Native, outside of US (%) - Other Race
Place of birth - Foreign born (%)
Place of birth - Foreign born (%) - White
Place of birth - Foreign born (%) - Black or African American
Place of birth - Foreign born (%) - Asian
Place of birth - Foreign born (%) - Hispanic or Latino
Place of birth - Foreign born (%) - American Indian and Alaska Native
Place of birth - Foreign born (%) - Multirace
Place of birth - Foreign born (%) - Other Race
Residents speaking English at home (%)
Residents speaking English at home - Born in the United States (%)
Residents speaking English at home - Native, born elsewhere (%)
Residents speaking English at home - Foreign born (%)
Residents speaking Spanish at home (%)
Residents speaking Spanish at home - Born in the United States (%)
Residents speaking Spanish at home - Native, born elsewhere (%)
Residents speaking Spanish at home - Foreign born (%)
Residents speaking other language at home (%)
Residents speaking other language at home - Born in the United States (%)
Residents speaking other language at home - Native, born elsewhere (%)
Residents speaking other language at home - Foreign born (%)
Marital status - Never married (%)
Marital status - Now married (%)
Marital status - Separated (%)
Marital status - Widowed (%)
Marital status - Divorced (%)
Ancestries Reported - Arab (%)
Ancestries Reported - Czech (%)
Ancestries Reported - Danish (%)
Ancestries Reported - Dutch (%)
Ancestries Reported - English (%)
Ancestries Reported - French (%)
Ancestries Reported - French Canadian (%)
Ancestries Reported - German (%)
Ancestries Reported - Greek (%)
Ancestries Reported - Hungarian (%)
Ancestries Reported - Irish (%)
Ancestries Reported - Italian (%)
Ancestries Reported - Lithuanian (%)
Ancestries Reported - Norwegian (%)
Ancestries Reported - Polish (%)
Ancestries Reported - Portuguese (%)
Ancestries Reported - Russian (%)
Ancestries Reported - Scotch-Irish (%)
Ancestries Reported - Scottish (%)
Ancestries Reported - Slovak (%)
Ancestries Reported - Subsaharan African (%)
Ancestries Reported - Swedish (%)
Ancestries Reported - Swiss (%)
Ancestries Reported - Ukrainian (%)
Ancestries Reported - United States (%)
Ancestries Reported - Welsh (%)
Ancestries Reported - West Indian (%)
Ancestries Reported - Other (%)
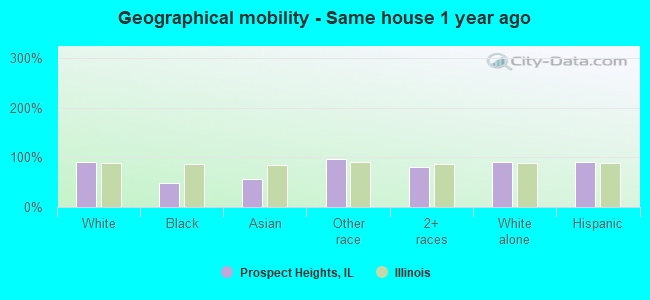
Geographical mobility - Same house 1 year ago (%)
Geographical mobility - Same house 1 year ago (%) - White
Geographical mobility - Same house 1 year ago (%) - Black or African American
Geographical mobility - Same house 1 year ago (%) - Asian
Geographical mobility - Same house 1 year ago (%) - Hispanic or Latino
Geographical mobility - Same house 1 year ago (%) - American Indian and Alaska Native
Geographical mobility - Same house 1 year ago (%) - Multirace
Geographical mobility - Same house 1 year ago (%) - Other Race
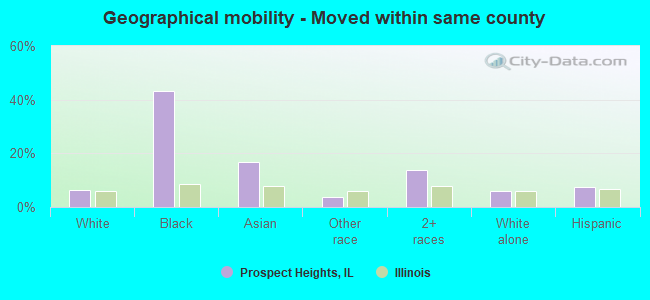
Geographical mobility - Moved within same county (%)
Geographical mobility - Moved within same county (%) - White
Geographical mobility - Moved within same county (%) - Black or African American
Geographical mobility - Moved within same county (%) - Asian
Geographical mobility - Moved within same county (%) - Hispanic or Latino
Geographical mobility - Moved within same county (%) - American Indian and Alaska Native
Geographical mobility - Moved within same county (%) - Multirace
Geographical mobility - Moved within same county (%) - Other Race
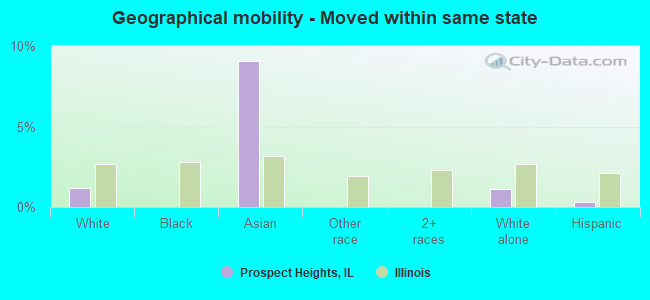
Geographical mobility - Moved from different county within same state (%)
Geographical mobility - Moved from different county within same state (%) - White
Geographical mobility - Moved from different county within same state (%) - Black or African American
Geographical mobility - Moved from different county within same state (%) - Asian
Geographical mobility - Moved from different county within same state (%) - Hispanic or Latino
Geographical mobility - Moved from different county within same state (%) - American Indian and Alaska Native
Geographical mobility - Moved from different county within same state (%) - Multirace
Geographical mobility - Moved from different county within same state (%) - Other Race
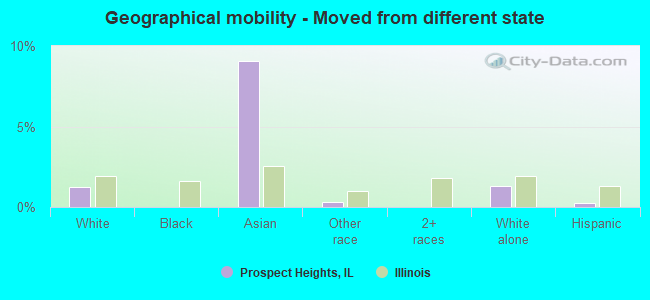
Geographical mobility - Moved from different state (%)
Geographical mobility - Moved from different state (%) - White
Geographical mobility - Moved from different state (%) - Black or African American
Geographical mobility - Moved from different state (%) - Asian
Geographical mobility - Moved from different state (%) - Hispanic or Latino
Geographical mobility - Moved from different state (%) - American Indian and Alaska Native
Geographical mobility - Moved from different state (%) - Multirace
Geographical mobility - Moved from different state (%) - Other Race
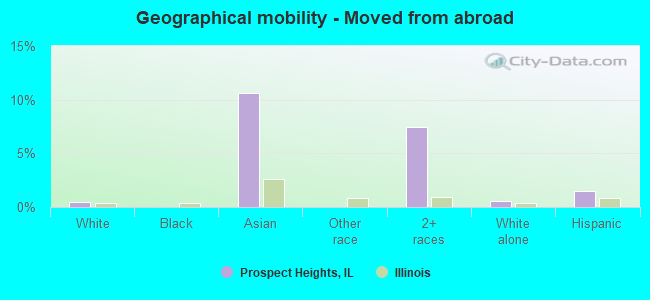
Geographical mobility - Moved from abroad (%)
Geographical mobility - Moved from abroad (%) - White
Geographical mobility - Moved from abroad (%) - Black or African American
Geographical mobility - Moved from abroad (%) - Asian
Geographical mobility - Moved from abroad (%) - Hispanic or Latino
Geographical mobility - Moved from abroad (%) - American Indian and Alaska Native
Geographical mobility - Moved from abroad (%) - Multirace
Geographical mobility - Moved from abroad (%) - Other Race
Place of birth for the foreign-born population - Ireland (%)
Place of birth for the foreign-born population - Denmark (%)
Place of birth for the foreign-born population - Norway (%)
Place of birth for the foreign-born population - Sweden (%)
Place of birth for the foreign-born population - United Kingdom (%)
Place of birth for the foreign-born population - England (%)
Place of birth for the foreign-born population - Scotland (%)
Place of birth for the foreign-born population - Other Northern Europe (%)
Place of birth for the foreign-born population - Austria (%)
Place of birth for the foreign-born population - Belgium (%)
Place of birth for the foreign-born population - France (%)
Place of birth for the foreign-born population - Germany (%)
Place of birth for the foreign-born population - Netherlands (%)
Place of birth for the foreign-born population - Switzerland (%)
Place of birth for the foreign-born population - Other Western Europe (%)
Place of birth for the foreign-born population - Greece (%)
Place of birth for the foreign-born population - Italy (%)
Place of birth for the foreign-born population - Portugal (%)
Place of birth for the foreign-born population - Spain (%)
Place of birth for the foreign-born population - Other Southern Europe (%)
Place of birth for the foreign-born population - Albania (%)
Place of birth for the foreign-born population - Belarus (%)
Place of birth for the foreign-born population - Bosnia and Herzegovina (%)
Place of birth for the foreign-born population - Bulgaria (%)
Place of birth for the foreign-born population - Croatia (%)
Place of birth for the foreign-born population - Czechoslovakia (%)
Place of birth for the foreign-born population - Hungary (%)
Place of birth for the foreign-born population - Latvia (%)
Place of birth for the foreign-born population - Lithuania (%)
Place of birth for the foreign-born population - North Macedonia (Macedonia) (%)
Place of birth for the foreign-born population - Moldova (%)
Place of birth for the foreign-born population - Poland (%)
Place of birth for the foreign-born population - Romania (%)
Place of birth for the foreign-born population - Russia (%)
Place of birth for the foreign-born population - Serbia (%)
Place of birth for the foreign-born population - Ukraine (%)
Place of birth for the foreign-born population - Other Eastern Europe (%)
Place of birth for the foreign-born population - China (%)
Place of birth for the foreign-born population - Hong Kong (%)
Place of birth for the foreign-born population - Taiwan (%)
Place of birth for the foreign-born population - Japan (%)
Place of birth for the foreign-born population - Korea (%)
Place of birth for the foreign-born population - Other Eastern Asia (%)
Place of birth for the foreign-born population - Afghanistan (%)
Place of birth for the foreign-born population - Bangladesh (%)
Place of birth for the foreign-born population - India (%)
Place of birth for the foreign-born population - Iran (%)
Place of birth for the foreign-born population - Kazakhstan (%)
Place of birth for the foreign-born population - Nepal (%)
Place of birth for the foreign-born population - Pakistan (%)
Place of birth for the foreign-born population - Sri Lanka (%)
Place of birth for the foreign-born population - Uzbekistan (%)
Place of birth for the foreign-born population - Other South Central Asia (%)
Place of birth for the foreign-born population - Burma (%)
Place of birth for the foreign-born population - Cambodia (%)
Place of birth for the foreign-born population - Indonesia (%)
Place of birth for the foreign-born population - Laos (%)
Place of birth for the foreign-born population - Malaysia (%)
Place of birth for the foreign-born population - Philippines (%)
Place of birth for the foreign-born population - Singapore (%)
Place of birth for the foreign-born population - Thailand (%)
Place of birth for the foreign-born population - Vietnam (%)
Place of birth for the foreign-born population - Other South Eastern Asia (%)
Place of birth for the foreign-born population - Armenia (%)
Place of birth for the foreign-born population - Iraq (%)
Place of birth for the foreign-born population - Israel (%)
Place of birth for the foreign-born population - Jordan (%)
Place of birth for the foreign-born population - Kuwait (%)
Place of birth for the foreign-born population - Lebanon (%)
Place of birth for the foreign-born population - Saudi Arabia (%)
Place of birth for the foreign-born population - Syria (%)
Place of birth for the foreign-born population - Turkey (%)
Place of birth for the foreign-born population - Yemen (%)
Place of birth for the foreign-born population - Other Western Asia (%)
Place of birth for the foreign-born population - Eritrea (%)
Place of birth for the foreign-born population - Ethiopia (%)
Place of birth for the foreign-born population - Kenya (%)
Place of birth for the foreign-born population - Somalia (%)
Place of birth for the foreign-born population - Uganda (%)
Place of birth for the foreign-born population - Zimbabwe (%)
Place of birth for the foreign-born population - Other Eastern Africa (%)
Place of birth for the foreign-born population - Cameroon (%)
Place of birth for the foreign-born population - Congo (%)
Place of birth for the foreign-born population - Democratic Republic of Congo (Zaire) (%)
Place of birth for the foreign-born population - Other Middle Africa (%)
Place of birth for the foreign-born population - Egypt (%)
Place of birth for the foreign-born population - Morocco (%)
Place of birth for the foreign-born population - Sudan (%)
Place of birth for the foreign-born population - Other Northern Africa (%)
Place of birth for the foreign-born population - South Africa (%)
Place of birth for the foreign-born population - Other Southern Africa (%)
Place of birth for the foreign-born population - Cabo Verde (%)
Place of birth for the foreign-born population - Ghana (%)
Place of birth for the foreign-born population - Liberia (%)
Place of birth for the foreign-born population - Nigeria (%)
Place of birth for the foreign-born population - Senegal (%)
Place of birth for the foreign-born population - Sierra Leone (%)
Place of birth for the foreign-born population - Other Western Africa (%)
Place of birth for the foreign-born population - Australia (%)
Place of birth for the foreign-born population - New Zealand (%)
Place of birth for the foreign-born population - Fiji (%)
Place of birth for the foreign-born population - Micronesia (%)
Place of birth for the foreign-born population - Bahamas (%)
Place of birth for the foreign-born population - Barbados (%)
Place of birth for the foreign-born population - Cuba (%)
Place of birth for the foreign-born population - Dominica (%)
Place of birth for the foreign-born population - Dominican Republic (%)
Place of birth for the foreign-born population - Grenada (%)
Place of birth for the foreign-born population - Haiti (%)
Place of birth for the foreign-born population - Jamaica (%)
Place of birth for the foreign-born population - St. Vincent and the Grenadines (%)
Place of birth for the foreign-born population - Trinidad and Tobago (%)
Place of birth for the foreign-born population - West Indies (%)
Place of birth for the foreign-born population - Other Caribbean (%)
Place of birth for the foreign-born population - Belize (%)
Place of birth for the foreign-born population - Costa Rica (%)
Place of birth for the foreign-born population - El Salvador (%)
Place of birth for the foreign-born population - Guatemala (%)
Place of birth for the foreign-born population - Honduras (%)
Place of birth for the foreign-born population - Mexico (%)
Place of birth for the foreign-born population - Nicaragua (%)
Place of birth for the foreign-born population - Panama (%)
Place of birth for the foreign-born population - Other Central America (%)
Place of birth for the foreign-born population - Argentina (%)
Place of birth for the foreign-born population - Bolivia (%)
Place of birth for the foreign-born population - Brazil (%)
Place of birth for the foreign-born population - Chile (%)
Place of birth for the foreign-born population - Colombia (%)
Place of birth for the foreign-born population - Ecuador (%)
Place of birth for the foreign-born population - Guyana (%)
Place of birth for the foreign-born population - Peru (%)
Place of birth for the foreign-born population - Uruguay (%)
Place of birth for the foreign-born population - Venezuela (%)
Place of birth for the foreign-born population - Other South America (%)
Place of birth for the foreign-born population - Canada (%)
Place of birth for the foreign-born population - Other Northern America (%)
Place of birth for the foreign-born population - Other (%)
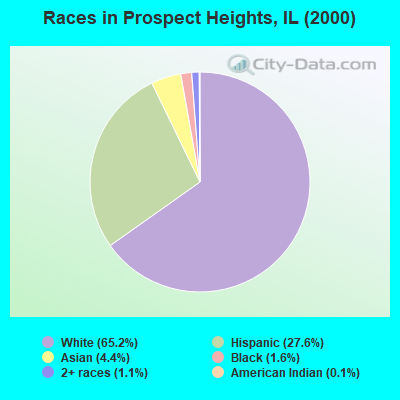
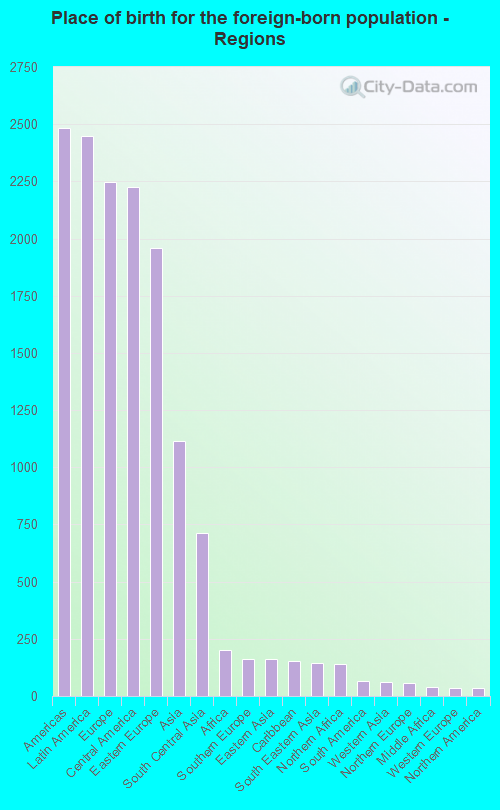
According to 2022 data, the most numerous races in Prospect Heights, IL are White alone (8,945 residents), Hispanic (5,015 residents), and Black alone (180 residents). 42.1% of Prospect Heights residents speak English at home. 39.0% of Prospect Heights, IL residents are foreign-born (15.5% born in Latin America, 14.3% born in Europe, 7.1% born in Asia), which is 64.1% greater than the foreign-born rate of 14.0% across the entire state of Illinois.
Race distribution in Prospect Heights
2000 2022
8,424,140 67.8% White alone 1,856,152 14.9% Black alone 1,530,262 12.3% Hispanic 419,916 3.4% Asian alone 153,996 1.2% Two or more races 13,479 0.1% Other race alone 18,232 0.1% American Indian alone 3,116 0.03% Native Hawaiian and Other
7,356,301 58.5% White alone 2,299,726 18.3% Hispanic 1,660,423 13.2% Black alone 747,296 5.9% Asian alone 458,599 3.6% Two or more races 45,386 0.4% Other race alone 10,405 0.08% American Indian alone 3,896 0.03% Native Hawaiian and Other
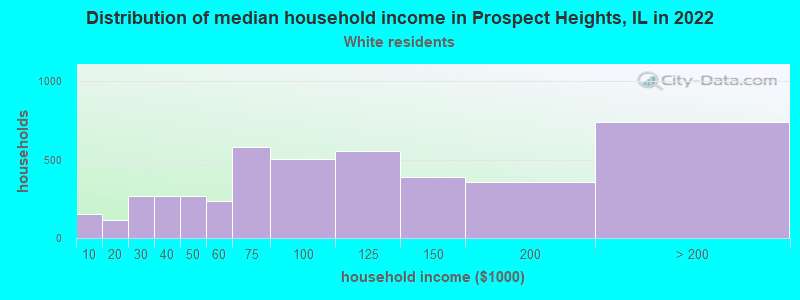
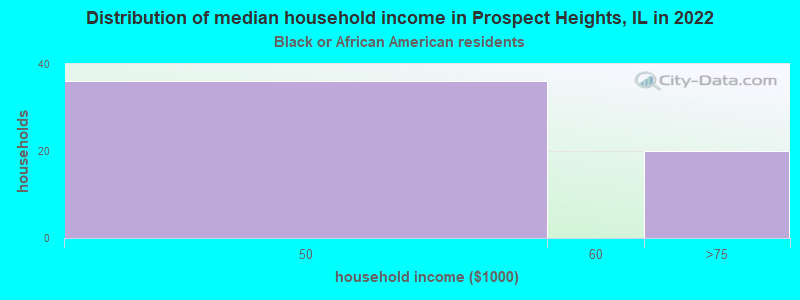
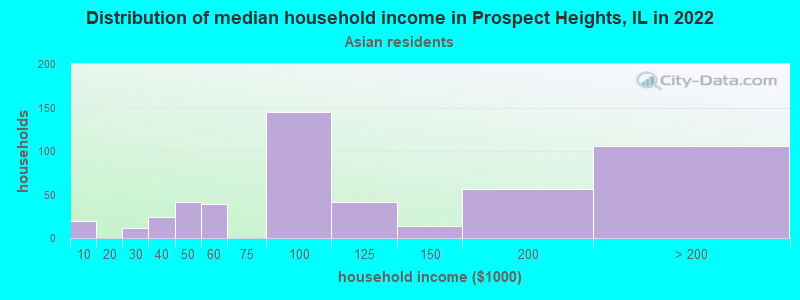
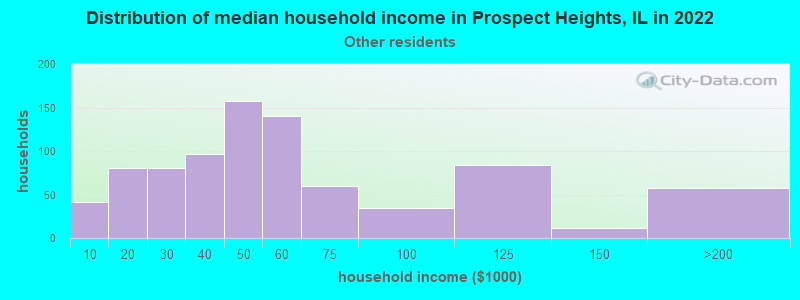
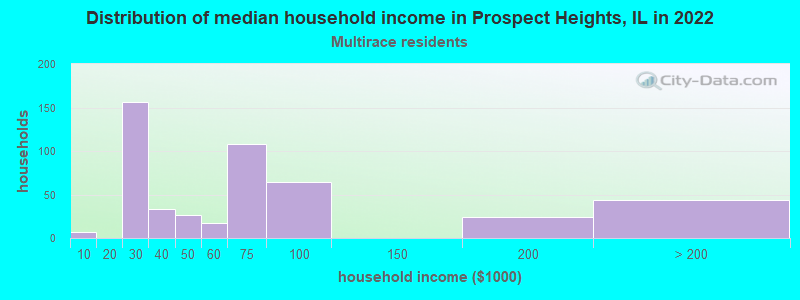
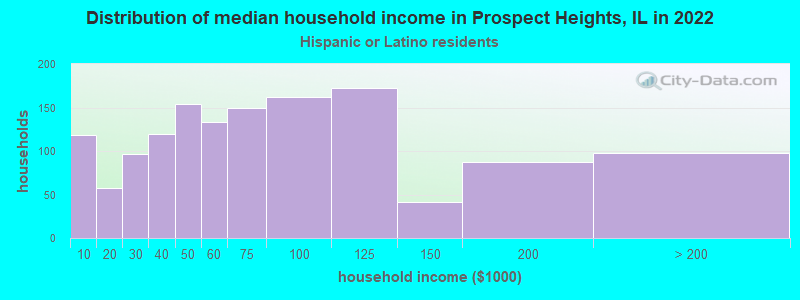
Income and house value in Prospect Heights Median household income in 2022 $88,222 White non-Hispanic householders$84,368 Asian householders$48,220 Some other race householders$59,288 Two or more races householders$58,656 Hispanic or Latino race householdersMedian 2022 house value $433,395 White Non-Hispanic householders$170,406 Black or African American householders $320,435 Asian householders$190,258 Some other race householders$395,273 Two or more races householders$175,150 Hispanic or Latino householders
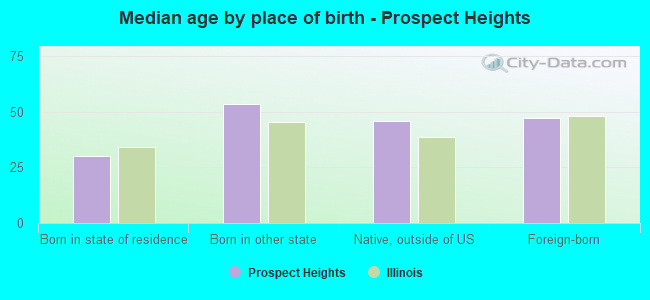
Median age by race in Prospect Heights
48.2 Median age for White residents45.3 49.7 0.0 Median age for Black or African American residents0.0 41.0 -680,473,372.1 Median age for American Indian / Alaska Native residents-736,736,736.0 -641,399,416.3 32.4 Median age for Asian residents32.9 31.7 -687,999,999.3 Median age for Native Hawaiian / Pacific Islander residents-918,721,460.3 -610,229,276.3 27.6 Median age for Other race residents25.9 34.9 44.1 Median age for Two or more races residents34.3 50.9 49.6 Median age for White alone residents48.3 51.6 33.0 Median age for Hispanic or Latino residents31.1 36.1
Owner/renter occupied households by race in Prospect Heights
House owners and renters - White residents 3,362 76.2% Owner occupied1,049 23.8% Renter occupiedHouse owners and renters - Black or African American residents 62 100.0% Renter occupiedHouse owners and renters - Asian residents 115 24.6% Owner occupied352 75.4% Renter occupiedHouse owners and renters - Other race residents 309 37.9% Owner occupied506 62.1% Renter occupiedHouse owners and renters - Two or more races residents 268 55.6% Owner occupied214 44.4% Renter occupiedHouse owners and renters - White alone residents 3,374 78.6% Owner occupied920 21.4% Renter occupiedHouse owners and renters - Hispanic or Latino residents 530 39.0% Owner occupied829 61.0% Renter occupied
Language usage in Prospect Heights
English speakers - Total 42.1% of residents of Prospect Heights speak English at home.
29.4% of residents speak Spanish at home 1,900 44.8% Speak English very well2,343 55.2% Speak English less than very well29.4% of residents speak other language at home 2,816 66.4% Speak English very well1,428 33.6% Speak English less than very well
English speakers - Born in the United States 94.5% of residents of Prospect Heights speak English at home.
4.6% of residents speak Spanish at home 55 100.0% Speak English very well0.2% of residents speak other language at home 3 100.0% Speak English very well
English speakers - Native, born elsewhere 46.8% of residents of Prospect Heights speak English at home.
45.2% of residents speak Spanish at home 47 82.5% Speak English very well10 17.5% Speak English less than very well7.9% of residents speak other language at home 10 100.0% Speak English very well
English speakers - Foreign-born 5.7% of residents of Prospect Heights speak English at home.
40.6% of residents speak Spanish at home 416 17.0% Speak English very well2,031 83.0% Speak English less than very well54.1% of residents speak other language at home 1,876 57.5% Speak English very well1,388 42.5% Speak English less than very well
White (Caucasian) - Speak only English Native:
81.0% (4,948)Foreign-born:
7.0% (174)
White (Caucasian) - Speak another language Native:
16.8% (1,023)Foreign-born:
92.5% (2,320)
Black or African American - Speak only English Native:
100.0% (30)Foreign-born:
100.0% (56)
Asian - Speak only English Native:
51.2% (129)Foreign-born:
7.0% (58)
Asian - Speak another language Native:
48.8% (123)Foreign-born:
93.6% (780)
Other race - Speak only English Native:
11.4% (142)Foreign-born:
0.8% (11)
Other race - Speak another language Native:
87.4% (1,091)Foreign-born:
99.7% (1,459)
Two or more races - Speak only English Native:
68.8% (420)Foreign-born:
2.9% (25)
Two or more races - Speak another language Native:
29.7% (181)Foreign-born:
97.1% (835)
White alone - Speak only English Native:
82.9% (4,884)Foreign-born:
7.6% (193)
White alone - Speak another language Native:
18.0% (1,060)Foreign-born:
93.3% (2,371)
Hispanic or Latino - Speak only English Native:
28.4% (637)Foreign-born:
1.0% (25)
Hispanic or Latino - Speak another language Native:
71.3% (1,598)Foreign-born:
99.4% (2,446)
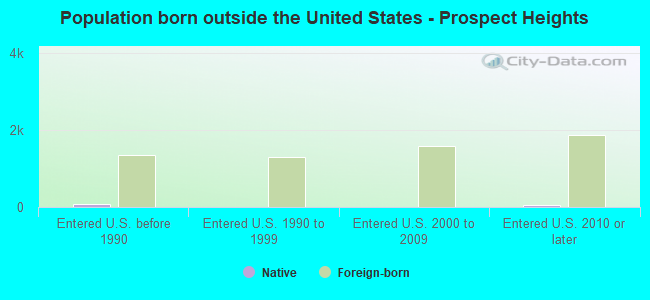
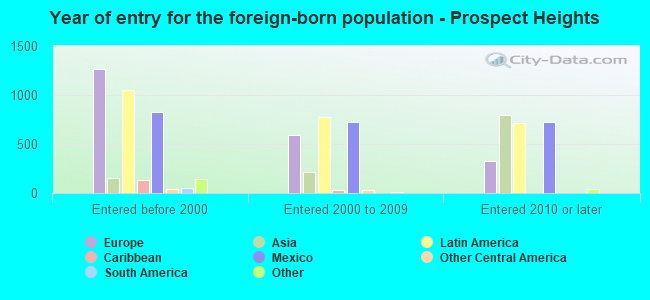
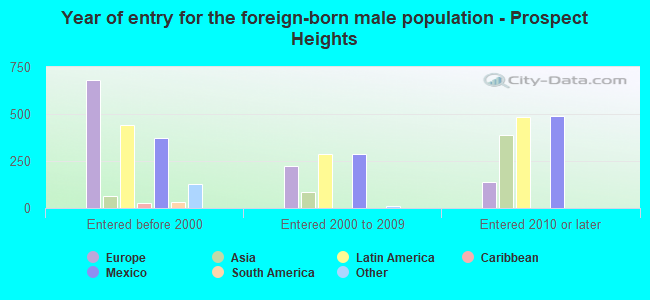
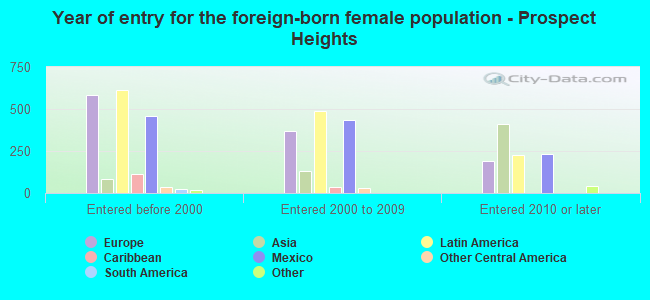
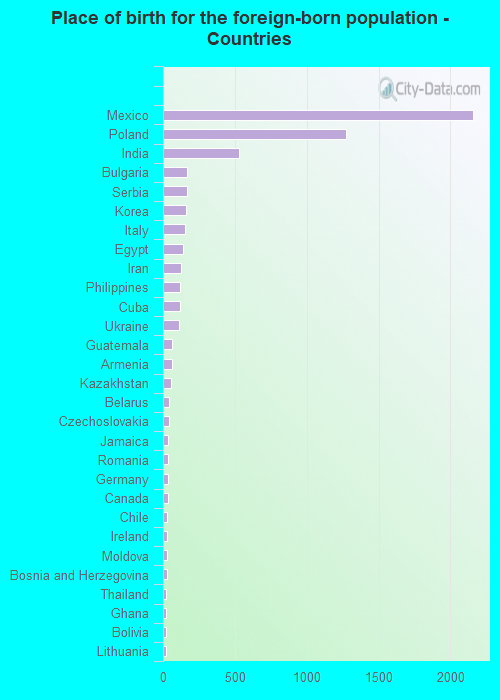
Foreign-born residents in Prospect Heights 6,050 residents are foreign born (15.5% Latin America , 14.3% Europe , 7.1% Asia ).
This city:
39.0%Illinois:
14.1%
Marital status for residents in Prospect Heights Marital status - White (Caucasian) population 15 years and over
Males 26.7% Never married56.6% Now married0.3% Separated7.8% Widowed8.6% DivorcedFemales 20.4% Never married54.5% Now married1.1% Separated9.5% Widowed14.6% DivorcedWomen who gave birth in the past 12 months Now married:
33.3% (8)Unmarried:
66.7% (15)
Women who did not give birth in the past 12 months Now married:
50.0% (858)Unmarried:
50.0% (857)
Marital status - Black or African American population 15 years and over
Males 39.5% Never married0.0% Now married0.0% Separated0.0% Widowed60.5% DivorcedFemales 0.0% Never married0.0% Now married0.0% Separated3.7% Widowed96.3% DivorcedWomen who gave birth in the past 12 months Now married:
0.0% (0)Unmarried:
100.0% (37)
Marital status - Asian population 15 years and over
Males 18.8% Never married81.2% Now married0.0% Separated0.0% Widowed0.0% DivorcedFemales 14.4% Never married83.7% Now married0.0% Separated0.0% Widowed1.9% DivorcedWomen who gave birth in the past 12 months Now married:
100.0% (55)Unmarried:
0.0% (0)
Women who did not give birth in the past 12 months Now married:
77.4% (304)Unmarried:
22.6% (89)
Marital status - Other race population 15 years and over
Males 45.0% Never married43.2% Now married11.8% Separated0.0% Widowed0.0% DivorcedFemales 42.5% Never married35.3% Now married2.1% Separated4.7% Widowed15.4% DivorcedWomen who gave birth in the past 12 months Now married:
100.0% (82)Unmarried:
0.0% (0)
Women who did not give birth in the past 12 months Now married:
35.3% (254)Unmarried:
64.7% (465)
Marital status - Two or more races population 15 years and over
Males 77.1% Never married22.9% Now married0.0% Separated0.0% Widowed0.0% DivorcedFemales 25.3% Never married41.0% Now married4.0% Separated12.6% Widowed17.2% DivorcedWomen who did not give birth in the past 12 months Now married:
67.7% (326)Unmarried:
32.3% (155)
Marital status - White alone, not Hispanic / Latino population 15 years and over
Males 24.6% Never married57.6% Now married0.0% Separated8.2% Widowed9.6% DivorcedFemales 18.9% Never married55.6% Now married1.2% Separated10.3% Widowed14.0% DivorcedWomen who gave birth in the past 12 months Now married:
33.3% (9)Unmarried:
66.7% (17)
Women who did not give birth in the past 12 months Now married:
48.7% (757)Unmarried:
51.3% (796)
Marital status - Hispanic or Latino population 15 years and over
Males 50.4% Never married40.9% Now married7.2% Separated1.5% Widowed0.0% DivorcedFemales 35.5% Never married42.6% Now married2.1% Separated7.4% Widowed12.5% DivorcedWomen who gave birth in the past 12 months Now married:
100.0% (73)Unmarried:
0.0% (0)
Women who did not give birth in the past 12 months Now married:
49.2% (677)Unmarried:
50.8% (698)
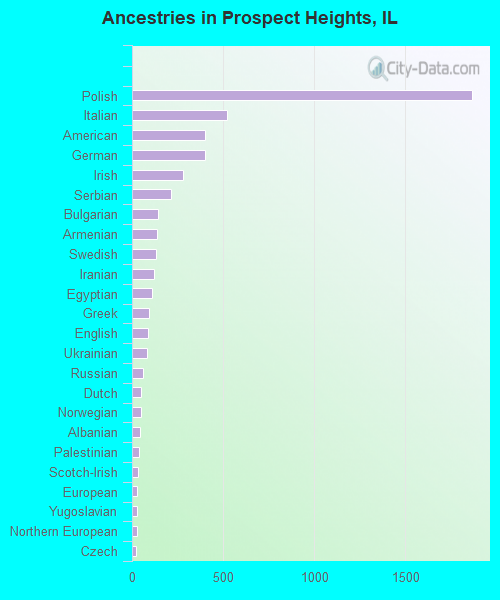
Ancestries in Prospect Heights
1,865 19.0% Polish522 5.3% Italian400 4.1% American399 4.1% German279 2.8% Irish212 2.2% Serbian144 1.5% Bulgarian136 1.4% Armenian131 1.3% Swedish118 1.2% Iranian109 1.1% Egyptian95 1.0% Greek88 0.9% English80 0.8% Ukrainian61 0.6% Russian52 0.5% Dutch50 0.5% Norwegian42 0.4% Albanian37 0.4% Palestinian34 0.3% Scotch-Irish28 0.3% European27 0.3% Yugoslavian25 0.3% Northern European23 0.2% Czech16 0.2% Ghanaian15 0.2% Lithuanian14 0.1% Scottish14 0.1% Swiss9 0.09% Assyrian9 0.09% French Canadian7 0.07% Luxembourger5 0.05% Danish
Geographical mobility in Prospect Heights Same house 1 year ago 8,438 90.3% White (Caucasian)42 48.4% Black or African American657 55.5% Asian2,833 96.1% Other race1,164 80.6% Two or more races8,127 90.8% White alone, not Hispanic / Latino4,472 90.5% Hispanic or LatinoMoved within same county 594 6.4% White / Caucasian38 43.3% Black or African American199 16.8% Asian114 3.9% Other race202 14.0% Two or more races525 5.9% White alone, not Hispanic / Latino366 7.4% Hispanic or LatinoMoved within same state 110 1.2% White / Caucasian107 9.1% Asian102 1.1% White alone, not Hispanic / Latino15 0.3% Hispanic or LatinoMoved from different state 116 1.2% White / Caucasian107 9.1% Asian8 0.3% Other race119 1.3% White alone, not Hispanic / Latino11 0.2% Hispanic or LatinoMoved from abroad 48 0.5% White126 10.6% Asian107 7.4% Two or more races52 0.6% White alone, not Hispanic / Latino73 1.5% Hispanic or Latino
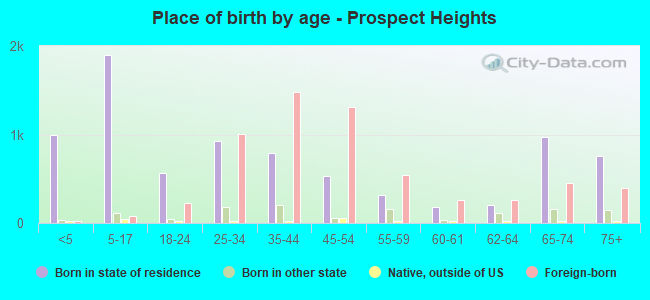
Children Nativity (place of birth) in Prospect Heights
Children under 6 years - Living with two parents Both parents native 365 100.0% NativeBoth parents foreign-born 358 90.9% Native36 9.1% Foreign-bornOne native, one foreign-born parent 32 100.0% NativeChildren under 6 years - Living with one parent Native parent 142 91.9% Native13 8.1% Foreign-bornForeign-born parent 193 100.0% NativeChildren 6 to 17 years - Living with two parents Both parents native 426 100.0% NativeBoth parents foreign-born 625 93.6% Native42 6.4% Foreign-bornOne native, one foreign-born parent 111 100.0% NativeChildren 6 to 17 years - Living with one parent Native parent 224 100.0% NativeForeign-born parent 282 50.1% Native281 49.9% Foreign-born
Grandparents responsible for own grandchildren in Prospect Heights
Grandparents (30 to 59 years) White / Caucasian 5 6.5% Responsible for grandchildren70 93.5% Not responsible for grandchildrenAsian 25 100.0% Not responsible for grandchildrenOther race 28 24.7% Responsible for grandchildren85 75.3% Not responsible for grandchildrenWhite alone, not Hispanic / Latino 6 9.7% Responsible for grandchildren60 90.3% Not responsible for grandchildrenHispanic or Latino 19 21.3% Responsible for grandchildren69 78.7% Not responsible for grandchildrenGrandparents (60 years and over) White / Caucasian 28 28.3% Responsible for grandchildren71 71.7% Not responsible for grandchildrenAsian 14 100.0% Not responsible for grandchildrenOther race 21 38.3% Responsible for grandchildren34 61.7% Not responsible for grandchildrenWhite alone, not Hispanic / Latino 6 23.4% Responsible for grandchildren21 76.6% Not responsible for grandchildrenHispanic or Latino 61 39.1% Responsible for grandchildren94 60.9% Not responsible for grandchildren