Races in Providence, Rhode Island (RI) Detailed Stats
Data:
Races - White alone (%)
Races - White alone (% change since 2000)
Races - Black alone (%)
Races - Black alone (% change since 2000)
Races - American Indian alone (%)
Races - American Indian alone (% change since 2000)
Races - Asian alone (%)
Races - Asian alone (% change since 2000)
Races - Hispanic (%)
Races - Hispanic (% change since 2000)
Races - Native Hawaiian and Other Pacific Islander alone (%)
Races - Native Hawaiian and Other Pacific Islander alone (% change since 2000)
Races - Two or more races(%)
Races - Two or more races(% change since 2000)
Races - Other race alone (%)
Races - Other race alone (% change since 2000)
Racial diversity
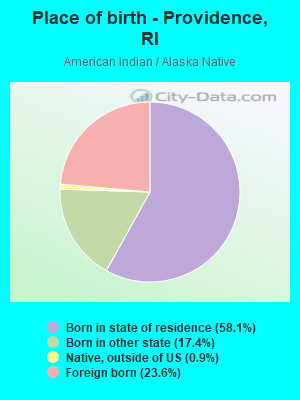
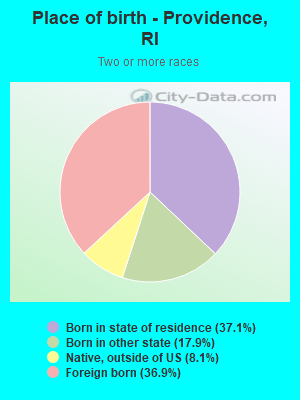
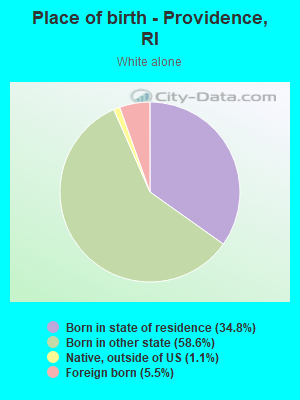
Place of birth - Born in state of residence (%)
Place of birth - Born in state of residence (%) - White
Place of birth - Born in state of residence (%) - Black or African American
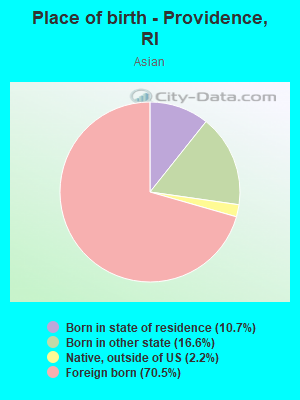
Place of birth - Born in state of residence (%) - Asian
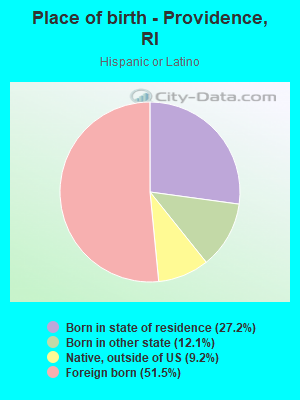
Place of birth - Born in state of residence (%) - Hispanic or Latino
Place of birth - Born in state of residence (%) - American Indian and Alaska Native
Place of birth - Born in state of residence (%) - Multirace
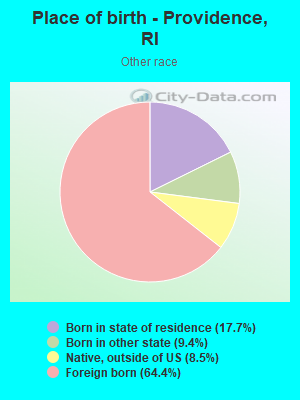
Place of birth - Born in state of residence (%) - Other Race
Place of birth - Born in other state (%)
Place of birth - Born in other state (%) - White
Place of birth - Born in other state (%) - Black or African American
Place of birth - Born in other state (%) - Asian
Place of birth - Born in other state (%) - Hispanic or Latino
Place of birth - Born in other state (%) - American Indian and Alaska Native
Place of birth - Born in other state (%) - Multirace
Place of birth - Born in other state (%) - Other Race
Place of birth - Native, outside of US (%)
Place of birth - Native, outside of US (%) - White
Place of birth - Native, outside of US (%) - Black or African American
Place of birth - Native, outside of US (%) - Asian
Place of birth - Native, outside of US (%) - Hispanic or Latino
Place of birth - Native, outside of US (%) - American Indian and Alaska Native
Place of birth - Native, outside of US (%) - Multirace
Place of birth - Native, outside of US (%) - Other Race
Place of birth - Foreign born (%)
Place of birth - Foreign born (%) - White
Place of birth - Foreign born (%) - Black or African American
Place of birth - Foreign born (%) - Asian
Place of birth - Foreign born (%) - Hispanic or Latino
Place of birth - Foreign born (%) - American Indian and Alaska Native
Place of birth - Foreign born (%) - Multirace
Place of birth - Foreign born (%) - Other Race
Residents speaking English at home (%)
Residents speaking English at home - Born in the United States (%)
Residents speaking English at home - Native, born elsewhere (%)
Residents speaking English at home - Foreign born (%)
Residents speaking Spanish at home (%)
Residents speaking Spanish at home - Born in the United States (%)
Residents speaking Spanish at home - Native, born elsewhere (%)
Residents speaking Spanish at home - Foreign born (%)
Residents speaking other language at home (%)
Residents speaking other language at home - Born in the United States (%)
Residents speaking other language at home - Native, born elsewhere (%)
Residents speaking other language at home - Foreign born (%)
Marital status - Never married (%)
Marital status - Now married (%)
Marital status - Separated (%)
Marital status - Widowed (%)
Marital status - Divorced (%)
Ancestries Reported - Arab (%)
Ancestries Reported - Czech (%)
Ancestries Reported - Danish (%)
Ancestries Reported - Dutch (%)
Ancestries Reported - English (%)
Ancestries Reported - French (%)
Ancestries Reported - French Canadian (%)
Ancestries Reported - German (%)
Ancestries Reported - Greek (%)
Ancestries Reported - Hungarian (%)
Ancestries Reported - Irish (%)
Ancestries Reported - Italian (%)
Ancestries Reported - Lithuanian (%)
Ancestries Reported - Norwegian (%)
Ancestries Reported - Polish (%)
Ancestries Reported - Portuguese (%)
Ancestries Reported - Russian (%)
Ancestries Reported - Scotch-Irish (%)
Ancestries Reported - Scottish (%)
Ancestries Reported - Slovak (%)
Ancestries Reported - Subsaharan African (%)
Ancestries Reported - Swedish (%)
Ancestries Reported - Swiss (%)
Ancestries Reported - Ukrainian (%)
Ancestries Reported - United States (%)
Ancestries Reported - Welsh (%)
Ancestries Reported - West Indian (%)
Ancestries Reported - Other (%)
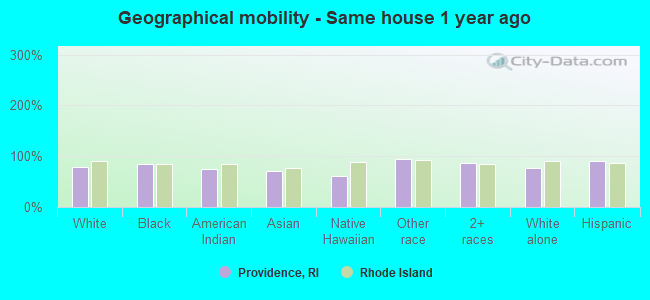
Geographical mobility - Same house 1 year ago (%)
Geographical mobility - Same house 1 year ago (%) - White
Geographical mobility - Same house 1 year ago (%) - Black or African American
Geographical mobility - Same house 1 year ago (%) - Asian
Geographical mobility - Same house 1 year ago (%) - Hispanic or Latino
Geographical mobility - Same house 1 year ago (%) - American Indian and Alaska Native
Geographical mobility - Same house 1 year ago (%) - Multirace
Geographical mobility - Same house 1 year ago (%) - Other Race
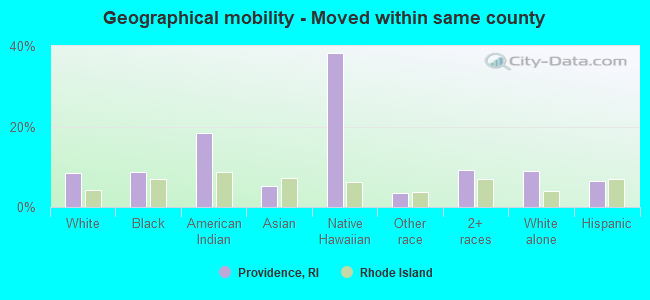
Geographical mobility - Moved within same county (%)
Geographical mobility - Moved within same county (%) - White
Geographical mobility - Moved within same county (%) - Black or African American
Geographical mobility - Moved within same county (%) - Asian
Geographical mobility - Moved within same county (%) - Hispanic or Latino
Geographical mobility - Moved within same county (%) - American Indian and Alaska Native
Geographical mobility - Moved within same county (%) - Multirace
Geographical mobility - Moved within same county (%) - Other Race
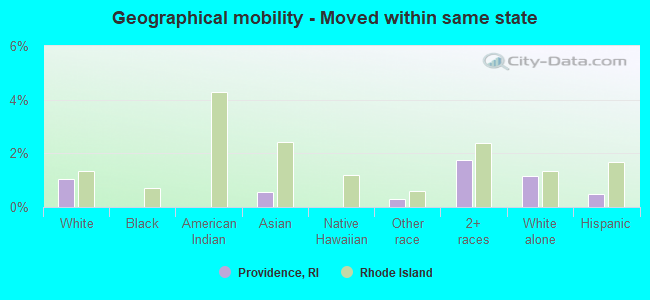
Geographical mobility - Moved from different county within same state (%)
Geographical mobility - Moved from different county within same state (%) - White
Geographical mobility - Moved from different county within same state (%) - Black or African American
Geographical mobility - Moved from different county within same state (%) - Asian
Geographical mobility - Moved from different county within same state (%) - Hispanic or Latino
Geographical mobility - Moved from different county within same state (%) - American Indian and Alaska Native
Geographical mobility - Moved from different county within same state (%) - Multirace
Geographical mobility - Moved from different county within same state (%) - Other Race
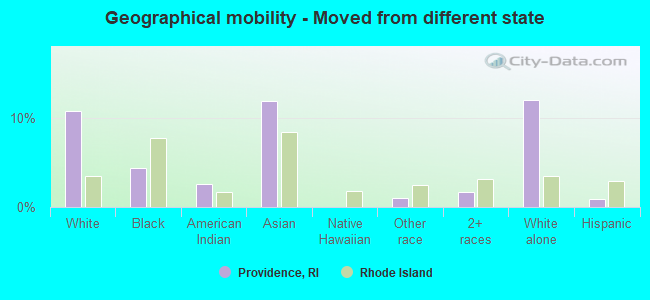
Geographical mobility - Moved from different state (%)
Geographical mobility - Moved from different state (%) - White
Geographical mobility - Moved from different state (%) - Black or African American
Geographical mobility - Moved from different state (%) - Asian
Geographical mobility - Moved from different state (%) - Hispanic or Latino
Geographical mobility - Moved from different state (%) - American Indian and Alaska Native
Geographical mobility - Moved from different state (%) - Multirace
Geographical mobility - Moved from different state (%) - Other Race
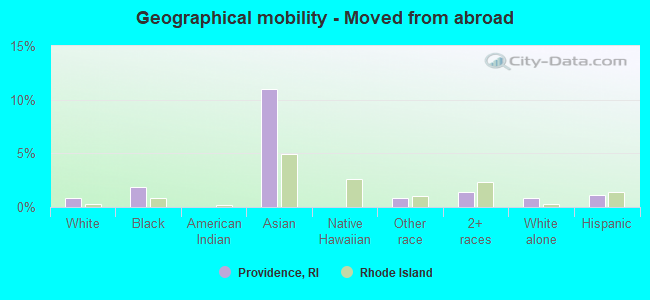
Geographical mobility - Moved from abroad (%)
Geographical mobility - Moved from abroad (%) - White
Geographical mobility - Moved from abroad (%) - Black or African American
Geographical mobility - Moved from abroad (%) - Asian
Geographical mobility - Moved from abroad (%) - Hispanic or Latino
Geographical mobility - Moved from abroad (%) - American Indian and Alaska Native
Geographical mobility - Moved from abroad (%) - Multirace
Geographical mobility - Moved from abroad (%) - Other Race
Place of birth for the foreign-born population - Ireland (%)
Place of birth for the foreign-born population - Denmark (%)
Place of birth for the foreign-born population - Norway (%)
Place of birth for the foreign-born population - Sweden (%)
Place of birth for the foreign-born population - United Kingdom (%)
Place of birth for the foreign-born population - England (%)
Place of birth for the foreign-born population - Scotland (%)
Place of birth for the foreign-born population - Other Northern Europe (%)
Place of birth for the foreign-born population - Austria (%)
Place of birth for the foreign-born population - Belgium (%)
Place of birth for the foreign-born population - France (%)
Place of birth for the foreign-born population - Germany (%)
Place of birth for the foreign-born population - Netherlands (%)
Place of birth for the foreign-born population - Switzerland (%)
Place of birth for the foreign-born population - Other Western Europe (%)
Place of birth for the foreign-born population - Greece (%)
Place of birth for the foreign-born population - Italy (%)
Place of birth for the foreign-born population - Portugal (%)
Place of birth for the foreign-born population - Spain (%)
Place of birth for the foreign-born population - Other Southern Europe (%)
Place of birth for the foreign-born population - Albania (%)
Place of birth for the foreign-born population - Belarus (%)
Place of birth for the foreign-born population - Bosnia and Herzegovina (%)
Place of birth for the foreign-born population - Bulgaria (%)
Place of birth for the foreign-born population - Croatia (%)
Place of birth for the foreign-born population - Czechoslovakia (%)
Place of birth for the foreign-born population - Hungary (%)
Place of birth for the foreign-born population - Latvia (%)
Place of birth for the foreign-born population - Lithuania (%)
Place of birth for the foreign-born population - North Macedonia (Macedonia) (%)
Place of birth for the foreign-born population - Moldova (%)
Place of birth for the foreign-born population - Poland (%)
Place of birth for the foreign-born population - Romania (%)
Place of birth for the foreign-born population - Russia (%)
Place of birth for the foreign-born population - Serbia (%)
Place of birth for the foreign-born population - Ukraine (%)
Place of birth for the foreign-born population - Other Eastern Europe (%)
Place of birth for the foreign-born population - China (%)
Place of birth for the foreign-born population - Hong Kong (%)
Place of birth for the foreign-born population - Taiwan (%)
Place of birth for the foreign-born population - Japan (%)
Place of birth for the foreign-born population - Korea (%)
Place of birth for the foreign-born population - Other Eastern Asia (%)
Place of birth for the foreign-born population - Afghanistan (%)
Place of birth for the foreign-born population - Bangladesh (%)
Place of birth for the foreign-born population - India (%)
Place of birth for the foreign-born population - Iran (%)
Place of birth for the foreign-born population - Kazakhstan (%)
Place of birth for the foreign-born population - Nepal (%)
Place of birth for the foreign-born population - Pakistan (%)
Place of birth for the foreign-born population - Sri Lanka (%)
Place of birth for the foreign-born population - Uzbekistan (%)
Place of birth for the foreign-born population - Other South Central Asia (%)
Place of birth for the foreign-born population - Burma (%)
Place of birth for the foreign-born population - Cambodia (%)
Place of birth for the foreign-born population - Indonesia (%)
Place of birth for the foreign-born population - Laos (%)
Place of birth for the foreign-born population - Malaysia (%)
Place of birth for the foreign-born population - Philippines (%)
Place of birth for the foreign-born population - Singapore (%)
Place of birth for the foreign-born population - Thailand (%)
Place of birth for the foreign-born population - Vietnam (%)
Place of birth for the foreign-born population - Other South Eastern Asia (%)
Place of birth for the foreign-born population - Armenia (%)
Place of birth for the foreign-born population - Iraq (%)
Place of birth for the foreign-born population - Israel (%)
Place of birth for the foreign-born population - Jordan (%)
Place of birth for the foreign-born population - Kuwait (%)
Place of birth for the foreign-born population - Lebanon (%)
Place of birth for the foreign-born population - Saudi Arabia (%)
Place of birth for the foreign-born population - Syria (%)
Place of birth for the foreign-born population - Turkey (%)
Place of birth for the foreign-born population - Yemen (%)
Place of birth for the foreign-born population - Other Western Asia (%)
Place of birth for the foreign-born population - Eritrea (%)
Place of birth for the foreign-born population - Ethiopia (%)
Place of birth for the foreign-born population - Kenya (%)
Place of birth for the foreign-born population - Somalia (%)
Place of birth for the foreign-born population - Uganda (%)
Place of birth for the foreign-born population - Zimbabwe (%)
Place of birth for the foreign-born population - Other Eastern Africa (%)
Place of birth for the foreign-born population - Cameroon (%)
Place of birth for the foreign-born population - Congo (%)
Place of birth for the foreign-born population - Democratic Republic of Congo (Zaire) (%)
Place of birth for the foreign-born population - Other Middle Africa (%)
Place of birth for the foreign-born population - Egypt (%)
Place of birth for the foreign-born population - Morocco (%)
Place of birth for the foreign-born population - Sudan (%)
Place of birth for the foreign-born population - Other Northern Africa (%)
Place of birth for the foreign-born population - South Africa (%)
Place of birth for the foreign-born population - Other Southern Africa (%)
Place of birth for the foreign-born population - Cabo Verde (%)
Place of birth for the foreign-born population - Ghana (%)
Place of birth for the foreign-born population - Liberia (%)
Place of birth for the foreign-born population - Nigeria (%)
Place of birth for the foreign-born population - Senegal (%)
Place of birth for the foreign-born population - Sierra Leone (%)
Place of birth for the foreign-born population - Other Western Africa (%)
Place of birth for the foreign-born population - Australia (%)
Place of birth for the foreign-born population - New Zealand (%)
Place of birth for the foreign-born population - Fiji (%)
Place of birth for the foreign-born population - Micronesia (%)
Place of birth for the foreign-born population - Bahamas (%)
Place of birth for the foreign-born population - Barbados (%)
Place of birth for the foreign-born population - Cuba (%)
Place of birth for the foreign-born population - Dominica (%)
Place of birth for the foreign-born population - Dominican Republic (%)
Place of birth for the foreign-born population - Grenada (%)
Place of birth for the foreign-born population - Haiti (%)
Place of birth for the foreign-born population - Jamaica (%)
Place of birth for the foreign-born population - St. Vincent and the Grenadines (%)
Place of birth for the foreign-born population - Trinidad and Tobago (%)
Place of birth for the foreign-born population - West Indies (%)
Place of birth for the foreign-born population - Other Caribbean (%)
Place of birth for the foreign-born population - Belize (%)
Place of birth for the foreign-born population - Costa Rica (%)
Place of birth for the foreign-born population - El Salvador (%)
Place of birth for the foreign-born population - Guatemala (%)
Place of birth for the foreign-born population - Honduras (%)
Place of birth for the foreign-born population - Mexico (%)
Place of birth for the foreign-born population - Nicaragua (%)
Place of birth for the foreign-born population - Panama (%)
Place of birth for the foreign-born population - Other Central America (%)
Place of birth for the foreign-born population - Argentina (%)
Place of birth for the foreign-born population - Bolivia (%)
Place of birth for the foreign-born population - Brazil (%)
Place of birth for the foreign-born population - Chile (%)
Place of birth for the foreign-born population - Colombia (%)
Place of birth for the foreign-born population - Ecuador (%)
Place of birth for the foreign-born population - Guyana (%)
Place of birth for the foreign-born population - Peru (%)
Place of birth for the foreign-born population - Uruguay (%)
Place of birth for the foreign-born population - Venezuela (%)
Place of birth for the foreign-born population - Other South America (%)
Place of birth for the foreign-born population - Canada (%)
Place of birth for the foreign-born population - Other Northern America (%)
Place of birth for the foreign-born population - Other (%)
Latest news about races in Providence, RI collected exclusively by city-data.com from local newspapers, TV, and radio stations
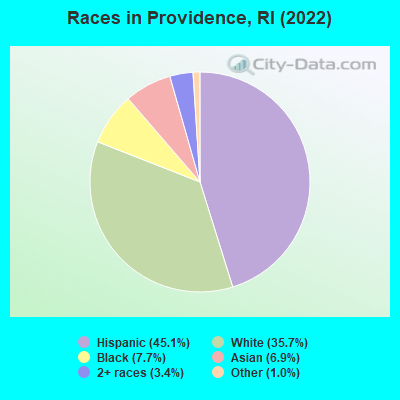
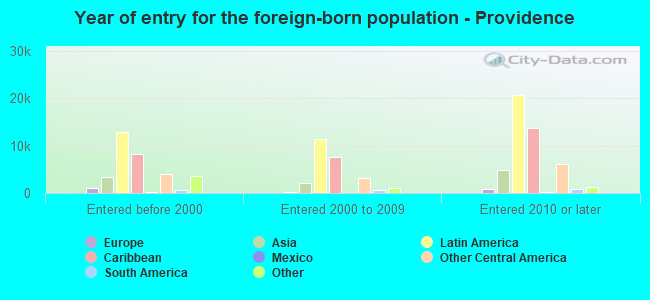
According to 2022 data, the most numerous races in Providence, RI are White alone (67,744 residents), Hispanic (85,591 residents), and Two or more races (6,457 residents). 53.1% of Providence residents speak English at home. 32.3% of Providence, RI residents are foreign-born (21.4% born in Latin America, 4.2% born in Asia, 3.5% born in Africa), which is 56.6% greater than the foreign-born rate of 14.0% across the entire state of Rhode Island.
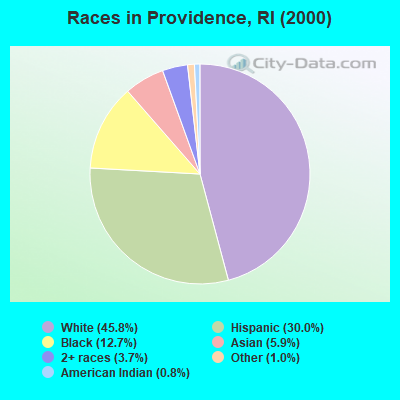
Race distribution in Providence
2000 2022
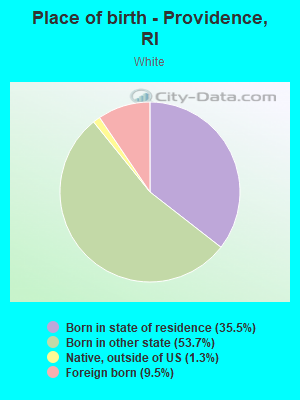
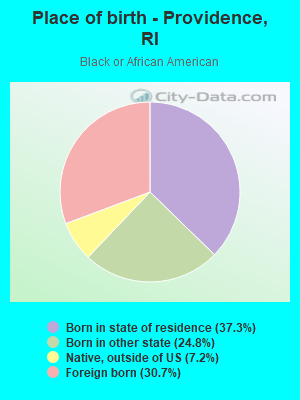
79,451 45.8% White alone 52,146 30.0% Hispanic 22,103 12.7% Black alone 10,303 5.9% Asian alone 6,357 3.7% Two or more races 1,731 1.0% Other race alone 1,446 0.8% American Indian alone 81 0.05% Native Hawaiian and Other
85,591 45.1% Hispanic 67,744 35.7% White alone 14,610 7.7% Black alone 13,141 6.9% Asian alone 6,457 3.4% Two or more races 1,940 1.0% Other race alone 92 0.05% American Indian alone
2000 2022
858,433 81.9% White alone 90,820 8.7% Hispanic 41,922 4.0% Black alone 23,416 2.2% Asian alone 20,816 2.0% Two or more races 8,411 0.8% Other race alone 4,181 0.4% American Indian alone 320 0.03% Native Hawaiian and Other
745,825 68.2% White alone 191,979 17.6% Hispanic 56,738 5.2% Two or more races 51,326 4.7% Black alone 37,234 3.4% Asian alone 9,514 0.9% Other race alone 978 0.09% American Indian alone 140 0.01% Native Hawaiian and Other
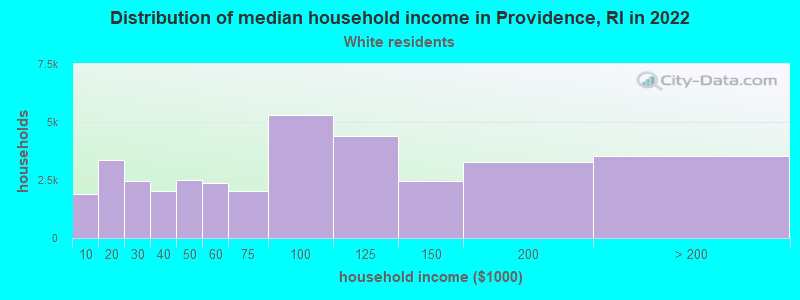
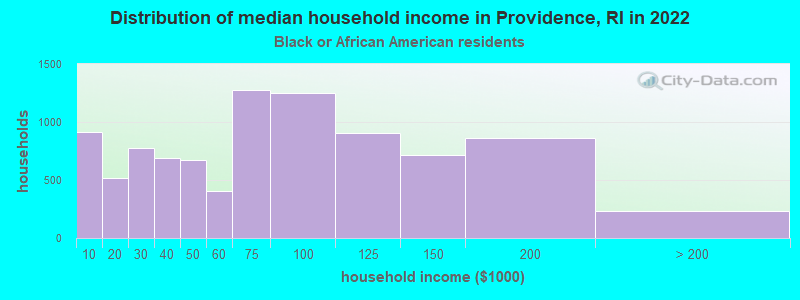
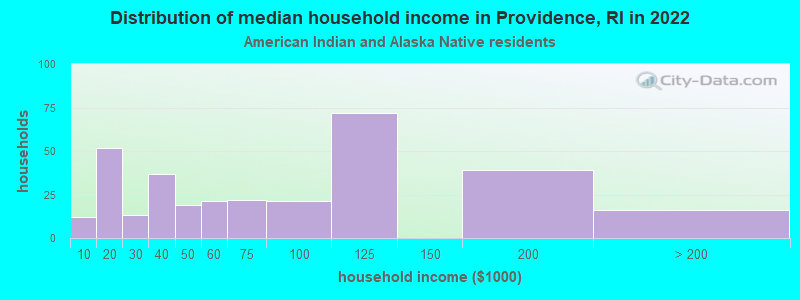
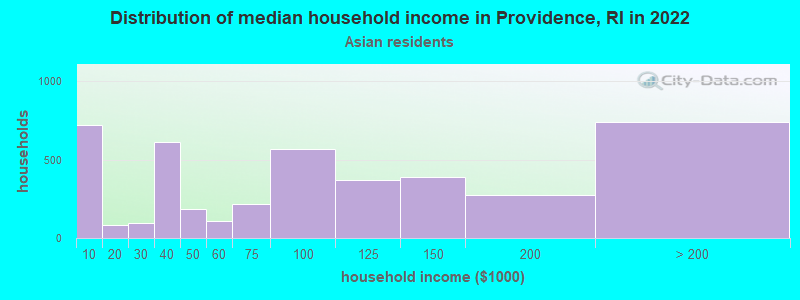
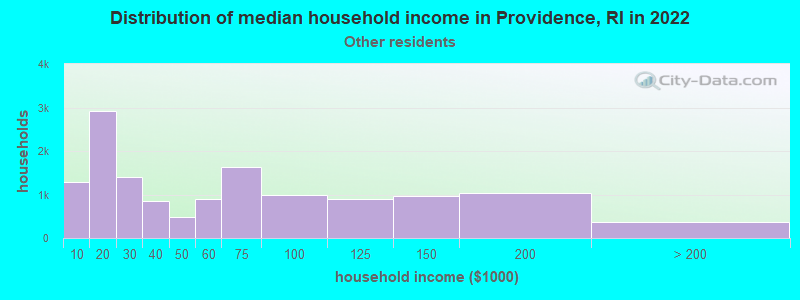
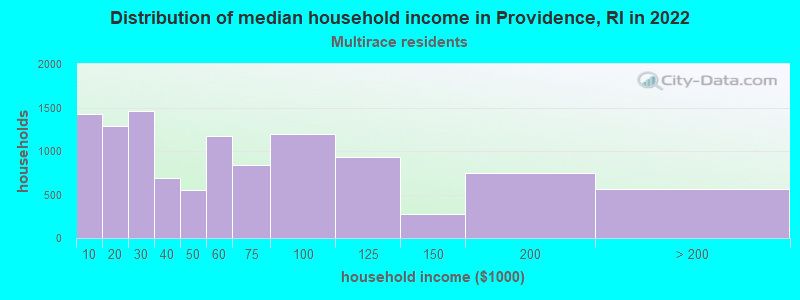
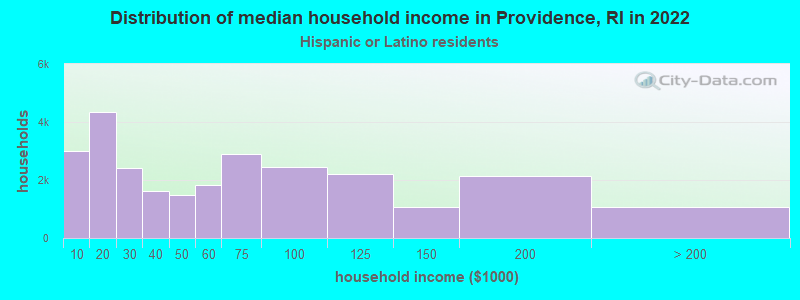
Income and house value in Providence Median household income in 2022 $79,306 White non-Hispanic householders$72,043 Black householders$76,345 American Indian and Alaska Native householders$91,406 Asian householders$49,121 Some other race householders$51,994 Two or more races householders$52,048 Hispanic or Latino race householdersMedian 2022 house value $387,179 White Non-Hispanic householders$307,268 Black or African American householders$589,432 American Indian or Alaska Native householders $332,373 Asian householders$279,335 Native Hawaiian and other Pacific Islander householders$304,086 Some other race householders$348,992 Two or more races householders$308,683 Hispanic or Latino householders
Median age by race in Providence
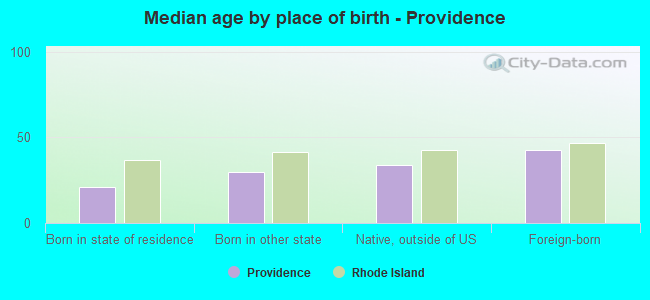
34.5 Median age for White residents36.8 32.6 28.2 Median age for Black or African American residents37.4 24.6 18.4 Median age for American Indian / Alaska Native residents17.3 29.6 33.3 Median age for Asian residents35.7 30.7 -666,666,666.0 Median age for Native Hawaiian / Pacific Islander residents-666,666,666.0 -666,666,666.0 33.1 Median age for Other race residents32.1 33.8 26.6 Median age for Two or more races residents22.7 33.1 36.3 Median age for White alone residents37.7 34.6 30.1 Median age for Hispanic or Latino residents29.0 32.1
Owner/renter occupied households by race in Providence
House owners and renters - White residents 16,359 45.9% Owner occupied19,243 54.1% Renter occupiedHouse owners and renters - Black or African American residents 2,238 32.9% Owner occupied4,558 67.1% Renter occupiedHouse owners and renters - American Indian / Alaska Native residents 156 54.0% Owner occupied133 46.0% Renter occupiedHouse owners and renters - Asian residents 2,251 44.8% Owner occupied2,770 55.2% Renter occupiedHouse owners and renters - Native Hawaiian / Pacific Islander residents 56 100.0% Renter occupiedHouse owners and renters - Other race residents 4,994 36.4% Owner occupied8,732 63.6% Renter occupiedHouse owners and renters - Two or more races residents 4,024 36.2% Owner occupied7,091 63.8% Renter occupiedHouse owners and renters - White alone residents 16,012 48.3% Owner occupied17,159 51.7% Renter occupiedHouse owners and renters - Hispanic or Latino residents 9,398 35.5% Owner occupied17,054 64.5% Renter occupied
Language usage in Providence
English speakers - Total 53.1% of residents of Providence speak English at home.
36.6% of residents speak Spanish at home 32,156 48.8% Speak English very well33,683 51.2% Speak English less than very well10.4% of residents speak other language at home 12,555 67.2% Speak English very well6,120 32.8% Speak English less than very well
English speakers - Born in the United States 84.3% of residents of Providence speak English at home.
10.9% of residents speak Spanish at home 5,487 88.1% Speak English very well744 11.9% Speak English less than very well4.8% of residents speak other language at home 2,619 94.3% Speak English very well158 5.7% Speak English less than very well
English speakers - Native, born elsewhere 24.0% of residents of Providence speak English at home.
71.0% of residents speak Spanish at home 4,151 63.6% Speak English very well2,380 36.4% Speak English less than very well5.0% of residents speak other language at home 459 100.0% Speak English very well
English speakers - Foreign-born 11.8% of residents of Providence speak English at home.
66.0% of residents speak Spanish at home 12,648 30.3% Speak English very well29,121 69.7% Speak English less than very well22.2% of residents speak other language at home 8,271 58.8% Speak English very well5,798 41.2% Speak English less than very well
White (Caucasian) - Speak only English Native:
92.1% (61,519)Foreign-born:
19.1% (1,398)
White (Caucasian) - Speak another language Native:
7.9% (5,312)Foreign-born:
80.9% (5,921)
Black or African American - Speak only English Native:
84.5% (11,006)Foreign-born:
51.0% (2,946)
Black or African American - Speak another language Native:
15.5% (2,024)Foreign-born:
49.0% (2,828)
American Indian / Alaska Native - Speak another language Native:
41.2% (392)Foreign-born:
100.0% (370)
Asian - Speak only English Native:
52.3% (1,943)Foreign-born:
6.7% (638)
Asian - Speak another language Native:
47.7% (1,770)Foreign-born:
93.3% (8,865)
Other race - Speak only English Native:
26.1% (3,182)Foreign-born:
7.6% (2,010)
Other race - Speak another language Native:
73.9% (8,997)Foreign-born:
92.4% (24,350)
Two or more races - Speak only English Native:
50.6% (10,206)Foreign-born:
3.5% (483)
Two or more races - Speak another language Native:
49.4% (9,951)Foreign-born:
96.5% (13,255)
White alone - Speak only English Native:
95.8% (59,610)Foreign-born:
35.0% (1,292)
White alone - Speak another language Native:
4.2% (2,588)Foreign-born:
65.0% (2,401)
Hispanic or Latino - Speak only English Native:
32.4% (11,117)Foreign-born:
5.3% (2,320)
Hispanic or Latino - Speak another language Native:
67.6% (23,227)Foreign-born:
94.7% (41,788)
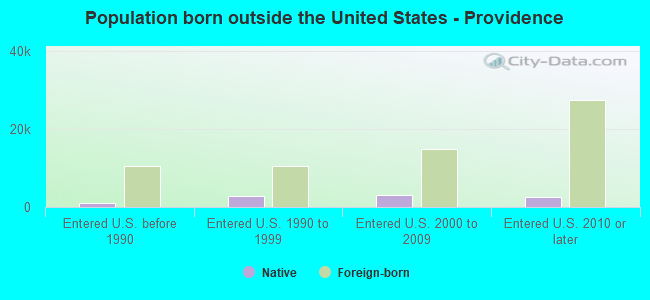
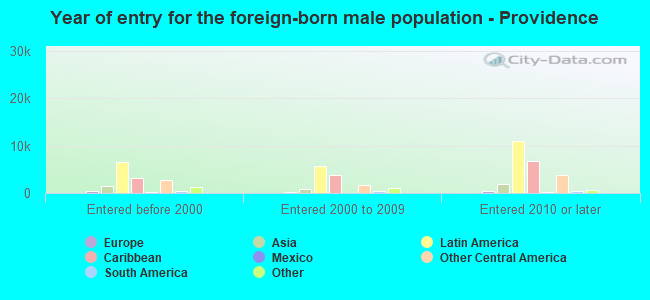
Foreign-born residents in Providence 61,187 residents are foreign born (21.4% Latin America , 4.2% Asia , 3.5% Africa ).
This city:
32.3%Rhode Island:
14.4%
Marital status for residents in Providence Marital status - White (Caucasian) population 15 years and over
Males 62.3% Never married25.0% Now married1.6% Separated5.1% Widowed6.0% DivorcedFemales 58.4% Never married20.4% Now married1.9% Separated7.0% Widowed12.2% DivorcedWomen who gave birth in the past 12 months Now married:
100.0% (528)Unmarried:
0.0% (0)
Women who did not give birth in the past 12 months Now married:
19.1% (4,601)Unmarried:
80.9% (19,543)
Marital status - Black or African American population 15 years and over
Males 65.2% Never married25.9% Now married1.1% Separated1.5% Widowed6.2% DivorcedFemales 63.9% Never married20.1% Now married2.2% Separated8.1% Widowed5.7% DivorcedWomen who gave birth in the past 12 months Now married:
55.9% (169)Unmarried:
44.1% (133)
Women who did not give birth in the past 12 months Now married:
15.0% (1,146)Unmarried:
85.0% (6,516)
Marital status - American Indian / Alaska Native population 15 years and over
Males 64.6% Never married27.7% Now married2.7% Separated0.0% Widowed5.0% DivorcedFemales 51.7% Never married24.6% Now married2.3% Separated6.8% Widowed14.6% DivorcedWomen who gave birth in the past 12 months Now married:
32.4% (14)Unmarried:
67.6% (29)
Women who did not give birth in the past 12 months Now married:
22.8% (64)Unmarried:
77.2% (216)
Marital status - Asian population 15 years and over
Males 41.1% Never married51.1% Now married0.0% Separated1.6% Widowed6.1% DivorcedFemales 57.9% Never married30.9% Now married0.6% Separated1.1% Widowed9.5% DivorcedWomen who gave birth in the past 12 months Now married:
100.0% (346)Unmarried:
0.0% (0)
Women who did not give birth in the past 12 months Now married:
14.5% (763)Unmarried:
85.5% (4,495)
Marital status - Native Hawaiian / Pacific Islander population 15 years and over
Males 0.0% Never married0.0% Now married58.0% Separated0.0% Widowed42.0% DivorcedFemales 100.0% Never married0.0% Now married0.0% Separated0.0% Widowed0.0% DivorcedWomen who did not give birth in the past 12 months Now married:
0.0% (0)Unmarried:
100.0% (36)
Marital status - Other race population 15 years and over
Males 50.9% Never married37.2% Now married0.0% Separated2.3% Widowed9.5% DivorcedFemales 42.1% Never married38.9% Now married8.8% Separated4.0% Widowed6.3% DivorcedWomen who gave birth in the past 12 months Now married:
49.3% (168)Unmarried:
50.7% (173)
Women who did not give birth in the past 12 months Now married:
35.1% (3,729)Unmarried:
64.9% (6,890)
Marital status - Two or more races population 15 years and over
Males 51.2% Never married45.2% Now married0.0% Separated3.0% Widowed0.6% DivorcedFemales 51.3% Never married31.6% Now married0.8% Separated8.0% Widowed8.2% DivorcedWomen who gave birth in the past 12 months Now married:
21.2% (128)Unmarried:
78.8% (477)
Women who did not give birth in the past 12 months Now married:
33.1% (3,210)Unmarried:
66.9% (6,486)
Marital status - White alone, not Hispanic / Latino population 15 years and over
Males 61.3% Never married25.9% Now married1.6% Separated4.4% Widowed6.8% DivorcedFemales 56.8% Never married20.2% Now married2.1% Separated7.6% Widowed13.3% DivorcedWomen who gave birth in the past 12 months Now married:
100.0% (528)Unmarried:
0.0% (0)
Women who did not give birth in the past 12 months Now married:
18.7% (4,015)Unmarried:
81.3% (17,429)
Marital status - Hispanic or Latino population 15 years and over
Males 51.8% Never married39.2% Now married0.4% Separated3.6% Widowed5.0% DivorcedFemales 47.4% Never married36.1% Now married4.7% Separated4.6% Widowed7.2% DivorcedWomen who gave birth in the past 12 months Now married:
18.7% (155)Unmarried:
81.3% (675)
Women who did not give birth in the past 12 months Now married:
38.7% (9,090)Unmarried:
61.3% (14,420)
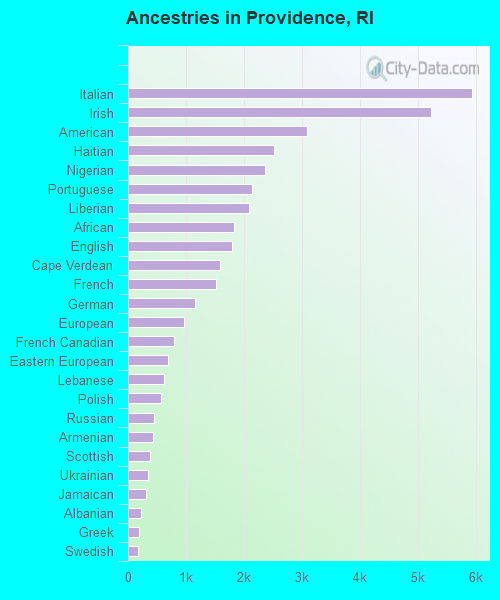
Ancestries in Providence
5,930 4.9% Italian5,229 4.3% Irish3,088 2.6% American2,515 2.1% Haitian2,368 2.0% Nigerian2,145 1.8% Portuguese2,083 1.7% Liberian1,820 1.5% African1,801 1.5% English1,595 1.3% Cape Verdean1,515 1.3% French1,152 1.0% German972 0.8% European793 0.7% French Canadian695 0.6% Eastern European615 0.5% Lebanese561 0.5% Polish445 0.4% Russian430 0.4% Armenian378 0.3% Scottish347 0.3% Ukrainian303 0.3% Jamaican219 0.2% Albanian194 0.2% Greek181 0.2% Swedish156 0.1% Syrian142 0.1% Brazilian139 0.1% Norwegian107 0.09% Canadian100 0.08% Slovak97 0.08% Romanian91 0.08% Ghanaian85 0.07% West Indian83 0.07% Palestinian81 0.07% Scotch-Irish80 0.07% Welsh66 0.05% Egyptian65 0.05% Barbadian60 0.05% Hungarian59 0.05% Danish58 0.05% Swiss55 0.05% British54 0.04% Kenyan53 0.04% Scandinavian49 0.04% Iranian47 0.04% Dutch45 0.04% Czech42 0.03% Arab41 0.03% Guyanese41 0.03% Turkish40 0.03% Belizean30 0.02% Moroccan30 0.02% Australian29 0.02% Slavic28 0.02% British West Indian26 0.02% Ethiopian21 0.02% Northern European20 0.02% Pennsylvania German16 0.01% Latvian15 0.01% Czechoslovakian13 0.01% Croatian13 0.01% Lithuanian13 0.01% Trinidadian and Tobagonian12 0.01% Israeli
Geographical mobility in Providence Same house 1 year ago 60,885 79.0% White (Caucasian)16,008 85.1% Black or African American980 75.8% American Indian / Alaska Native9,443 71.5% Asian54 60.2% Native Hawaiian / Pacific Islander37,411 94.1% Other race31,557 85.9% Two or more races51,944 77.1% White alone, not Hispanic / Latino76,862 91.0% Hispanic or LatinoMoved within same county 6,505 8.4% White / Caucasian1,634 8.7% Black or African American237 18.4% American Indian / Alaska Native687 5.2% Asian34 38.3% Native Hawaiian / Pacific Islander1,394 3.5% Other race3,394 9.2% Two or more races5,962 8.9% White alone, not Hispanic / Latino5,452 6.5% Hispanic or LatinoMoved within same state 797 1.0% White / Caucasian72 0.5% Asian120 0.3% Other race643 1.8% Two or more races772 1.1% White alone, not Hispanic / Latino421 0.5% Hispanic or LatinoMoved from different state 8,247 10.7% White / Caucasian811 4.3% Black or African American33 2.6% American Indian / Alaska Native1,566 11.8% Asian413 1.0% Other race624 1.7% Two or more races8,090 12.0% White alone, not Hispanic / Latino709 0.8% Hispanic or LatinoMoved from abroad 613 0.8% White351 1.9% Black or African American1,448 11.0% Asian318 0.8% Other race500 1.4% Two or more races592 0.9% White alone, not Hispanic / Latino976 1.2% Hispanic or Latino
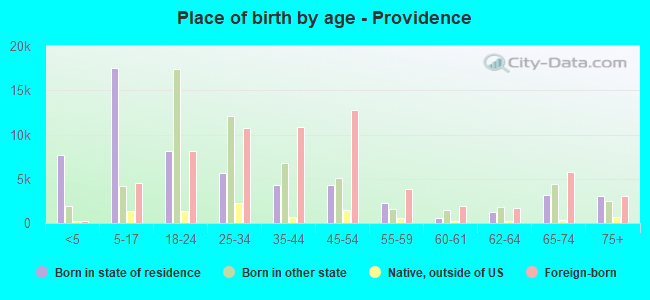
Children Nativity (place of birth) in Providence
Children under 6 years - Living with two parents Both parents native 1,591 100.0% NativeBoth parents foreign-born 2,053 100.0% NativeOne native, one foreign-born parent 629 100.0% NativeChildren under 6 years - Living with one parent Native parent 1,406 100.0% NativeForeign-born parent 4,890 100.0% NativeChildren 6 to 17 years - Living with two parents Both parents native 2,397 100.0% NativeBoth parents foreign-born 4,413 74.7% Native1,496 25.3% Foreign-bornOne native, one foreign-born parent 2,998 94.1% Native187 5.9% Foreign-bornChildren 6 to 17 years - Living with one parent Native parent 4,027 100.0% NativeForeign-born parent 6,648 59.6% Native4,500 40.4% Foreign-born
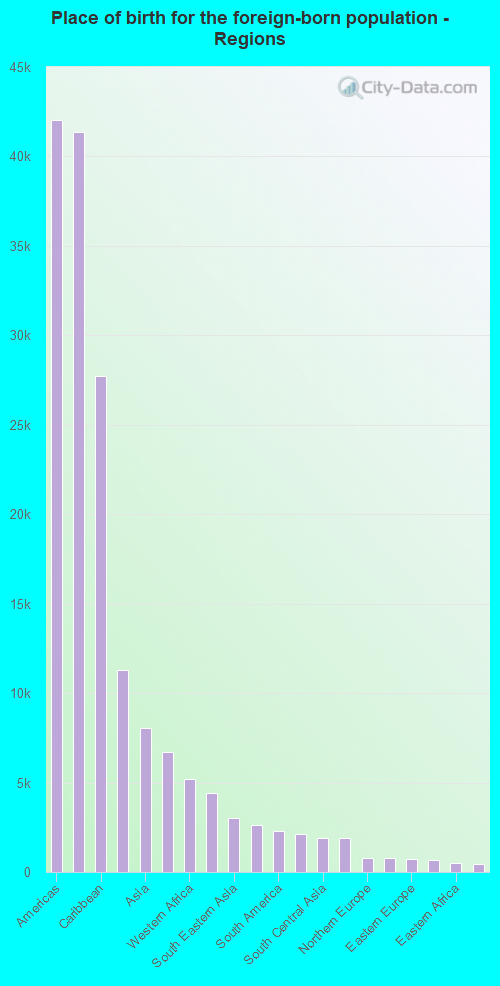
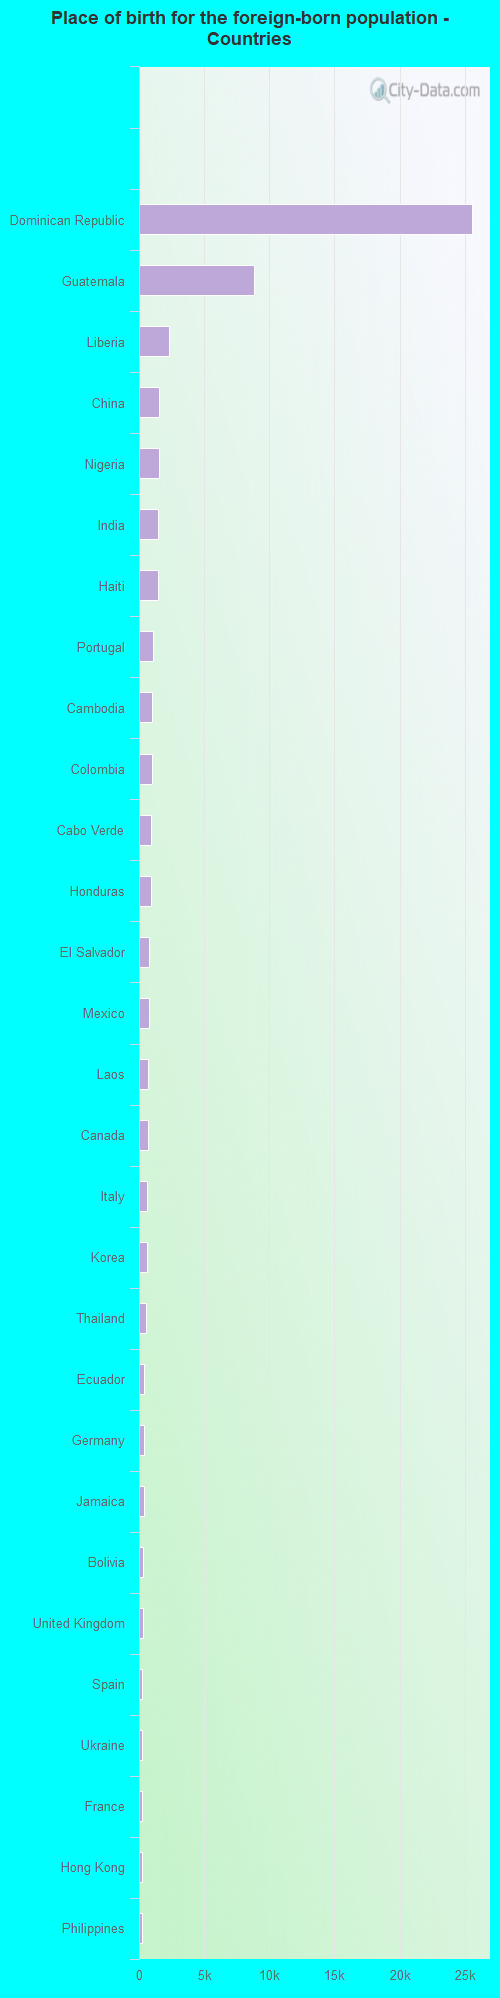
Place of birth for residents in Providence 42,025 Americas41,344 Latin America27,746 Caribbean11,305 Central America8,051 Asia6,695 Africa5,189 Western Africa4,393 Europe3,042 South Eastern Asia2,605 Eastern Asia2,292 South America2,097 Southern Europe1,918 South Central Asia1,882 China790 Northern Europe782 Western Europe723 Eastern Europe680 Northern America478 Eastern Africa473 Western Asia182 Northern Africa44 Middle Africa21 Oceania21 Australia and New Zealand Subregion25,582 Dominican Republic8,789 Guatemala2,311 Liberia1,512 China1,510 Nigeria1,471 India1,437 Haiti1,105 Portugal1,020 Cambodia1,011 Colombia929 Cabo Verde883 Honduras736 El Salvador730 Mexico684 Laos673 Canada649 Italy612 Korea521 Thailand417 Ecuador388 Germany377 Jamaica312 Bolivia290 United Kingdom265 Spain259 Ukraine255 France240 Hong Kong234 Philippines201 Trinidad and Tobago200 Pakistan195 Ghana186 Venezuela169 Singapore164 Vietnam148 Ireland144 England134 Syria133 Panama130 Azores Islands129 Taiwan129 Israel127 Morocco122 Lebanon119 Kenya119 Burma (Myanmar)110 Japan105 Iran97 Romania95 Albania91 Brazil84 Peru79 Chile77 Nepal77 Greece77 Switzerland77 Denmark73 Malaysia69 Sweden62 Russia56 Hungary55 Indonesia54 Cuba52 Barbados48 Kazakhstan45 Czechoslovakia45 Egypt44 Democratic Republic of Congo (Zaire)41 Netherlands39 Eritrea37 Scotland36 Dominica33 Saudi Arabia32 Nicaragua27 Belarus25 Bosnia and Herzegovina25 Poland24 Senegal21 Australia18 United Arab Emirates18 Belgium17 Guyana12 Uruguay11 Norway10 Uzbekistan9 Algeria9 Armenia9 Turkey8 Iraq6 Tanzania5 West Indies4 Bangladesh4 Argentina3 Serbia
Grandparents responsible for own grandchildren in Providence
Grandparents (30 to 59 years) White / Caucasian 139 33.1% Responsible for grandchildren281 66.9% Not responsible for grandchildrenBlack or African American 97 41.7% Responsible for grandchildren136 58.3% Not responsible for grandchildrenAsian 13 100.0% Not responsible for grandchildrenOther race 110 36.9% Responsible for grandchildren189 63.1% Not responsible for grandchildrenTwo or more races 139 56.2% Responsible for grandchildren108 43.8% Not responsible for grandchildrenWhite alone, not Hispanic / Latino 39 16.7% Responsible for grandchildren192 83.3% Not responsible for grandchildrenHispanic or Latino 395 44.0% Responsible for grandchildren502 56.0% Not responsible for grandchildrenGrandparents (60 years and over) White / Caucasian 33 17.7% Responsible for grandchildren152 82.3% Not responsible for grandchildrenBlack or African American 147 49.8% Responsible for grandchildren148 50.2% Not responsible for grandchildrenAsian 136 100.0% Not responsible for grandchildrenOther race 181 21.7% Responsible for grandchildren652 78.3% Not responsible for grandchildrenTwo or more races 54 15.8% Responsible for grandchildren288 84.2% Not responsible for grandchildrenWhite alone, not Hispanic / Latino 27 24.6% Responsible for grandchildren84 75.4% Not responsible for grandchildrenHispanic or Latino 244 20.9% Responsible for grandchildren923 79.1% Not responsible for grandchildren