Races in Provo, Utah (UT) Detailed Stats
Data:
Races - White alone (%)
Races - White alone (% change since 2000)
Races - Black alone (%)
Races - Black alone (% change since 2000)
Races - American Indian alone (%)
Races - American Indian alone (% change since 2000)
Races - Asian alone (%)
Races - Asian alone (% change since 2000)
Races - Hispanic (%)
Races - Hispanic (% change since 2000)
Races - Native Hawaiian and Other Pacific Islander alone (%)
Races - Native Hawaiian and Other Pacific Islander alone (% change since 2000)
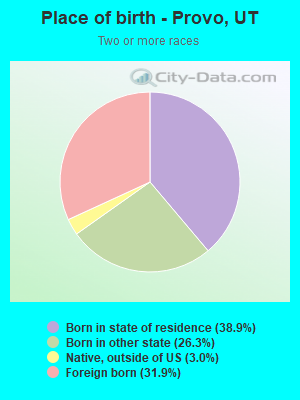
Races - Two or more races(%)
Races - Two or more races(% change since 2000)
Races - Other race alone (%)
Races - Other race alone (% change since 2000)
Racial diversity
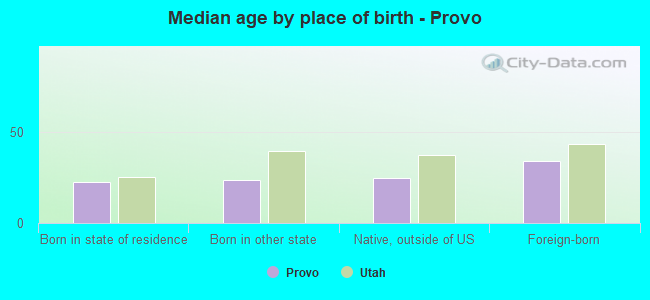
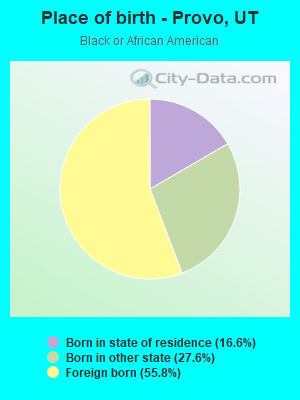
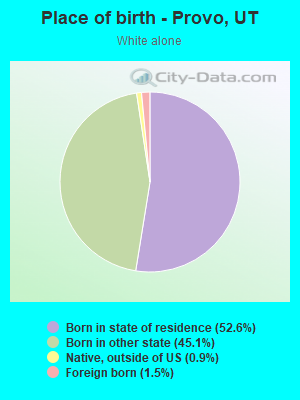
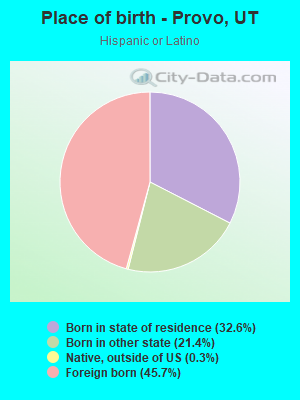
Place of birth - Born in state of residence (%)
Place of birth - Born in state of residence (%) - White
Place of birth - Born in state of residence (%) - Black or African American
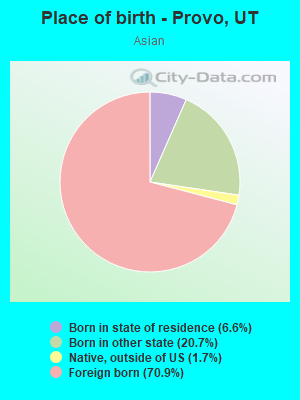
Place of birth - Born in state of residence (%) - Asian
Place of birth - Born in state of residence (%) - Hispanic or Latino
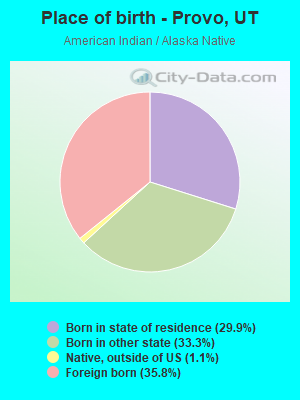
Place of birth - Born in state of residence (%) - American Indian and Alaska Native
Place of birth - Born in state of residence (%) - Multirace
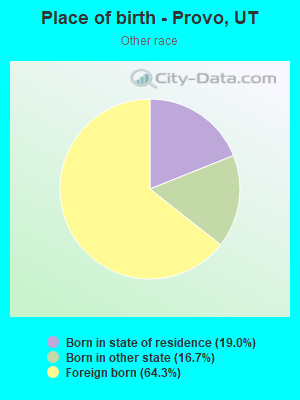
Place of birth - Born in state of residence (%) - Other Race
Place of birth - Born in other state (%)
Place of birth - Born in other state (%) - White
Place of birth - Born in other state (%) - Black or African American
Place of birth - Born in other state (%) - Asian
Place of birth - Born in other state (%) - Hispanic or Latino
Place of birth - Born in other state (%) - American Indian and Alaska Native
Place of birth - Born in other state (%) - Multirace
Place of birth - Born in other state (%) - Other Race
Place of birth - Native, outside of US (%)
Place of birth - Native, outside of US (%) - White
Place of birth - Native, outside of US (%) - Black or African American
Place of birth - Native, outside of US (%) - Asian
Place of birth - Native, outside of US (%) - Hispanic or Latino
Place of birth - Native, outside of US (%) - American Indian and Alaska Native
Place of birth - Native, outside of US (%) - Multirace
Place of birth - Native, outside of US (%) - Other Race
Place of birth - Foreign born (%)
Place of birth - Foreign born (%) - White
Place of birth - Foreign born (%) - Black or African American
Place of birth - Foreign born (%) - Asian
Place of birth - Foreign born (%) - Hispanic or Latino
Place of birth - Foreign born (%) - American Indian and Alaska Native
Place of birth - Foreign born (%) - Multirace
Place of birth - Foreign born (%) - Other Race
Residents speaking English at home (%)
Residents speaking English at home - Born in the United States (%)
Residents speaking English at home - Native, born elsewhere (%)
Residents speaking English at home - Foreign born (%)
Residents speaking Spanish at home (%)
Residents speaking Spanish at home - Born in the United States (%)
Residents speaking Spanish at home - Native, born elsewhere (%)
Residents speaking Spanish at home - Foreign born (%)
Residents speaking other language at home (%)
Residents speaking other language at home - Born in the United States (%)
Residents speaking other language at home - Native, born elsewhere (%)
Residents speaking other language at home - Foreign born (%)
Marital status - Never married (%)
Marital status - Now married (%)
Marital status - Separated (%)
Marital status - Widowed (%)
Marital status - Divorced (%)
Ancestries Reported - Arab (%)
Ancestries Reported - Czech (%)
Ancestries Reported - Danish (%)
Ancestries Reported - Dutch (%)
Ancestries Reported - English (%)
Ancestries Reported - French (%)
Ancestries Reported - French Canadian (%)
Ancestries Reported - German (%)
Ancestries Reported - Greek (%)
Ancestries Reported - Hungarian (%)
Ancestries Reported - Irish (%)
Ancestries Reported - Italian (%)
Ancestries Reported - Lithuanian (%)
Ancestries Reported - Norwegian (%)
Ancestries Reported - Polish (%)
Ancestries Reported - Portuguese (%)
Ancestries Reported - Russian (%)
Ancestries Reported - Scotch-Irish (%)
Ancestries Reported - Scottish (%)
Ancestries Reported - Slovak (%)
Ancestries Reported - Subsaharan African (%)
Ancestries Reported - Swedish (%)
Ancestries Reported - Swiss (%)
Ancestries Reported - Ukrainian (%)
Ancestries Reported - United States (%)
Ancestries Reported - Welsh (%)
Ancestries Reported - West Indian (%)
Ancestries Reported - Other (%)
Geographical mobility - Same house 1 year ago (%)
Geographical mobility - Same house 1 year ago (%) - White
Geographical mobility - Same house 1 year ago (%) - Black or African American
Geographical mobility - Same house 1 year ago (%) - Asian
Geographical mobility - Same house 1 year ago (%) - Hispanic or Latino
Geographical mobility - Same house 1 year ago (%) - American Indian and Alaska Native
Geographical mobility - Same house 1 year ago (%) - Multirace
Geographical mobility - Same house 1 year ago (%) - Other Race
Geographical mobility - Moved within same county (%)
Geographical mobility - Moved within same county (%) - White
Geographical mobility - Moved within same county (%) - Black or African American
Geographical mobility - Moved within same county (%) - Asian
Geographical mobility - Moved within same county (%) - Hispanic or Latino
Geographical mobility - Moved within same county (%) - American Indian and Alaska Native
Geographical mobility - Moved within same county (%) - Multirace
Geographical mobility - Moved within same county (%) - Other Race
Geographical mobility - Moved from different county within same state (%)
Geographical mobility - Moved from different county within same state (%) - White
Geographical mobility - Moved from different county within same state (%) - Black or African American
Geographical mobility - Moved from different county within same state (%) - Asian
Geographical mobility - Moved from different county within same state (%) - Hispanic or Latino
Geographical mobility - Moved from different county within same state (%) - American Indian and Alaska Native
Geographical mobility - Moved from different county within same state (%) - Multirace
Geographical mobility - Moved from different county within same state (%) - Other Race
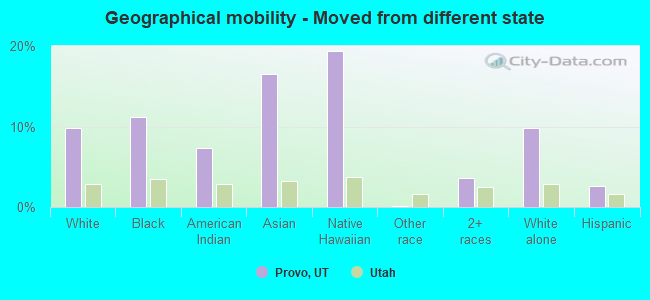
Geographical mobility - Moved from different state (%)
Geographical mobility - Moved from different state (%) - White
Geographical mobility - Moved from different state (%) - Black or African American
Geographical mobility - Moved from different state (%) - Asian
Geographical mobility - Moved from different state (%) - Hispanic or Latino
Geographical mobility - Moved from different state (%) - American Indian and Alaska Native
Geographical mobility - Moved from different state (%) - Multirace
Geographical mobility - Moved from different state (%) - Other Race
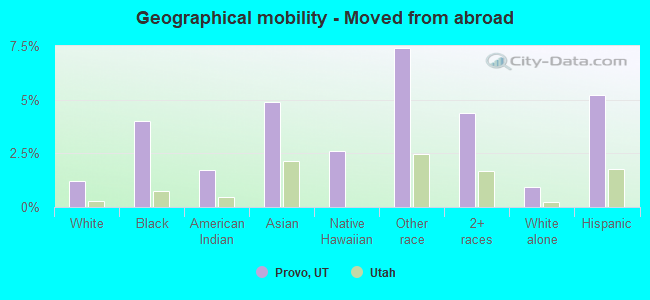
Geographical mobility - Moved from abroad (%)
Geographical mobility - Moved from abroad (%) - White
Geographical mobility - Moved from abroad (%) - Black or African American
Geographical mobility - Moved from abroad (%) - Asian
Geographical mobility - Moved from abroad (%) - Hispanic or Latino
Geographical mobility - Moved from abroad (%) - American Indian and Alaska Native
Geographical mobility - Moved from abroad (%) - Multirace
Geographical mobility - Moved from abroad (%) - Other Race
Place of birth for the foreign-born population - Ireland (%)
Place of birth for the foreign-born population - Denmark (%)
Place of birth for the foreign-born population - Norway (%)
Place of birth for the foreign-born population - Sweden (%)
Place of birth for the foreign-born population - United Kingdom (%)
Place of birth for the foreign-born population - England (%)
Place of birth for the foreign-born population - Scotland (%)
Place of birth for the foreign-born population - Other Northern Europe (%)
Place of birth for the foreign-born population - Austria (%)
Place of birth for the foreign-born population - Belgium (%)
Place of birth for the foreign-born population - France (%)
Place of birth for the foreign-born population - Germany (%)
Place of birth for the foreign-born population - Netherlands (%)
Place of birth for the foreign-born population - Switzerland (%)
Place of birth for the foreign-born population - Other Western Europe (%)
Place of birth for the foreign-born population - Greece (%)
Place of birth for the foreign-born population - Italy (%)
Place of birth for the foreign-born population - Portugal (%)
Place of birth for the foreign-born population - Spain (%)
Place of birth for the foreign-born population - Other Southern Europe (%)
Place of birth for the foreign-born population - Albania (%)
Place of birth for the foreign-born population - Belarus (%)
Place of birth for the foreign-born population - Bosnia and Herzegovina (%)
Place of birth for the foreign-born population - Bulgaria (%)
Place of birth for the foreign-born population - Croatia (%)
Place of birth for the foreign-born population - Czechoslovakia (%)
Place of birth for the foreign-born population - Hungary (%)
Place of birth for the foreign-born population - Latvia (%)
Place of birth for the foreign-born population - Lithuania (%)
Place of birth for the foreign-born population - North Macedonia (Macedonia) (%)
Place of birth for the foreign-born population - Moldova (%)
Place of birth for the foreign-born population - Poland (%)
Place of birth for the foreign-born population - Romania (%)
Place of birth for the foreign-born population - Russia (%)
Place of birth for the foreign-born population - Serbia (%)
Place of birth for the foreign-born population - Ukraine (%)
Place of birth for the foreign-born population - Other Eastern Europe (%)
Place of birth for the foreign-born population - China (%)
Place of birth for the foreign-born population - Hong Kong (%)
Place of birth for the foreign-born population - Taiwan (%)
Place of birth for the foreign-born population - Japan (%)
Place of birth for the foreign-born population - Korea (%)
Place of birth for the foreign-born population - Other Eastern Asia (%)
Place of birth for the foreign-born population - Afghanistan (%)
Place of birth for the foreign-born population - Bangladesh (%)
Place of birth for the foreign-born population - India (%)
Place of birth for the foreign-born population - Iran (%)
Place of birth for the foreign-born population - Kazakhstan (%)
Place of birth for the foreign-born population - Nepal (%)
Place of birth for the foreign-born population - Pakistan (%)
Place of birth for the foreign-born population - Sri Lanka (%)
Place of birth for the foreign-born population - Uzbekistan (%)
Place of birth for the foreign-born population - Other South Central Asia (%)
Place of birth for the foreign-born population - Burma (%)
Place of birth for the foreign-born population - Cambodia (%)
Place of birth for the foreign-born population - Indonesia (%)
Place of birth for the foreign-born population - Laos (%)
Place of birth for the foreign-born population - Malaysia (%)
Place of birth for the foreign-born population - Philippines (%)
Place of birth for the foreign-born population - Singapore (%)
Place of birth for the foreign-born population - Thailand (%)
Place of birth for the foreign-born population - Vietnam (%)
Place of birth for the foreign-born population - Other South Eastern Asia (%)
Place of birth for the foreign-born population - Armenia (%)
Place of birth for the foreign-born population - Iraq (%)
Place of birth for the foreign-born population - Israel (%)
Place of birth for the foreign-born population - Jordan (%)
Place of birth for the foreign-born population - Kuwait (%)
Place of birth for the foreign-born population - Lebanon (%)
Place of birth for the foreign-born population - Saudi Arabia (%)
Place of birth for the foreign-born population - Syria (%)
Place of birth for the foreign-born population - Turkey (%)
Place of birth for the foreign-born population - Yemen (%)
Place of birth for the foreign-born population - Other Western Asia (%)
Place of birth for the foreign-born population - Eritrea (%)
Place of birth for the foreign-born population - Ethiopia (%)
Place of birth for the foreign-born population - Kenya (%)
Place of birth for the foreign-born population - Somalia (%)
Place of birth for the foreign-born population - Uganda (%)
Place of birth for the foreign-born population - Zimbabwe (%)
Place of birth for the foreign-born population - Other Eastern Africa (%)
Place of birth for the foreign-born population - Cameroon (%)
Place of birth for the foreign-born population - Congo (%)
Place of birth for the foreign-born population - Democratic Republic of Congo (Zaire) (%)
Place of birth for the foreign-born population - Other Middle Africa (%)
Place of birth for the foreign-born population - Egypt (%)
Place of birth for the foreign-born population - Morocco (%)
Place of birth for the foreign-born population - Sudan (%)
Place of birth for the foreign-born population - Other Northern Africa (%)
Place of birth for the foreign-born population - South Africa (%)
Place of birth for the foreign-born population - Other Southern Africa (%)
Place of birth for the foreign-born population - Cabo Verde (%)
Place of birth for the foreign-born population - Ghana (%)
Place of birth for the foreign-born population - Liberia (%)
Place of birth for the foreign-born population - Nigeria (%)
Place of birth for the foreign-born population - Senegal (%)
Place of birth for the foreign-born population - Sierra Leone (%)
Place of birth for the foreign-born population - Other Western Africa (%)
Place of birth for the foreign-born population - Australia (%)
Place of birth for the foreign-born population - New Zealand (%)
Place of birth for the foreign-born population - Fiji (%)
Place of birth for the foreign-born population - Micronesia (%)
Place of birth for the foreign-born population - Bahamas (%)
Place of birth for the foreign-born population - Barbados (%)
Place of birth for the foreign-born population - Cuba (%)
Place of birth for the foreign-born population - Dominica (%)
Place of birth for the foreign-born population - Dominican Republic (%)
Place of birth for the foreign-born population - Grenada (%)
Place of birth for the foreign-born population - Haiti (%)
Place of birth for the foreign-born population - Jamaica (%)
Place of birth for the foreign-born population - St. Vincent and the Grenadines (%)
Place of birth for the foreign-born population - Trinidad and Tobago (%)
Place of birth for the foreign-born population - West Indies (%)
Place of birth for the foreign-born population - Other Caribbean (%)
Place of birth for the foreign-born population - Belize (%)
Place of birth for the foreign-born population - Costa Rica (%)
Place of birth for the foreign-born population - El Salvador (%)
Place of birth for the foreign-born population - Guatemala (%)
Place of birth for the foreign-born population - Honduras (%)
Place of birth for the foreign-born population - Mexico (%)
Place of birth for the foreign-born population - Nicaragua (%)
Place of birth for the foreign-born population - Panama (%)
Place of birth for the foreign-born population - Other Central America (%)
Place of birth for the foreign-born population - Argentina (%)
Place of birth for the foreign-born population - Bolivia (%)
Place of birth for the foreign-born population - Brazil (%)
Place of birth for the foreign-born population - Chile (%)
Place of birth for the foreign-born population - Colombia (%)
Place of birth for the foreign-born population - Ecuador (%)
Place of birth for the foreign-born population - Guyana (%)
Place of birth for the foreign-born population - Peru (%)
Place of birth for the foreign-born population - Uruguay (%)
Place of birth for the foreign-born population - Venezuela (%)
Place of birth for the foreign-born population - Other South America (%)
Place of birth for the foreign-born population - Canada (%)
Place of birth for the foreign-born population - Other Northern America (%)
Place of birth for the foreign-born population - Other (%)
Latest news about races in Provo, UT collected exclusively by city-data.com from local newspapers, TV, and radio stations
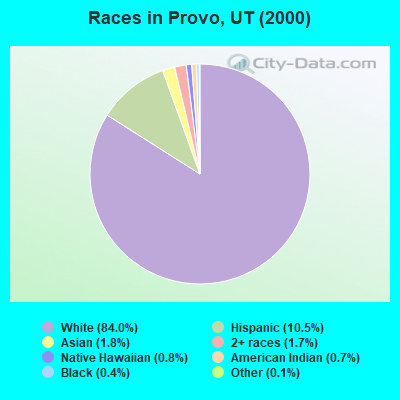
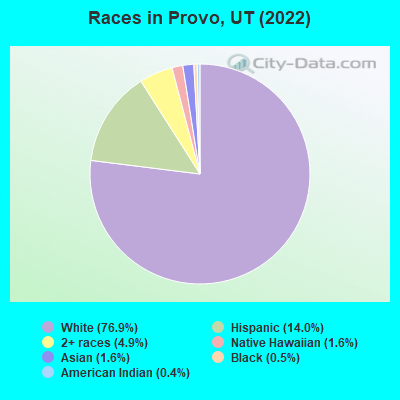
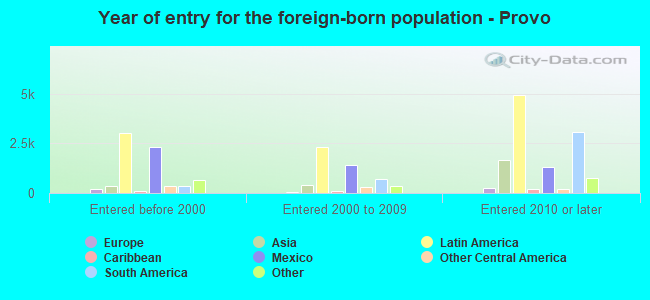
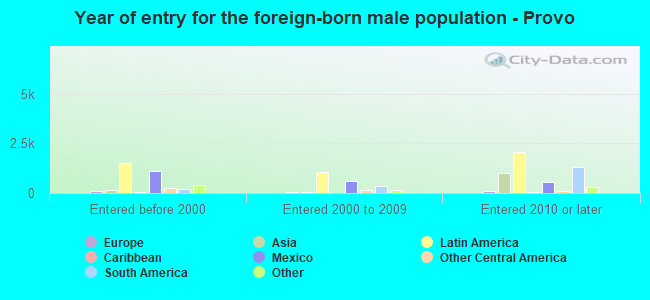
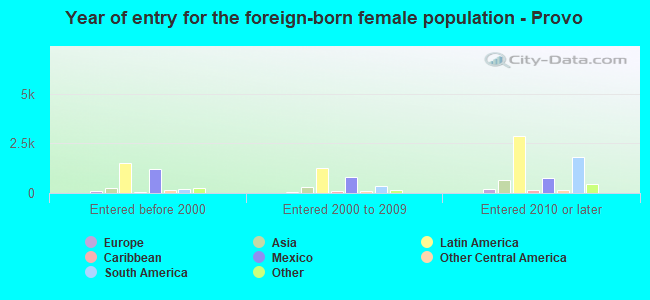
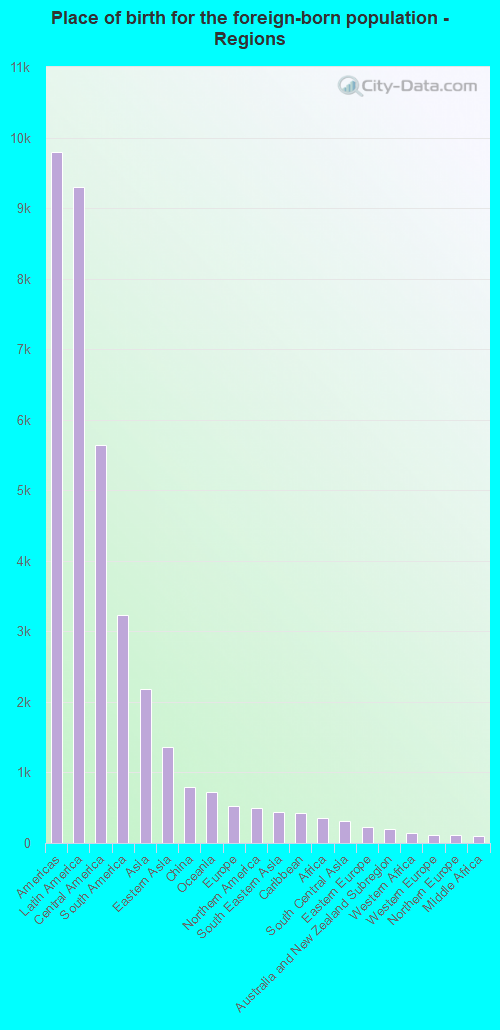
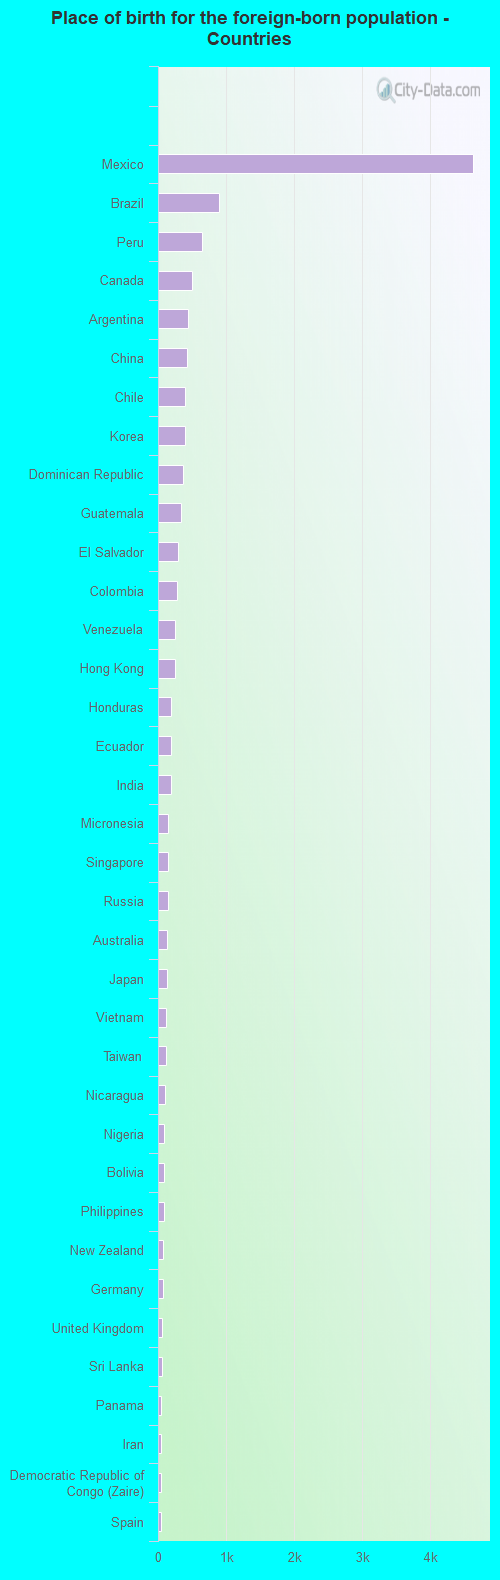
According to 2022 data, the most numerous races in Provo, UT are White alone (87,296 residents), Hispanic (15,861 residents), and Two or more races (5,616 residents). 76.3% of Provo residents speak English at home. 11.3% of Provo, UT residents are foreign-born (7.7% born in Latin America, 1.8% born in Asia), which is 28.9% greater than the foreign-born rate of 8.0% across the entire state of Utah.
Race distribution in Provo
2000 2022
1,904,265 85.3% White alone 201,559 9.0% Hispanic 36,483 1.6% Asian alone 31,308 1.4% Two or more races 26,663 1.2% American Indian alone 14,806 0.7% Native Hawaiian and Other 16,137 0.7% Black alone 1,948 0.09% Other race alone
2,557,466 75.6% White alone 512,086 15.1% Hispanic 119,308 3.5% Two or more races 82,388 2.4% Asian alone 36,978 1.1% Native Hawaiian and Other 34,873 1.0% Black alone 22,803 0.7% American Indian alone 14,898 0.4% Other race alone
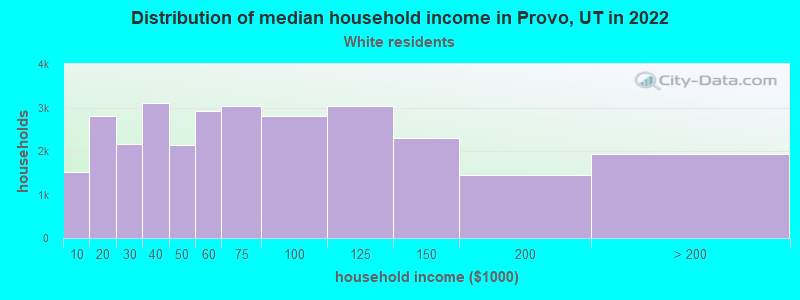
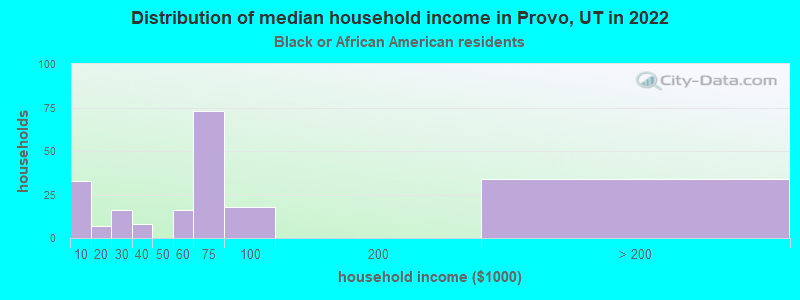
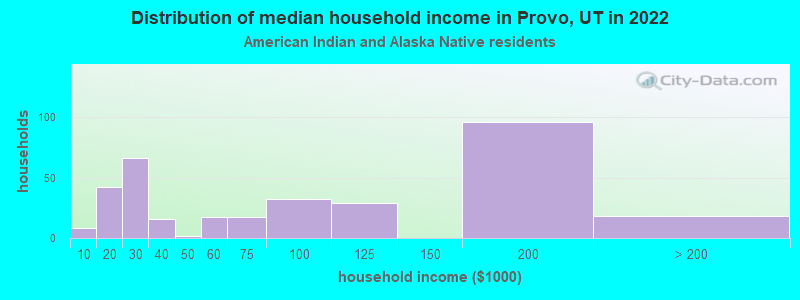
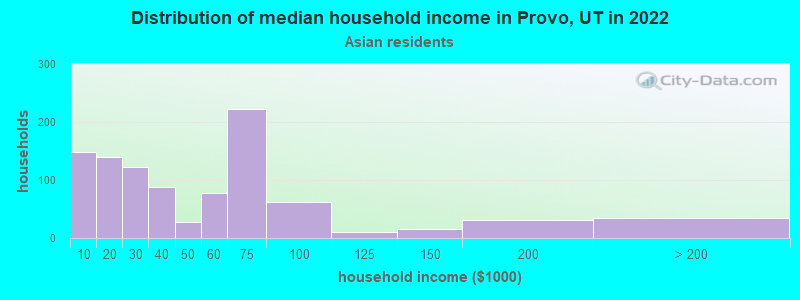
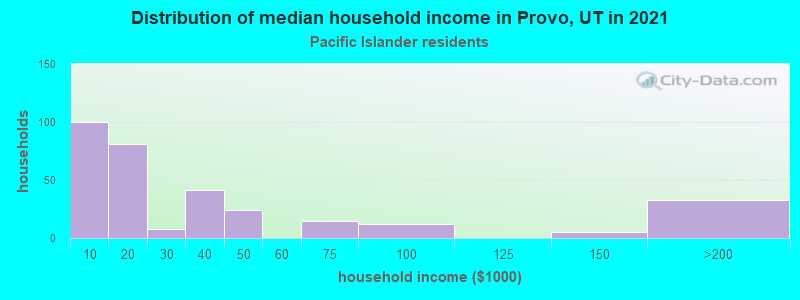
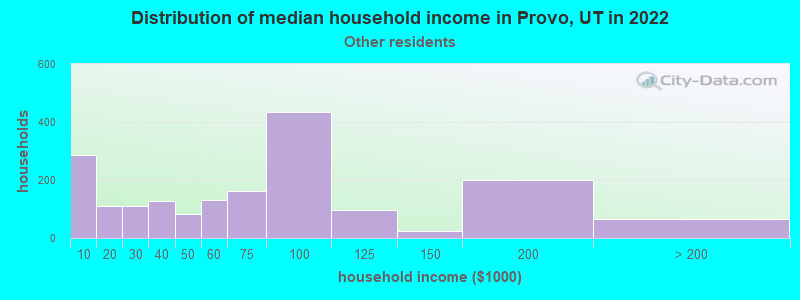
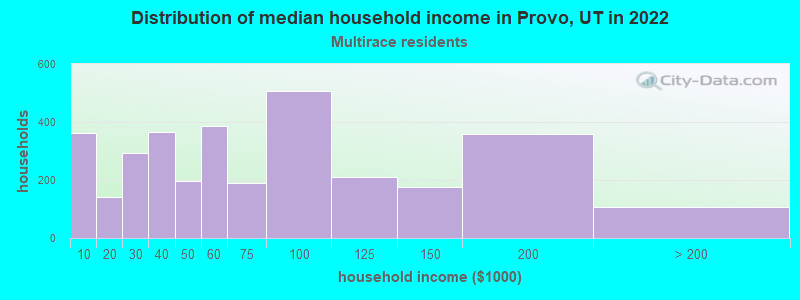
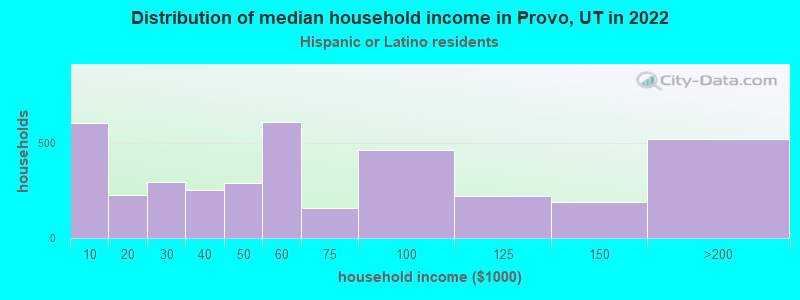
Income and house value in Provo Median household income in 2022 $60,366 White non-Hispanic householders$64,012 Black householders$160,954 American Indian and Alaska Native householders$48,974 Asian householders$76,683 Native Hawaiian and other Pacific Islander householders$48,571 Some other race householders$66,201 Two or more races householders$55,799 Hispanic or Latino race householdersMedian 2022 house value $506,033 White Non-Hispanic householders$352,499 Black or African American householders$461,266 American Indian or Alaska Native householders $474,531 Asian householders$462,924 Native Hawaiian and other Pacific Islander householders$429,100 Some other race householders$450,655 Two or more races householders$440,043 Hispanic or Latino householders
Median age by race in Provo
23.3 Median age for White residents23.8 22.8 22.6 Median age for Black or African American residents21.4 23.8 26.6 Median age for American Indian / Alaska Native residents28.6 22.1 25.6 Median age for Asian residents28.1 22.6 24.5 Median age for Native Hawaiian / Pacific Islander residents24.4 25.4 24.4 Median age for Other race residents24.4 24.3 24.7 Median age for Two or more races residents24.8 24.4 23.3 Median age for White alone residents23.8 22.8 24.1 Median age for Hispanic or Latino residents25.2 23.0
Owner/renter occupied households by race in Provo
House owners and renters - White residents 11,539 39.5% Owner occupied17,643 60.5% Renter occupiedHouse owners and renters - Black or African American residents 53 26.3% Owner occupied149 73.7% Renter occupiedHouse owners and renters - American Indian / Alaska Native residents 101 49.8% Owner occupied102 50.2% Renter occupiedHouse owners and renters - Asian residents 284 47.0% Owner occupied320 53.0% Renter occupiedHouse owners and renters - Native Hawaiian / Pacific Islander residents 127 37.3% Owner occupied214 62.7% Renter occupiedHouse owners and renters - Other race residents 445 37.6% Owner occupied739 62.4% Renter occupiedHouse owners and renters - Two or more races residents 718 22.7% Owner occupied2,439 77.3% Renter occupiedHouse owners and renters - White alone residents 11,136 39.6% Owner occupied16,987 60.4% Renter occupiedHouse owners and renters - Hispanic or Latino residents 1,358 35.6% Owner occupied2,461 64.4% Renter occupied
Language usage in Provo
English speakers - Total 76.3% of residents of Provo speak English at home.
14.9% of residents speak Spanish at home 11,151 70.2% Speak English very well4,737 29.8% Speak English less than very well8.8% of residents speak other language at home 7,821 83.1% Speak English very well1,588 16.9% Speak English less than very well
English speakers - Born in the United States 82.6% of residents of Provo speak English at home.
10.4% of residents speak Spanish at home 4,501 96.6% Speak English very well160 3.4% Speak English less than very well7.0% of residents speak other language at home 2,928 94.0% Speak English very well188 6.0% Speak English less than very well
English speakers - Native, born elsewhere 75.0% of residents of Provo speak English at home.
10.5% of residents speak Spanish at home 113 67.7% Speak English very well54 32.3% Speak English less than very well14.5% of residents speak other language at home 230 100.0% Speak English very well
English speakers - Foreign-born 11.2% of residents of Provo speak English at home.
62.2% of residents speak Spanish at home 3,260 43.9% Speak English very well4,160 56.1% Speak English less than very well26.6% of residents speak other language at home 1,923 60.5% Speak English very well1,257 39.5% Speak English less than very well
White (Caucasian) - Speak only English Native:
87.3% (73,828)Foreign-born:
21.4% (636)
White (Caucasian) - Speak another language Native:
12.7% (10,756)Foreign-born:
78.6% (2,332)
Black or African American - Speak only English Native:
78.1% (385)Foreign-born:
13.9% (104)
Black or African American - Speak another language Native:
21.7% (107)Foreign-born:
55.0% (412)
American Indian / Alaska Native - Speak only English Native:
57.1% (459)Foreign-born:
8.2% (52)
American Indian / Alaska Native - Speak another language Native:
43.2% (348)Foreign-born:
91.4% (578)
Asian - Speak only English Native:
49.7% (167)Foreign-born:
24.5% (340)
Asian - Speak another language Native:
50.3% (169)Foreign-born:
75.5% (1,045)
Native Hawaiian / Pacific Islander - Speak another language Native:
17.4% (209)Foreign-born:
100.0% (670)
Other race - Speak another language Native:
70.7% (915)Foreign-born:
100.0% (2,570)
Two or more races - Speak only English Native:
62.0% (4,039)Foreign-born:
4.4% (175)
Two or more races - Speak another language Native:
38.0% (2,480)Foreign-born:
95.6% (3,790)
White alone - Speak only English Native:
88.5% (72,829)Foreign-born:
48.4% (636)
White alone - Speak another language Native:
11.5% (9,430)Foreign-born:
51.6% (679)
Hispanic or Latino - Speak only English Native:
41.2% (2,637)Foreign-born:
0.8% (61)
Hispanic or Latino - Speak another language Native:
58.8% (3,762)Foreign-born:
99.2% (7,194)
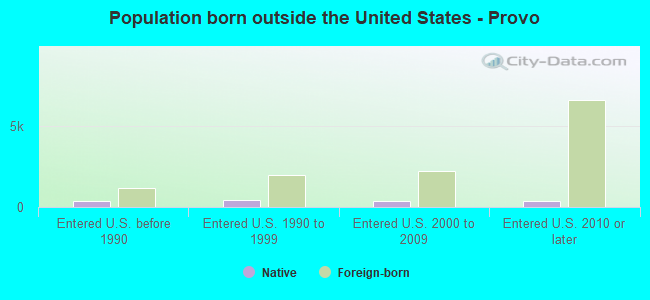
Foreign-born residents in Provo 13,577 residents are foreign born (7.7% Latin America , 1.8% Asia ).
Marital status for residents in Provo Marital status - White (Caucasian) population 15 years and over
Males 51.3% Never married45.2% Now married0.3% Separated0.6% Widowed2.6% DivorcedFemales 50.8% Never married42.0% Now married0.2% Separated3.2% Widowed3.8% DivorcedWomen who gave birth in the past 12 months Now married:
92.6% (1,494)Unmarried:
7.4% (119)
Women who did not give birth in the past 12 months Now married:
34.9% (11,136)Unmarried:
65.1% (20,781)
Marital status - Black or African American population 15 years and over
Males 69.8% Never married25.8% Now married0.5% Separated0.0% Widowed3.9% DivorcedFemales 58.7% Never married33.5% Now married2.7% Separated3.1% Widowed2.0% DivorcedWomen who gave birth in the past 12 months Now married:
71.2% (46)Unmarried:
28.8% (19)
Women who did not give birth in the past 12 months Now married:
32.2% (126)Unmarried:
67.8% (266)
Marital status - American Indian / Alaska Native population 15 years and over
Males 51.6% Never married23.0% Now married16.9% Separated0.0% Widowed8.5% DivorcedFemales 65.5% Never married29.7% Now married0.0% Separated0.0% Widowed4.8% DivorcedWomen who gave birth in the past 12 months Now married:
0.0% (0)Unmarried:
100.0% (32)
Women who did not give birth in the past 12 months Now married:
32.8% (209)Unmarried:
67.2% (428)
Marital status - Asian population 15 years and over
Males 66.2% Never married30.3% Now married0.0% Separated0.0% Widowed3.5% DivorcedFemales 45.8% Never married52.7% Now married0.0% Separated1.0% Widowed0.5% DivorcedWomen who gave birth in the past 12 months Now married:
100.0% (42)Unmarried:
0.0% (0)
Women who did not give birth in the past 12 months Now married:
42.0% (490)Unmarried:
58.0% (676)
Marital status - Native Hawaiian / Pacific Islander population 15 years and over
Males 66.4% Never married33.1% Now married0.0% Separated0.0% Widowed0.5% DivorcedFemales 52.0% Never married33.4% Now married0.0% Separated12.9% Widowed1.8% DivorcedWomen who gave birth in the past 12 months Now married:
100.0% (46)Unmarried:
0.0% (0)
Women who did not give birth in the past 12 months Now married:
28.2% (193)Unmarried:
71.8% (491)
Marital status - Other race population 15 years and over
Males 45.0% Never married46.1% Now married2.8% Separated0.8% Widowed5.3% DivorcedFemales 43.5% Never married43.8% Now married4.0% Separated1.9% Widowed6.8% DivorcedWomen who gave birth in the past 12 months Now married:
56.2% (82)Unmarried:
43.8% (64)
Women who did not give birth in the past 12 months Now married:
39.8% (838)Unmarried:
60.2% (1,271)
Marital status - Two or more races population 15 years and over
Males 37.2% Never married51.4% Now married2.8% Separated0.0% Widowed8.5% DivorcedFemales 40.1% Never married45.0% Now married1.8% Separated4.3% Widowed8.8% DivorcedWomen who gave birth in the past 12 months Now married:
100.0% (374)Unmarried:
0.0% (0)
Women who did not give birth in the past 12 months Now married:
40.9% (1,530)Unmarried:
59.1% (2,210)
Marital status - White alone, not Hispanic / Latino population 15 years and over
Males 51.3% Never married45.3% Now married0.2% Separated0.6% Widowed2.6% DivorcedFemales 50.5% Never married41.8% Now married0.3% Separated3.4% Widowed4.0% DivorcedWomen who gave birth in the past 12 months Now married:
92.0% (1,374)Unmarried:
8.0% (119)
Women who did not give birth in the past 12 months Now married:
34.7% (10,425)Unmarried:
65.3% (19,623)
Marital status - Hispanic or Latino population 15 years and over
Males 39.3% Never married51.1% Now married2.0% Separated1.0% Widowed6.8% DivorcedFemales 43.7% Never married47.7% Now married1.5% Separated2.1% Widowed5.0% DivorcedWomen who gave birth in the past 12 months Now married:
93.1% (326)Unmarried:
6.9% (24)
Women who did not give birth in the past 12 months Now married:
44.2% (2,417)Unmarried:
55.8% (3,052)
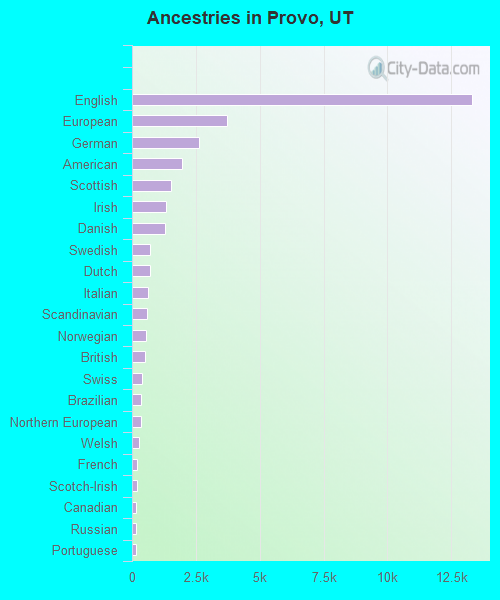
Ancestries in Provo
13,315 25.2% English3,710 7.0% European2,618 5.0% German1,942 3.7% American1,517 2.9% Scottish1,330 2.5% Irish1,289 2.4% Danish713 1.3% Swedish694 1.3% Dutch612 1.2% Italian601 1.1% Scandinavian537 1.0% Norwegian516 1.0% British408 0.8% Swiss347 0.7% Brazilian335 0.6% Northern European274 0.5% Welsh190 0.4% French184 0.3% Scotch-Irish166 0.3% Canadian158 0.3% Russian150 0.3% Portuguese112 0.2% Polish108 0.2% African88 0.2% Ukrainian87 0.2% Iranian68 0.1% Palestinian51 0.10% Eastern European48 0.09% French Canadian43 0.08% Kenyan40 0.08% Jamaican35 0.07% Haitian33 0.06% Greek33 0.06% Czech32 0.06% Basque26 0.05% Ghanaian22 0.04% Nigerian21 0.04% Australian20 0.04% Israeli18 0.03% Ethiopian16 0.03% Austrian16 0.03% Trinidadian and Tobagonian14 0.03% Hungarian14 0.03% Albanian14 0.03% Slovak13 0.02% Lebanese12 0.02% Finnish11 0.02% Serbian11 0.02% Egyptian6 0.01% Czechoslovakian5 0.01% Romanian4 0.01% Armenian
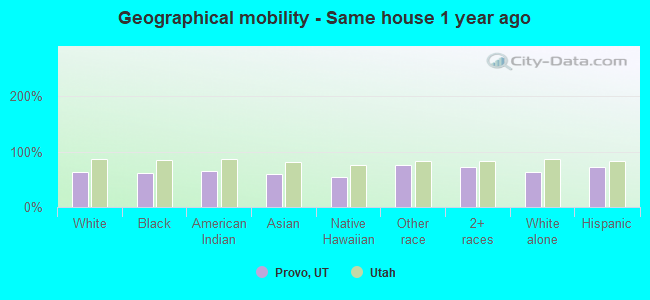
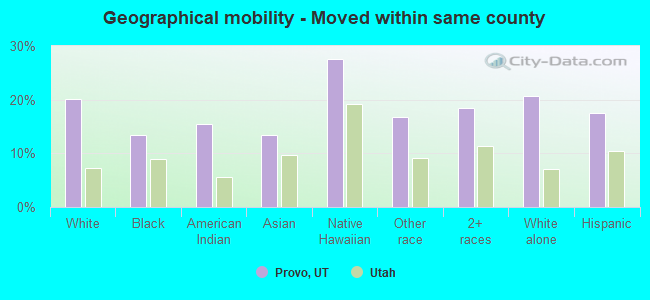
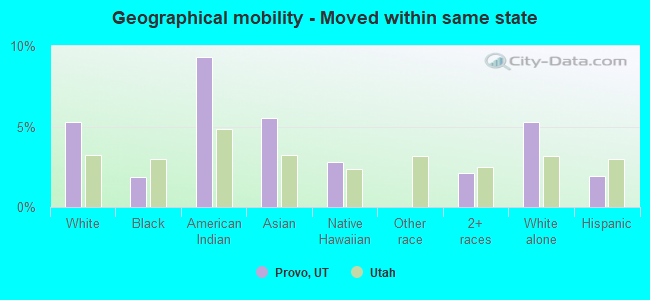
Geographical mobility in Provo Same house 1 year ago 57,513 63.6% White (Caucasian)629 61.3% Black or African American867 64.6% American Indian / Alaska Native1,084 59.6% Asian1,023 54.7% Native Hawaiian / Pacific Islander2,965 75.7% Other race8,799 71.4% Two or more races54,554 63.3% White alone, not Hispanic / Latino11,011 72.7% Hispanic or LatinoMoved within same county 18,255 20.2% White / Caucasian138 13.4% Black or African American208 15.5% American Indian / Alaska Native244 13.4% Asian514 27.5% Native Hawaiian / Pacific Islander658 16.8% Other race2,282 18.5% Two or more races17,775 20.6% White alone, not Hispanic / Latino2,662 17.6% Hispanic or LatinoMoved within same state 4,772 5.3% White / Caucasian19 1.9% Black or African American125 9.3% American Indian / Alaska Native100 5.5% Asian52 2.8% Native Hawaiian / Pacific Islander258 2.1% Two or more races4,572 5.3% White alone, not Hispanic / Latino288 1.9% Hispanic or LatinoMoved from different state 8,842 9.8% White / Caucasian114 11.1% Black or African American99 7.4% American Indian / Alaska Native301 16.6% Asian362 19.4% Native Hawaiian / Pacific Islander4 0.1% Other race442 3.6% Two or more races8,515 9.9% White alone, not Hispanic / Latino390 2.6% Hispanic or LatinoMoved from abroad 1,090 1.2% White41 4.0% Black or African American23 1.7% American Indian / Alaska Native89 4.9% Asian49 2.6% Native Hawaiian / Pacific Islander291 7.4% Other race541 4.4% Two or more races813 0.9% White alone, not Hispanic / Latino790 5.2% Hispanic or Latino
Children Nativity (place of birth) in Provo
Children under 6 years - Living with two parents Both parents native 5,097 100.0% NativeBoth parents foreign-born 668 86.6% Native103 13.4% Foreign-bornOne native, one foreign-born parent 753 100.0% NativeChildren under 6 years - Living with one parent Native parent 563 100.0% NativeForeign-born parent 158 100.0% NativeChildren 6 to 17 years - Living with two parents Both parents native 9,041 99.1% Native86 0.9% Foreign-bornBoth parents foreign-born 638 58.9% Native446 41.1% Foreign-bornOne native, one foreign-born parent 467 91.6% Native43 8.4% Foreign-bornChildren 6 to 17 years - Living with one parent Native parent 2,222 100.0% NativeForeign-born parent 622 50.0% Native622 50.0% Foreign-born
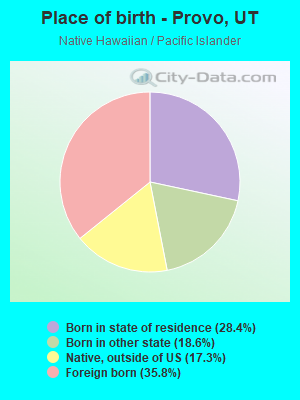
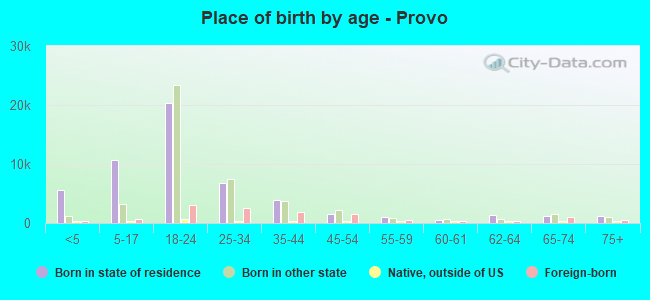
Place of birth for residents in Provo
Grandparents responsible for own grandchildren in Provo
Grandparents (30 to 59 years) White / Caucasian 54 13.4% Responsible for grandchildren350 86.6% Not responsible for grandchildrenBlack or African American 3 100.0% Not responsible for grandchildrenAmerican Indian / Alaska Native 4 50.6% Responsible for grandchildren4 49.4% Not responsible for grandchildrenAsian 4 100.0% Not responsible for grandchildrenNative Hawaiian / Pacific Islander 13 100.0% Not responsible for grandchildrenOther race 33 100.0% Not responsible for grandchildrenTwo or more races 9 32.2% Responsible for grandchildren19 67.8% Not responsible for grandchildrenWhite alone, not Hispanic / Latino 24 8.9% Responsible for grandchildren248 91.1% Not responsible for grandchildrenHispanic or Latino 30 16.6% Responsible for grandchildren151 83.4% Not responsible for grandchildrenGrandparents (60 years and over) White / Caucasian 166 31.8% Responsible for grandchildren357 68.2% Not responsible for grandchildrenAmerican Indian / Alaska Native 38 100.0% Not responsible for grandchildrenAsian 15 100.0% Not responsible for grandchildrenNative Hawaiian / Pacific Islander 14 100.0% Not responsible for grandchildrenOther race 72 100.0% Not responsible for grandchildrenTwo or more races 55 100.0% Not responsible for grandchildrenWhite alone, not Hispanic / Latino 161 33.8% Responsible for grandchildren315 66.2% Not responsible for grandchildrenHispanic or Latino 10 6.0% Responsible for grandchildren164 94.0% Not responsible for grandchildren