Races in Purdue University, Indiana (IN) Detailed Stats
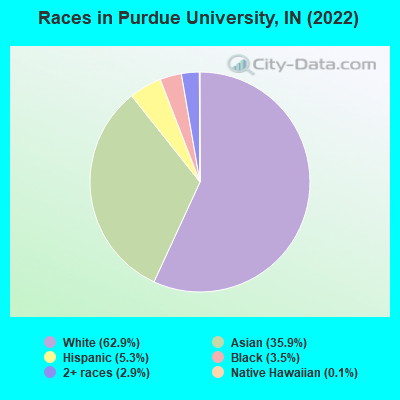
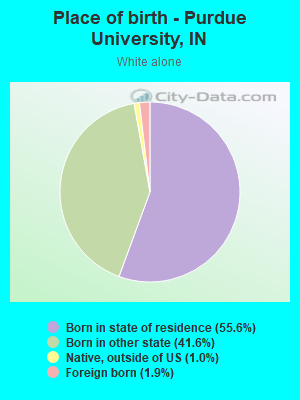
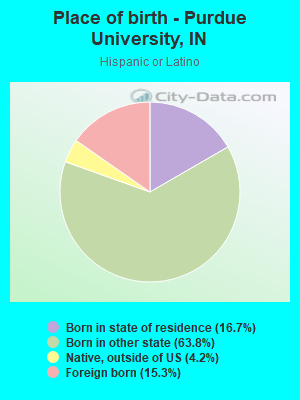
According to 2022 data, the most numerous races in Purdue University, IN are White alone (7,253 residents), Black alone (401 residents), and Hispanic (606 residents). 71.6% of Purdue University residents speak English at home.
Race distribution in Purdue University 7,253 62.9% White alone 4,136 35.9% Asian alone 606 5.3% Hispanic 401 3.5% Black alone 334 2.9% Two or more races 13 0.1% Native Hawaiian and Other 3 0.03% American Indian alone
2000 2022
5,219,373 85.8% White alone 505,462 8.3% Black alone 214,536 3.5% Hispanic 61,115 1.0% Two or more races 58,424 1.0% Asian alone 13,654 0.2% American Indian alone 6,348 0.1% Other race alone 1,573 0.03% Native Hawaiian and Other
5,192,455 76.0% White alone 628,054 9.2% Black alone 534,528 7.8% Hispanic 263,242 3.9% Two or more races 172,880 2.5% Asian alone 33,467 0.5% Other race alone 5,866 0.09% American Indian alone 2,545 0.04% Native Hawaiian and Other
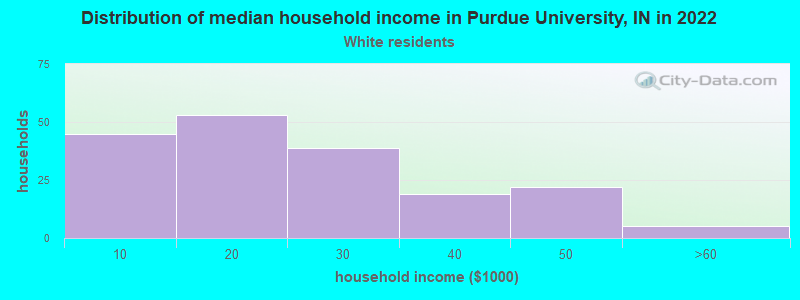
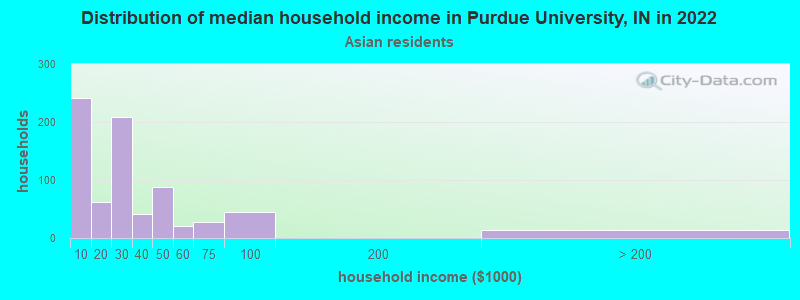
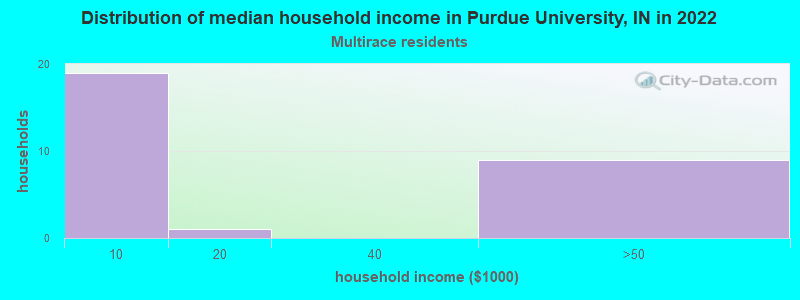
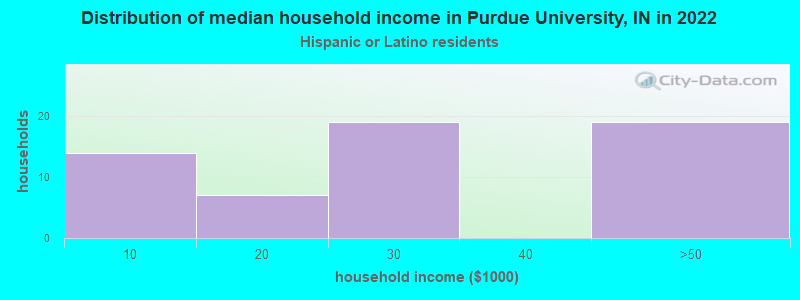
Income and house value in Purdue University Median household income in 2022 $24,998 White non-Hispanic householders$14,905 Black householders$29,037 Asian householders$50,045 Some other race householders$6,223 Two or more races householders$41,704 Hispanic or Latino race householders
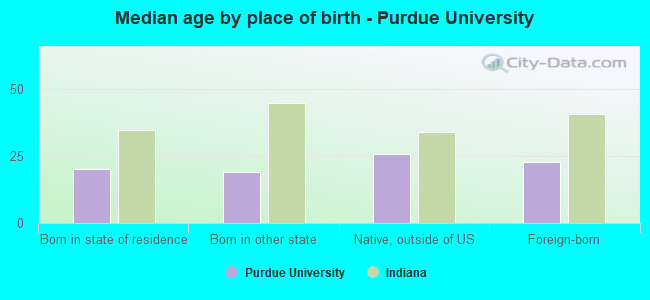
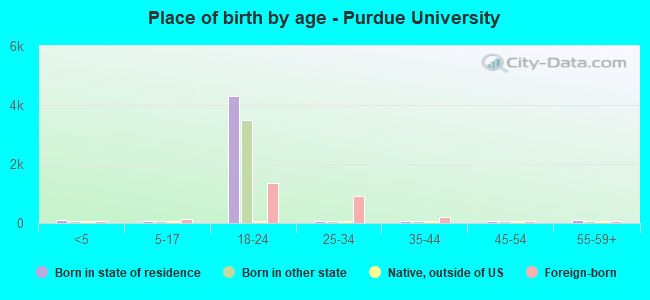
Median age by race in Purdue University
20.5 Median age for White residents20.2 20.2 18.4 Median age for Black or African American residents21.1 17.8 60.5 Median age for American Indian / Alaska Native residents21.2 Median age for Asian residents20.8 21.9 18.1 Median age for Other race residents17.3 22.4 27.2 Median age for Two or more races residents26.0 27.1 20.6 Median age for White alone residents20.3 19.9 20.2 Median age for Hispanic or Latino residents19.6 21.4
Owner/renter occupied households by race in Purdue University
House owners and renters - White residents 10 3.8% Owner occupied255 96.2% Renter occupiedHouse owners and renters - Black or African American residents 36 100.0% Renter occupiedHouse owners and renters - American Indian / Alaska Native residents 2 50.8% Owner occupied1 49.2% Renter occupiedHouse owners and renters - Asian residents 856 100.0% Renter occupiedHouse owners and renters - Other race residents 11 100.0% Renter occupiedHouse owners and renters - Two or more races residents 56 100.0% Renter occupiedHouse owners and renters - White alone residents 212 100.0% Renter occupiedHouse owners and renters - Hispanic or Latino residents 16 22.0% Owner occupied56 78.0% Renter occupied
Language usage in Purdue University
English speakers - Total 71.6% of residents of Purdue University speak English at home.
2.6% of residents speak Spanish at home 217 72.1% Speak English very well84 27.9% Speak English less than very well28.9% of residents speak other language at home 1,474 44.7% Speak English very well1,826 55.3% Speak English less than very well
English speakers - Born in the United States 90.7% of residents of Purdue University speak English at home.
2.3% of residents speak Spanish at home 77 82.8% Speak English very well16 17.2% Speak English less than very well6.2% of residents speak other language at home 157 63.1% Speak English very well92 36.9% Speak English less than very well
English speakers - Native, born elsewhere 67.6% of residents of Purdue University speak English at home.
9.8% of residents speak Spanish at home 10 100.0% Speak English very well12.7% of residents speak other language at home 13 100.0% Speak English very well
English speakers - Foreign-born 8.4% of residents of Purdue University speak English at home.
3.5% of residents speak Spanish at home 59 51.8% Speak English very well55 48.2% Speak English less than very well96.8% of residents speak other language at home 1,370 43.3% Speak English very well1,792 56.7% Speak English less than very well
White (Caucasian) - Speak only English Native:
98.0% (7,327)Foreign-born:
8.0% (15)
White (Caucasian) - Speak another language Native:
2.2% (166)Foreign-born:
86.9% (158)
Black or African American - Speak only English Native:
97.0% (234)Foreign-born:
69.7% (162)
Black or African American - Speak another language Native:
2.8% (7)Foreign-born:
38.9% (91)
Asian - Speak only English Native:
19.7% (104)Foreign-born:
5.5% (183)
Asian - Speak another language Native:
83.1% (441)Foreign-born:
88.6% (2,965)
Other race - Speak another language Native:
24.2% (28)Foreign-born:
95.6% (9)
Two or more races - Speak another language Native:
12.3% (65)Foreign-born:
100.0% (237)
White alone - Speak only English Native:
98.9% (7,108)Foreign-born:
8.6% (12)
White alone - Speak another language Native:
1.1% (81)Foreign-born:
100.0% (140)
Hispanic or Latino - Speak another language Native:
24.5% (143)Foreign-born:
95.5% (104)
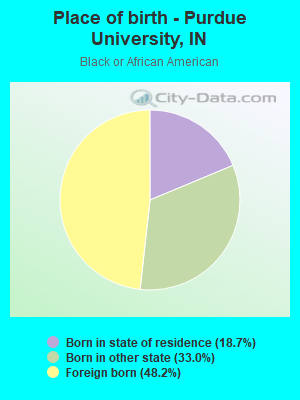
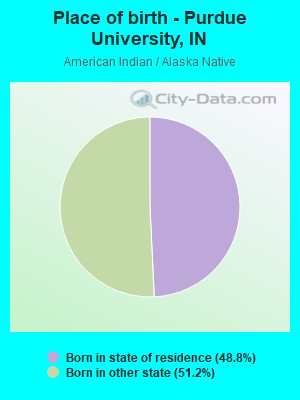
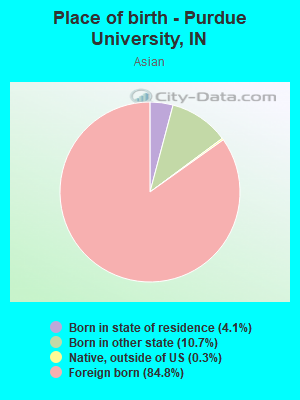
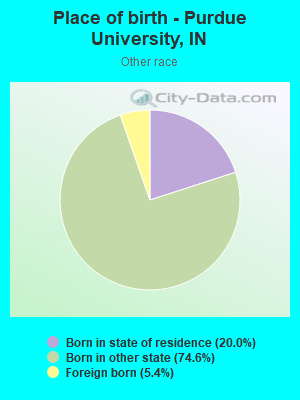
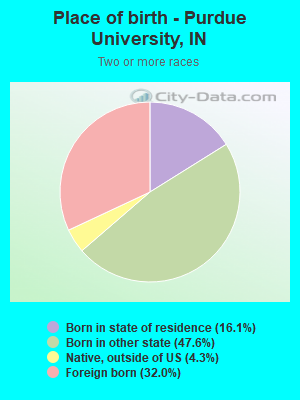
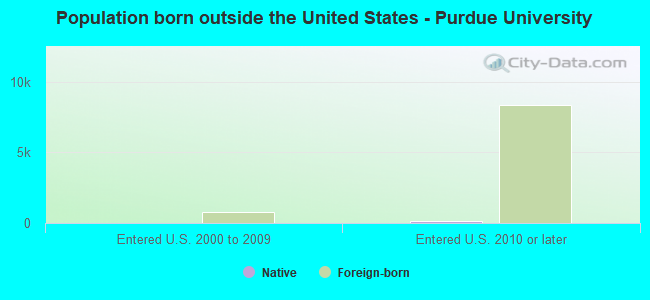
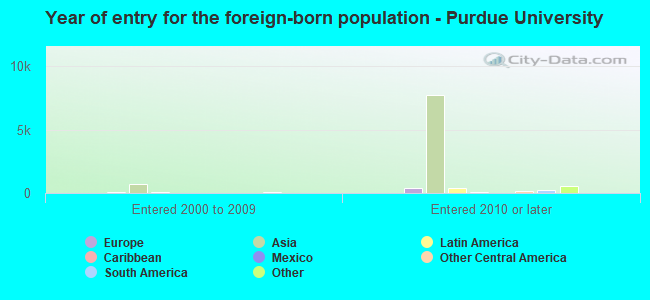
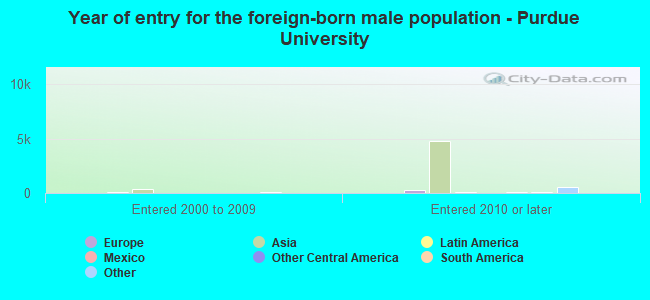
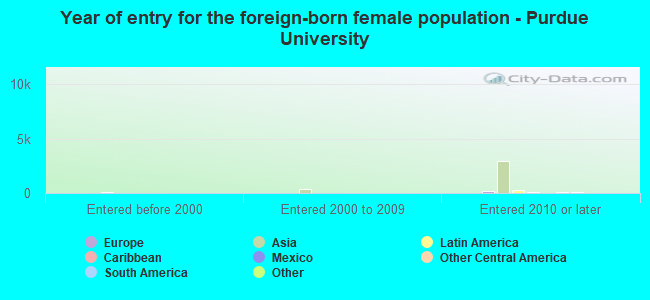
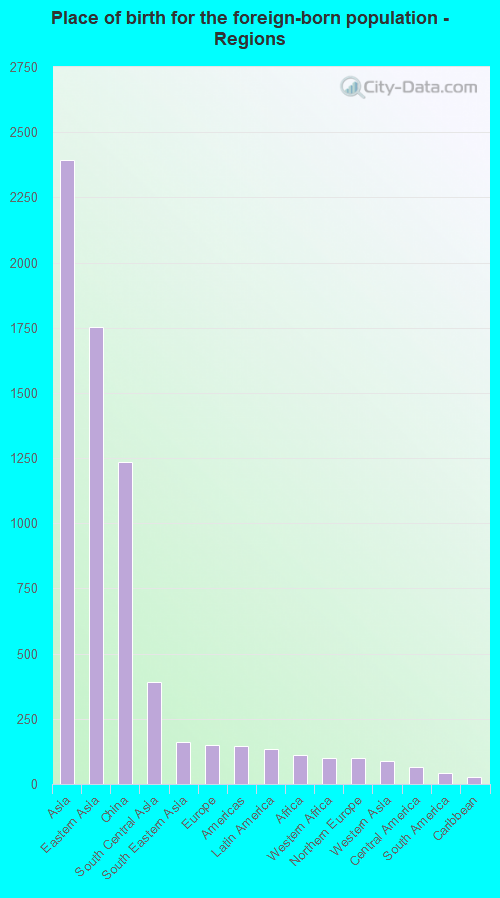
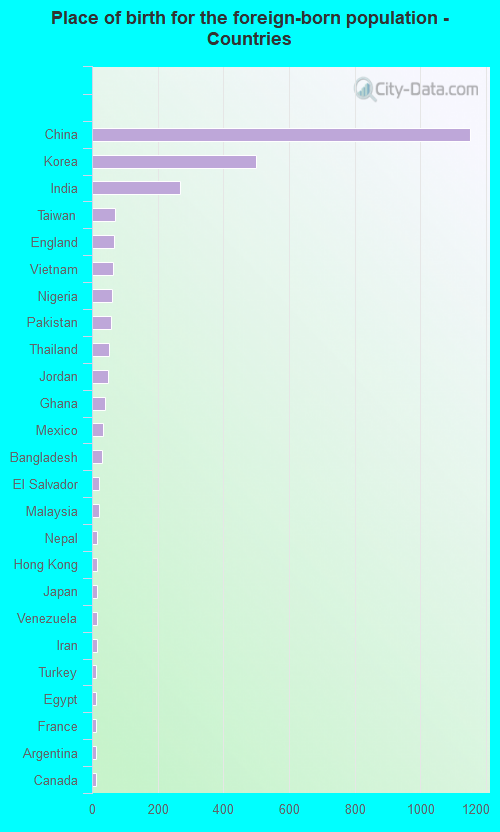
Foreign-born residents in Purdue University
Marital status for residents in Purdue University Marital status - White (Caucasian) population 15 years and over
Males 96.5% Never married2.8% Now married0.2% Separated0.0% Widowed0.5% DivorcedFemales 96.1% Never married3.9% Now married0.0% Separated0.0% Widowed0.0% DivorcedWomen who gave birth in the past 12 months Now married:
100.0% (11)Unmarried:
0.0% (0)
Women who did not give birth in the past 12 months Now married:
2.9% (90)Unmarried:
97.1% (2,968)
Marital status - Black or African American population 15 years and over
Males 77.2% Never married17.4% Now married0.0% Separated0.0% Widowed5.4% DivorcedFemales 100.0% Never married0.0% Now married0.0% Separated0.0% Widowed0.0% DivorcedWomen who did not give birth in the past 12 months Now married:
0.0% (0)Unmarried:
100.0% (150)
Marital status - Asian population 15 years and over
Males 70.8% Never married29.2% Now married0.0% Separated0.0% Widowed0.0% DivorcedFemales 60.0% Never married36.2% Now married1.5% Separated0.4% Widowed2.0% DivorcedWomen who gave birth in the past 12 months Now married:
100.0% (62)Unmarried:
0.0% (0)
Women who did not give birth in the past 12 months Now married:
32.5% (446)Unmarried:
67.5% (924)
Marital status - Other race population 15 years and over
Males 87.5% Never married12.5% Now married0.0% Separated0.0% Widowed0.0% DivorcedFemales 76.2% Never married23.8% Now married0.0% Separated0.0% Widowed0.0% DivorcedWomen who did not give birth in the past 12 months Now married:
23.8% (12)Unmarried:
76.2% (40)
Marital status - Two or more races population 15 years and over
Males 97.3% Never married2.2% Now married0.0% Separated0.0% Widowed0.5% DivorcedFemales 95.6% Never married0.0% Now married4.4% Separated0.0% Widowed0.0% DivorcedWomen who did not give birth in the past 12 months Now married:
4.4% (11)Unmarried:
95.6% (242)
Marital status - White alone, not Hispanic / Latino population 15 years and over
Males 97.2% Never married2.1% Now married0.2% Separated0.0% Widowed0.5% DivorcedFemales 97.1% Never married2.9% Now married0.0% Separated0.0% Widowed0.0% DivorcedWomen who gave birth in the past 12 months Now married:
100.0% (11)Unmarried:
0.0% (0)
Women who did not give birth in the past 12 months Now married:
1.9% (55)Unmarried:
98.1% (2,849)
Marital status - Hispanic or Latino population 15 years and over
Males 85.9% Never married14.1% Now married0.0% Separated0.0% Widowed0.0% DivorcedFemales 76.5% Never married23.5% Now married0.0% Separated0.0% Widowed0.0% DivorcedWomen who did not give birth in the past 12 months Now married:
23.5% (68)Unmarried:
76.5% (221)
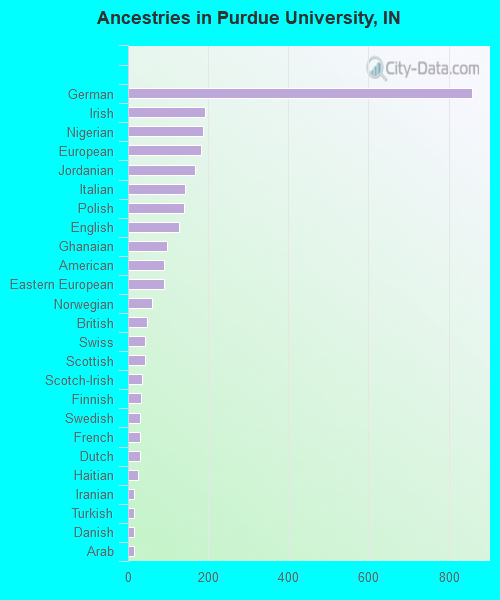
Ancestries in Purdue University
858 15.9% German191 3.5% Irish187 3.5% Nigerian181 3.4% European166 3.1% Jordanian142 2.6% Italian140 2.6% Polish127 2.4% English97 1.8% Ghanaian91 1.7% American89 1.7% Eastern European60 1.1% Norwegian47 0.9% British43 0.8% Swiss42 0.8% Scottish35 0.6% Scotch-Irish33 0.6% Finnish30 0.6% Swedish30 0.6% French29 0.5% Dutch25 0.5% Haitian16 0.3% Iranian16 0.3% Turkish15 0.3% Danish14 0.3% Arab13 0.2% Lebanese11 0.2% Egyptian11 0.2% Hungarian11 0.2% Scandinavian10 0.2% Russian9 0.2% Northern European7 0.1% Czechoslovakian7 0.1% Serbian7 0.1% African6 0.1% Welsh5 0.09% Lithuanian4 0.07% Macedonian4 0.07% French Canadian4 0.07% Slovene3 0.06% Greek3 0.06% Austrian3 0.06% Slovak2 0.04% Belgian
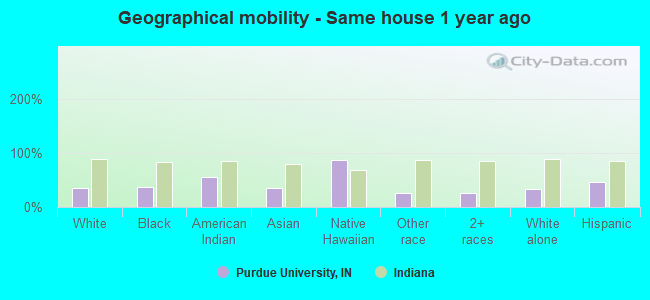
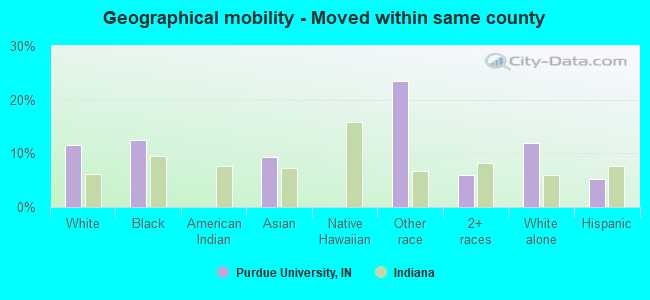
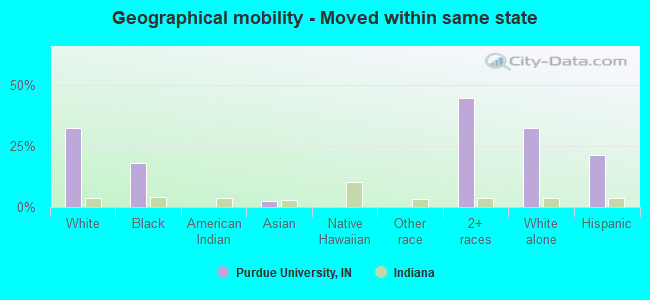
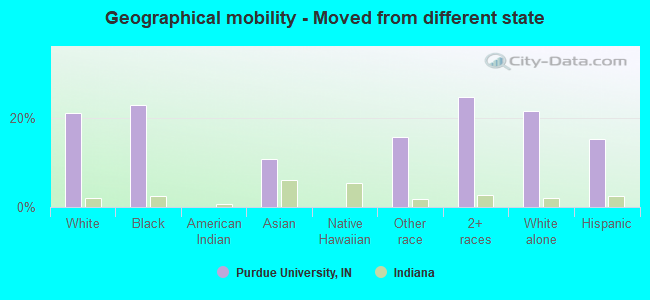
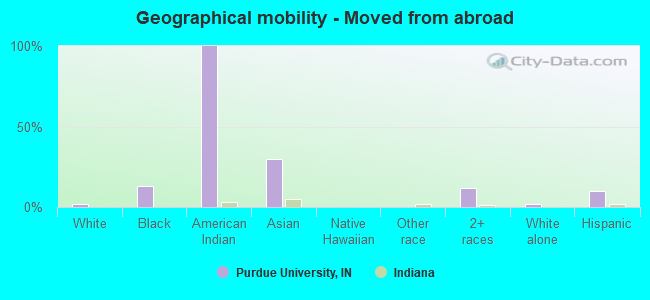
Geographical mobility in Purdue University Same house 1 year ago 2,595 34.4% White (Caucasian)147 36.7% Black or African American5 55.4% American Indian / Alaska Native1,423 34.6% Asian8 86.3% Native Hawaiian / Pacific Islander32 25.3% Other race167 25.0% Two or more races2,444 33.7% White alone, not Hispanic / Latino288 46.3% Hispanic or LatinoMoved within same county 869 11.5% White / Caucasian50 12.4% Black or African American379 9.2% Asian29 23.5% Other race40 6.0% Two or more races859 11.9% White alone, not Hispanic / Latino33 5.3% Hispanic or LatinoMoved within same state 2,434 32.3% White / Caucasian73 18.2% Black or African American96 2.3% Asian297 44.5% Two or more races2,336 32.2% White alone, not Hispanic / Latino132 21.2% Hispanic or LatinoMoved from different state 1,579 21.0% White / Caucasian91 22.7% Black or African American445 10.8% Asian20 15.7% Other race164 24.6% Two or more races1,553 21.4% White alone, not Hispanic / Latino94 15.2% Hispanic or LatinoMoved from abroad 172 2.3% White52 12.8% Black or African American11 100.0% American Indian / Alaska Native1,212 29.5% Asian83 12.4% Two or more races142 2.0% White alone, not Hispanic / Latino60 9.7% Hispanic or Latino
Children Nativity (place of birth) in Purdue University
Children under 6 years - Living with two parents Both parents native 15 100.0% NativeBoth parents foreign-born 108 60.4% Native71 39.6% Foreign-bornChildren under 6 years - Living with one parent Native parent 8 100.0% NativeChildren 6 to 17 years - Living with two parents Both parents native 2 100.0% NativeBoth parents foreign-born 11 14.7% Native66 85.3% Foreign-bornChildren 6 to 17 years - Living with one parent Native parent 17 100.0% Foreign-bornForeign-born parent 25 100.0% Native
Grandparents responsible for own grandchildren in Purdue University
Grandparents (30 to 59 years) Asian 31 100.0% Not responsible for grandchildren
Grandparents (60 years and over)