Races in Quincy, Washington (WA) Detailed Stats
Data:
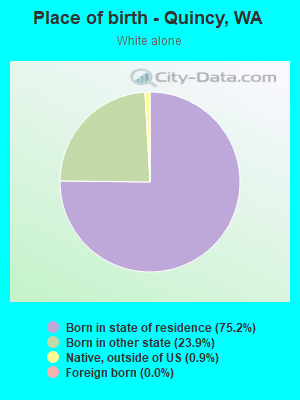
Races - White alone (%)
Races - White alone (% change since 2000)
Races - Black alone (%)
Races - Black alone (% change since 2000)
Races - American Indian alone (%)
Races - American Indian alone (% change since 2000)
Races - Asian alone (%)
Races - Asian alone (% change since 2000)
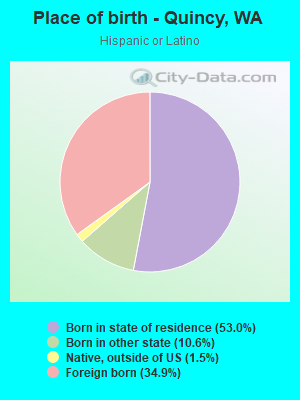
Races - Hispanic (%)
Races - Hispanic (% change since 2000)
Races - Native Hawaiian and Other Pacific Islander alone (%)
Races - Native Hawaiian and Other Pacific Islander alone (% change since 2000)
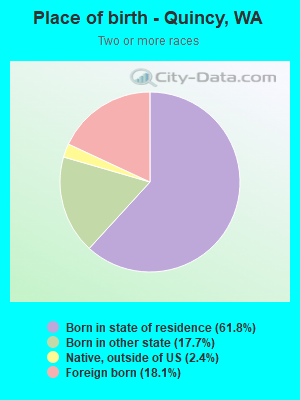
Races - Two or more races(%)
Races - Two or more races(% change since 2000)
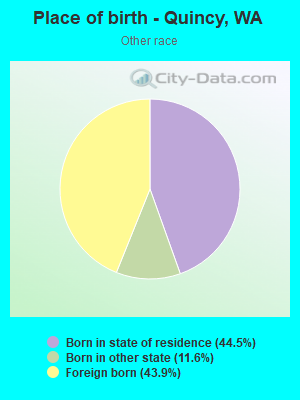
Races - Other race alone (%)
Races - Other race alone (% change since 2000)
Racial diversity
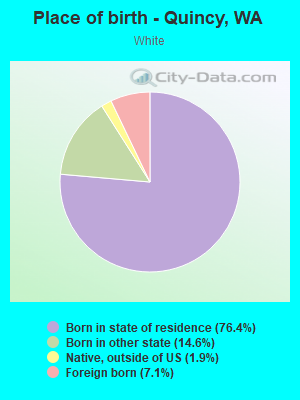
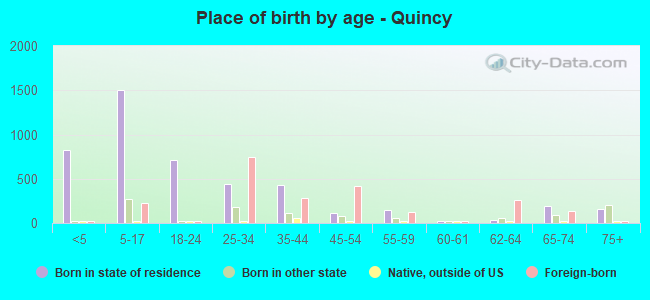
Place of birth - Born in state of residence (%)
Place of birth - Born in state of residence (%) - White
Place of birth - Born in state of residence (%) - Black or African American
Place of birth - Born in state of residence (%) - Asian
Place of birth - Born in state of residence (%) - Hispanic or Latino
Place of birth - Born in state of residence (%) - American Indian and Alaska Native
Place of birth - Born in state of residence (%) - Multirace
Place of birth - Born in state of residence (%) - Other Race
Place of birth - Born in other state (%)
Place of birth - Born in other state (%) - White
Place of birth - Born in other state (%) - Black or African American
Place of birth - Born in other state (%) - Asian
Place of birth - Born in other state (%) - Hispanic or Latino
Place of birth - Born in other state (%) - American Indian and Alaska Native
Place of birth - Born in other state (%) - Multirace
Place of birth - Born in other state (%) - Other Race
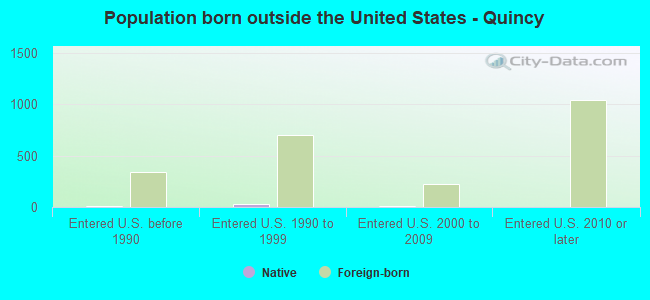
Place of birth - Native, outside of US (%)
Place of birth - Native, outside of US (%) - White
Place of birth - Native, outside of US (%) - Black or African American
Place of birth - Native, outside of US (%) - Asian
Place of birth - Native, outside of US (%) - Hispanic or Latino
Place of birth - Native, outside of US (%) - American Indian and Alaska Native
Place of birth - Native, outside of US (%) - Multirace
Place of birth - Native, outside of US (%) - Other Race
Place of birth - Foreign born (%)
Place of birth - Foreign born (%) - White
Place of birth - Foreign born (%) - Black or African American
Place of birth - Foreign born (%) - Asian
Place of birth - Foreign born (%) - Hispanic or Latino
Place of birth - Foreign born (%) - American Indian and Alaska Native
Place of birth - Foreign born (%) - Multirace
Place of birth - Foreign born (%) - Other Race
Residents speaking English at home (%)
Residents speaking English at home - Born in the United States (%)
Residents speaking English at home - Native, born elsewhere (%)
Residents speaking English at home - Foreign born (%)
Residents speaking Spanish at home (%)
Residents speaking Spanish at home - Born in the United States (%)
Residents speaking Spanish at home - Native, born elsewhere (%)
Residents speaking Spanish at home - Foreign born (%)
Residents speaking other language at home (%)
Residents speaking other language at home - Born in the United States (%)
Residents speaking other language at home - Native, born elsewhere (%)
Residents speaking other language at home - Foreign born (%)
Marital status - Never married (%)
Marital status - Now married (%)
Marital status - Separated (%)
Marital status - Widowed (%)
Marital status - Divorced (%)
Ancestries Reported - Arab (%)
Ancestries Reported - Czech (%)
Ancestries Reported - Danish (%)
Ancestries Reported - Dutch (%)
Ancestries Reported - English (%)
Ancestries Reported - French (%)
Ancestries Reported - French Canadian (%)
Ancestries Reported - German (%)
Ancestries Reported - Greek (%)
Ancestries Reported - Hungarian (%)
Ancestries Reported - Irish (%)
Ancestries Reported - Italian (%)
Ancestries Reported - Lithuanian (%)
Ancestries Reported - Norwegian (%)
Ancestries Reported - Polish (%)
Ancestries Reported - Portuguese (%)
Ancestries Reported - Russian (%)
Ancestries Reported - Scotch-Irish (%)
Ancestries Reported - Scottish (%)
Ancestries Reported - Slovak (%)
Ancestries Reported - Subsaharan African (%)
Ancestries Reported - Swedish (%)
Ancestries Reported - Swiss (%)
Ancestries Reported - Ukrainian (%)
Ancestries Reported - United States (%)
Ancestries Reported - Welsh (%)
Ancestries Reported - West Indian (%)
Ancestries Reported - Other (%)
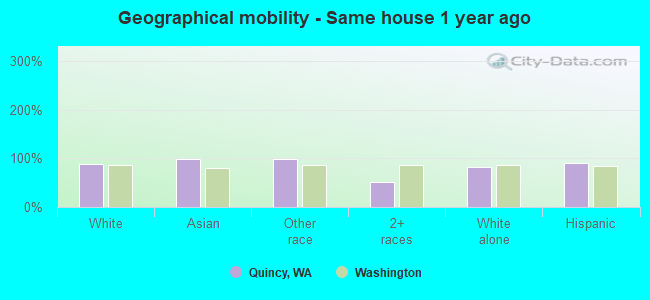
Geographical mobility - Same house 1 year ago (%)
Geographical mobility - Same house 1 year ago (%) - White
Geographical mobility - Same house 1 year ago (%) - Black or African American
Geographical mobility - Same house 1 year ago (%) - Asian
Geographical mobility - Same house 1 year ago (%) - Hispanic or Latino
Geographical mobility - Same house 1 year ago (%) - American Indian and Alaska Native
Geographical mobility - Same house 1 year ago (%) - Multirace
Geographical mobility - Same house 1 year ago (%) - Other Race
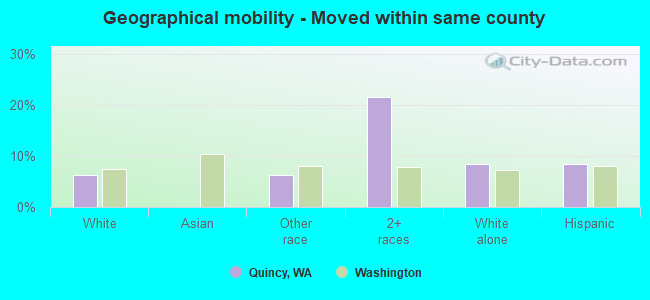
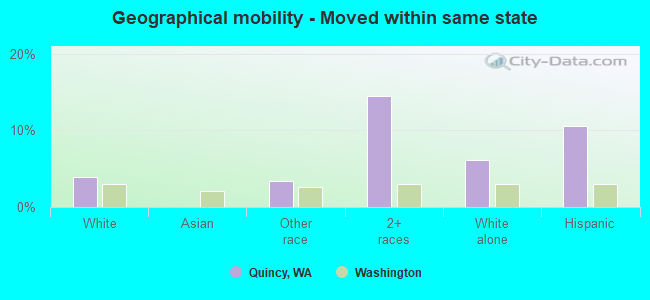
Geographical mobility - Moved within same county (%)
Geographical mobility - Moved within same county (%) - White
Geographical mobility - Moved within same county (%) - Black or African American
Geographical mobility - Moved within same county (%) - Asian
Geographical mobility - Moved within same county (%) - Hispanic or Latino
Geographical mobility - Moved within same county (%) - American Indian and Alaska Native
Geographical mobility - Moved within same county (%) - Multirace
Geographical mobility - Moved within same county (%) - Other Race
Geographical mobility - Moved from different county within same state (%)
Geographical mobility - Moved from different county within same state (%) - White
Geographical mobility - Moved from different county within same state (%) - Black or African American
Geographical mobility - Moved from different county within same state (%) - Asian
Geographical mobility - Moved from different county within same state (%) - Hispanic or Latino
Geographical mobility - Moved from different county within same state (%) - American Indian and Alaska Native
Geographical mobility - Moved from different county within same state (%) - Multirace
Geographical mobility - Moved from different county within same state (%) - Other Race
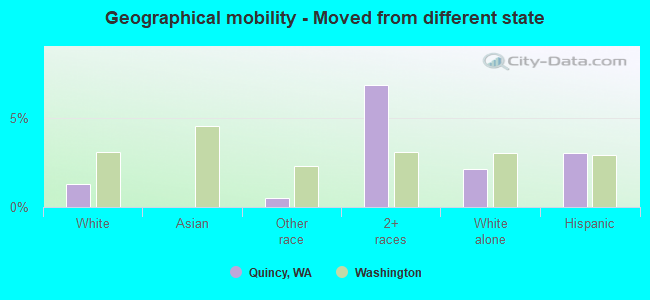
Geographical mobility - Moved from different state (%)
Geographical mobility - Moved from different state (%) - White
Geographical mobility - Moved from different state (%) - Black or African American
Geographical mobility - Moved from different state (%) - Asian
Geographical mobility - Moved from different state (%) - Hispanic or Latino
Geographical mobility - Moved from different state (%) - American Indian and Alaska Native
Geographical mobility - Moved from different state (%) - Multirace
Geographical mobility - Moved from different state (%) - Other Race
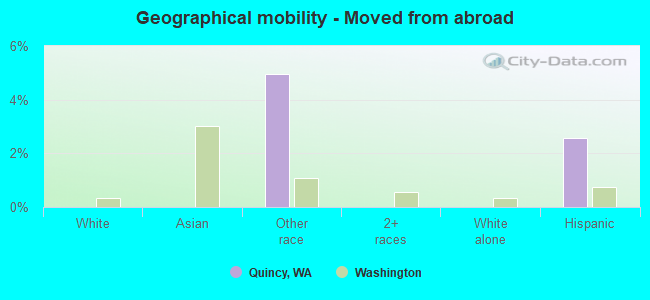
Geographical mobility - Moved from abroad (%)
Geographical mobility - Moved from abroad (%) - White
Geographical mobility - Moved from abroad (%) - Black or African American
Geographical mobility - Moved from abroad (%) - Asian
Geographical mobility - Moved from abroad (%) - Hispanic or Latino
Geographical mobility - Moved from abroad (%) - American Indian and Alaska Native
Geographical mobility - Moved from abroad (%) - Multirace
Geographical mobility - Moved from abroad (%) - Other Race
Place of birth for the foreign-born population - Ireland (%)
Place of birth for the foreign-born population - Denmark (%)
Place of birth for the foreign-born population - Norway (%)
Place of birth for the foreign-born population - Sweden (%)
Place of birth for the foreign-born population - United Kingdom (%)
Place of birth for the foreign-born population - England (%)
Place of birth for the foreign-born population - Scotland (%)
Place of birth for the foreign-born population - Other Northern Europe (%)
Place of birth for the foreign-born population - Austria (%)
Place of birth for the foreign-born population - Belgium (%)
Place of birth for the foreign-born population - France (%)
Place of birth for the foreign-born population - Germany (%)
Place of birth for the foreign-born population - Netherlands (%)
Place of birth for the foreign-born population - Switzerland (%)
Place of birth for the foreign-born population - Other Western Europe (%)
Place of birth for the foreign-born population - Greece (%)
Place of birth for the foreign-born population - Italy (%)
Place of birth for the foreign-born population - Portugal (%)
Place of birth for the foreign-born population - Spain (%)
Place of birth for the foreign-born population - Other Southern Europe (%)
Place of birth for the foreign-born population - Albania (%)
Place of birth for the foreign-born population - Belarus (%)
Place of birth for the foreign-born population - Bosnia and Herzegovina (%)
Place of birth for the foreign-born population - Bulgaria (%)
Place of birth for the foreign-born population - Croatia (%)
Place of birth for the foreign-born population - Czechoslovakia (%)
Place of birth for the foreign-born population - Hungary (%)
Place of birth for the foreign-born population - Latvia (%)
Place of birth for the foreign-born population - Lithuania (%)
Place of birth for the foreign-born population - North Macedonia (Macedonia) (%)
Place of birth for the foreign-born population - Moldova (%)
Place of birth for the foreign-born population - Poland (%)
Place of birth for the foreign-born population - Romania (%)
Place of birth for the foreign-born population - Russia (%)
Place of birth for the foreign-born population - Serbia (%)
Place of birth for the foreign-born population - Ukraine (%)
Place of birth for the foreign-born population - Other Eastern Europe (%)
Place of birth for the foreign-born population - China (%)
Place of birth for the foreign-born population - Hong Kong (%)
Place of birth for the foreign-born population - Taiwan (%)
Place of birth for the foreign-born population - Japan (%)
Place of birth for the foreign-born population - Korea (%)
Place of birth for the foreign-born population - Other Eastern Asia (%)
Place of birth for the foreign-born population - Afghanistan (%)
Place of birth for the foreign-born population - Bangladesh (%)
Place of birth for the foreign-born population - India (%)
Place of birth for the foreign-born population - Iran (%)
Place of birth for the foreign-born population - Kazakhstan (%)
Place of birth for the foreign-born population - Nepal (%)
Place of birth for the foreign-born population - Pakistan (%)
Place of birth for the foreign-born population - Sri Lanka (%)
Place of birth for the foreign-born population - Uzbekistan (%)
Place of birth for the foreign-born population - Other South Central Asia (%)
Place of birth for the foreign-born population - Burma (%)
Place of birth for the foreign-born population - Cambodia (%)
Place of birth for the foreign-born population - Indonesia (%)
Place of birth for the foreign-born population - Laos (%)
Place of birth for the foreign-born population - Malaysia (%)
Place of birth for the foreign-born population - Philippines (%)
Place of birth for the foreign-born population - Singapore (%)
Place of birth for the foreign-born population - Thailand (%)
Place of birth for the foreign-born population - Vietnam (%)
Place of birth for the foreign-born population - Other South Eastern Asia (%)
Place of birth for the foreign-born population - Armenia (%)
Place of birth for the foreign-born population - Iraq (%)
Place of birth for the foreign-born population - Israel (%)
Place of birth for the foreign-born population - Jordan (%)
Place of birth for the foreign-born population - Kuwait (%)
Place of birth for the foreign-born population - Lebanon (%)
Place of birth for the foreign-born population - Saudi Arabia (%)
Place of birth for the foreign-born population - Syria (%)
Place of birth for the foreign-born population - Turkey (%)
Place of birth for the foreign-born population - Yemen (%)
Place of birth for the foreign-born population - Other Western Asia (%)
Place of birth for the foreign-born population - Eritrea (%)
Place of birth for the foreign-born population - Ethiopia (%)
Place of birth for the foreign-born population - Kenya (%)
Place of birth for the foreign-born population - Somalia (%)
Place of birth for the foreign-born population - Uganda (%)
Place of birth for the foreign-born population - Zimbabwe (%)
Place of birth for the foreign-born population - Other Eastern Africa (%)
Place of birth for the foreign-born population - Cameroon (%)
Place of birth for the foreign-born population - Congo (%)
Place of birth for the foreign-born population - Democratic Republic of Congo (Zaire) (%)
Place of birth for the foreign-born population - Other Middle Africa (%)
Place of birth for the foreign-born population - Egypt (%)
Place of birth for the foreign-born population - Morocco (%)
Place of birth for the foreign-born population - Sudan (%)
Place of birth for the foreign-born population - Other Northern Africa (%)
Place of birth for the foreign-born population - South Africa (%)
Place of birth for the foreign-born population - Other Southern Africa (%)
Place of birth for the foreign-born population - Cabo Verde (%)
Place of birth for the foreign-born population - Ghana (%)
Place of birth for the foreign-born population - Liberia (%)
Place of birth for the foreign-born population - Nigeria (%)
Place of birth for the foreign-born population - Senegal (%)
Place of birth for the foreign-born population - Sierra Leone (%)
Place of birth for the foreign-born population - Other Western Africa (%)
Place of birth for the foreign-born population - Australia (%)
Place of birth for the foreign-born population - New Zealand (%)
Place of birth for the foreign-born population - Fiji (%)
Place of birth for the foreign-born population - Micronesia (%)
Place of birth for the foreign-born population - Bahamas (%)
Place of birth for the foreign-born population - Barbados (%)
Place of birth for the foreign-born population - Cuba (%)
Place of birth for the foreign-born population - Dominica (%)
Place of birth for the foreign-born population - Dominican Republic (%)
Place of birth for the foreign-born population - Grenada (%)
Place of birth for the foreign-born population - Haiti (%)
Place of birth for the foreign-born population - Jamaica (%)
Place of birth for the foreign-born population - St. Vincent and the Grenadines (%)
Place of birth for the foreign-born population - Trinidad and Tobago (%)
Place of birth for the foreign-born population - West Indies (%)
Place of birth for the foreign-born population - Other Caribbean (%)
Place of birth for the foreign-born population - Belize (%)
Place of birth for the foreign-born population - Costa Rica (%)
Place of birth for the foreign-born population - El Salvador (%)
Place of birth for the foreign-born population - Guatemala (%)
Place of birth for the foreign-born population - Honduras (%)
Place of birth for the foreign-born population - Mexico (%)
Place of birth for the foreign-born population - Nicaragua (%)
Place of birth for the foreign-born population - Panama (%)
Place of birth for the foreign-born population - Other Central America (%)
Place of birth for the foreign-born population - Argentina (%)
Place of birth for the foreign-born population - Bolivia (%)
Place of birth for the foreign-born population - Brazil (%)
Place of birth for the foreign-born population - Chile (%)
Place of birth for the foreign-born population - Colombia (%)
Place of birth for the foreign-born population - Ecuador (%)
Place of birth for the foreign-born population - Guyana (%)
Place of birth for the foreign-born population - Peru (%)
Place of birth for the foreign-born population - Uruguay (%)
Place of birth for the foreign-born population - Venezuela (%)
Place of birth for the foreign-born population - Other South America (%)
Place of birth for the foreign-born population - Canada (%)
Place of birth for the foreign-born population - Other Northern America (%)
Place of birth for the foreign-born population - Other (%)
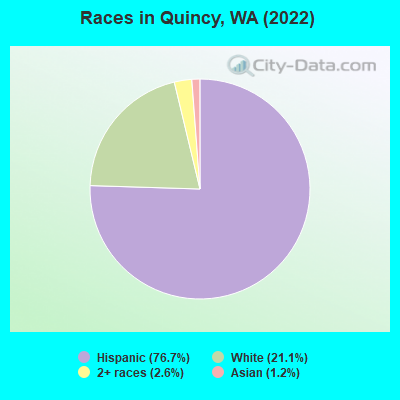
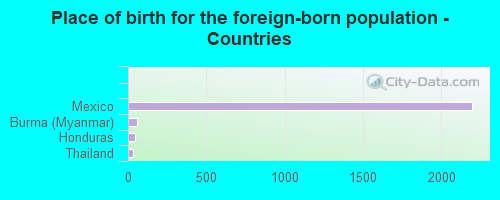
According to 2022 data, the most numerous races in Quincy, WA are White alone (1,671 residents), Hispanic (6,080 residents), and Asian alone (96 residents). 32.8% of Quincy residents speak English at home. 29.4% of Quincy, WA residents are foreign-born (27.8% born in Latin America), which is 48.9% greater than the foreign-born rate of 15.0% across the entire state of Washington.
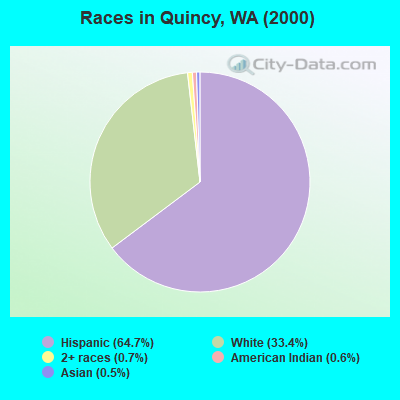
Race distribution in Quincy
2000 2022
4,652,490 78.9% White alone 441,509 7.5% Hispanic 319,401 5.4% Asian alone 184,631 3.1% Black alone 175,926 3.0% Two or more races 85,396 1.4% American Indian alone 22,779 0.4% Native Hawaiian and Other 11,989 0.2% Other race alone
4,941,456 63.5% White alone 1,093,313 14.0% Hispanic 755,832 9.7% Asian alone 523,448 6.7% Two or more races 299,537 3.8% Black alone 69,024 0.9% American Indian alone 52,231 0.7% Native Hawaiian and Other 50,945 0.7% Other race alone
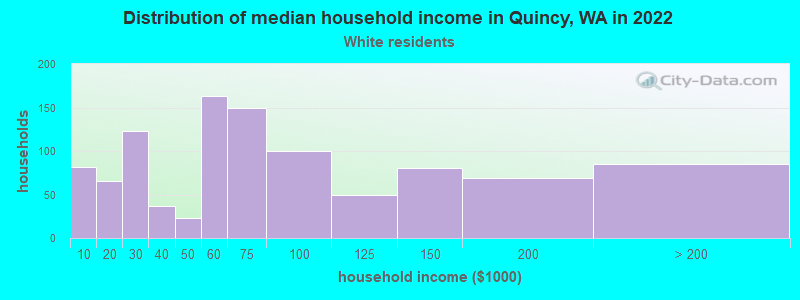
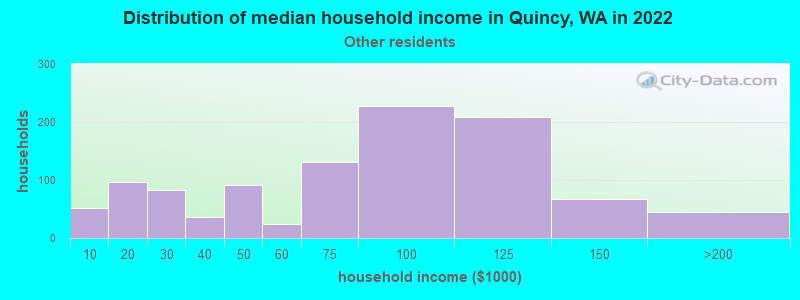
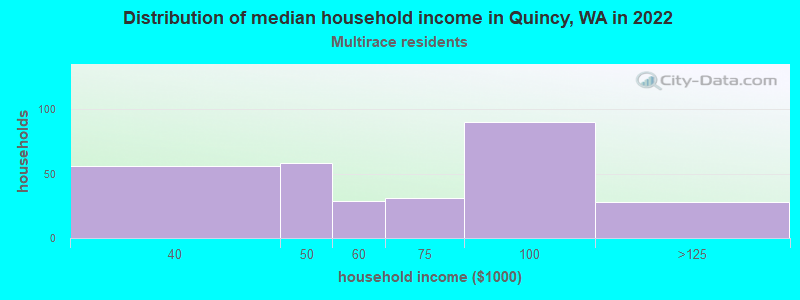
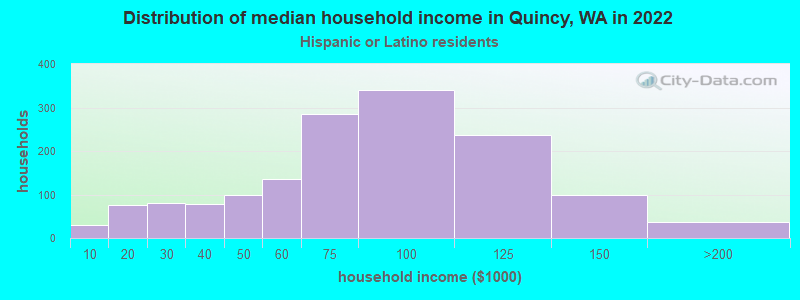
Income and house value in Quincy Median household income in 2022 $66,804 White non-Hispanic householders$81,148 Some other race householders$60,399 Two or more races householders$78,795 Hispanic or Latino race householdersMedian 2022 house value $289,560 White Non-Hispanic householders$298,031 American Indian or Alaska Native householders $352,931 Asian householders$306,815 Some other race householders$322,500 Two or more races householders$291,442 Hispanic or Latino householders
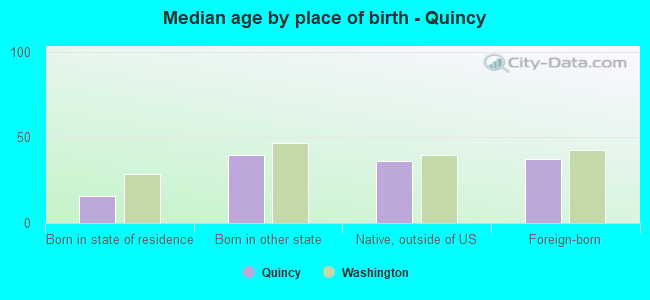
Median age by race in Quincy
29.9 Median age for White residents28.7 30.9 -694,779,115.8 Median age for Black or African American residents-684,418,145.3 -711,934,155.7 -818,882,465.5 Median age for American Indian / Alaska Native residents-1,021,468,925.5 -721,227,620.8 11.0 Median age for Asian residents-562,854,825.1 -536,945,812.3 -681,388,011.9 Median age for Native Hawaiian / Pacific Islander residents-666,666,666.0 -666,666,666.0 25.1 Median age for Other race residents26.8 26.0 17.9 Median age for Two or more races residents24.6 15.0 40.8 Median age for White alone residents38.6 49.3 24.9 Median age for Hispanic or Latino residents26.4 22.2
Owner/renter occupied households by race in Quincy
House owners and renters - White residents 909 81.8% Owner occupied202 18.2% Renter occupiedHouse owners and renters - Other race residents 274 35.7% Owner occupied494 64.3% Renter occupiedHouse owners and renters - Two or more races residents 332 85.7% Owner occupied55 14.3% Renter occupiedHouse owners and renters - White alone residents 692 84.8% Owner occupied125 15.2% Renter occupiedHouse owners and renters - Hispanic or Latino residents 772 55.7% Owner occupied614 44.3% Renter occupied
Language usage in Quincy
English speakers - Total 32.8% of residents of Quincy speak English at home.
62.6% of residents speak Spanish at home 2,837 63.6% Speak English very well1,624 36.4% Speak English less than very well0.9% of residents speak other language at home 2 3.3% Speak English very well59 96.7% Speak English less than very well
English speakers - Born in the United States 48.4% of residents of Quincy speak English at home.
60.5% of residents speak Spanish at home 574 92.6% Speak English very well46 7.4% Speak English less than very well0.1% of residents speak other language at home 1 100.0% Speak English very well
English speakers - Native, born elsewhere 24.7% of residents of Quincy speak English at home.
101.2% of residents speak Spanish at home 47 57.3% Speak English very well35 42.7% Speak English less than very well
English speakers - Foreign-born 2.1% of residents of Quincy speak English at home.
93.9% of residents speak Spanish at home 634 31.7% Speak English very well1,364 68.3% Speak English less than very well3.0% of residents speak other language at home 64 100.0% Speak English less than very well
White (Caucasian) - Speak only English Native:
77.2% (1,719)Foreign-born:
12.3% (25)
White (Caucasian) - Speak another language Native:
13.1% (292)Foreign-born:
72.7% (149)
Other race - Speak another language Native:
92.7% (1,355)Foreign-born:
98.9% (1,342)
Two or more races - Speak only English Native:
33.2% (474)Foreign-born:
8.6% (29)
Two or more races - Speak another language Native:
63.4% (906)Foreign-born:
85.8% (286)
White alone - Speak another language Native:
0.1% (1)Foreign-born:
100.0% (1)
Hispanic or Latino - Speak only English Native:
19.6% (654)Foreign-born:
3.3% (70)
Hispanic or Latino - Speak another language Native:
74.3% (2,477)Foreign-born:
95.6% (2,022)
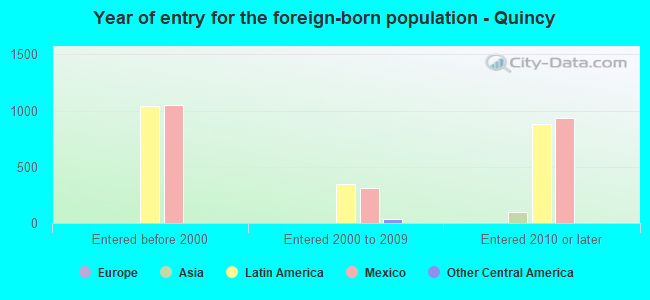
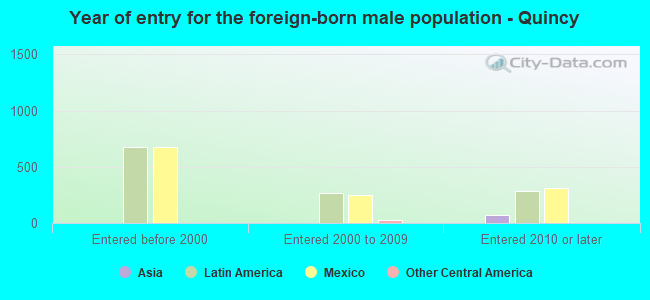
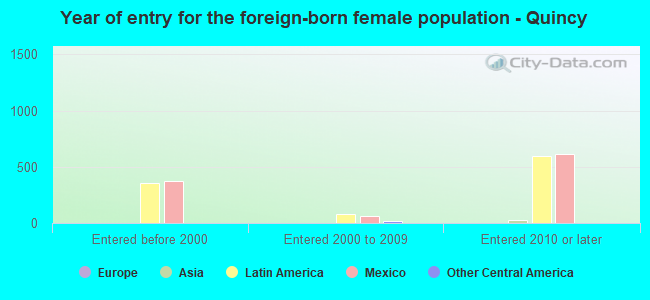
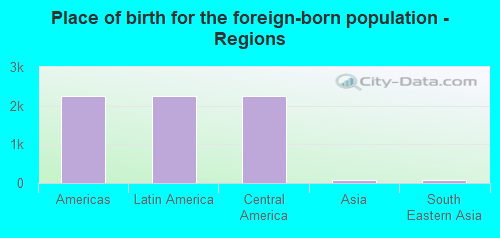
Foreign-born residents in Quincy 2,328 residents are foreign born (27.8% Latin America ).
This city:
29.4%Washington:
14.9%
Marital status for residents in Quincy Marital status - White (Caucasian) population 15 years and over
Males 15.4% Never married79.5% Now married0.0% Separated0.4% Widowed4.7% DivorcedFemales 12.1% Never married62.5% Now married3.0% Separated14.2% Widowed8.2% DivorcedWomen who gave birth in the past 12 months Now married:
87.2% (138)Unmarried:
12.8% (20)
Women who did not give birth in the past 12 months Now married:
69.5% (309)Unmarried:
30.5% (135)
Marital status - Other race population 15 years and over
Males 37.8% Never married51.1% Now married2.9% Separated0.0% Widowed8.2% DivorcedFemales 31.7% Never married68.3% Now married0.0% Separated0.0% Widowed0.0% DivorcedWomen who gave birth in the past 12 months Now married:
71.6% (93)Unmarried:
28.4% (37)
Women who did not give birth in the past 12 months Now married:
50.0% (285)Unmarried:
50.0% (285)
Marital status - Two or more races population 15 years and over
Males 38.3% Never married61.7% Now married0.0% Separated0.0% Widowed0.0% DivorcedFemales 36.2% Never married57.9% Now married4.7% Separated0.0% Widowed1.2% DivorcedWomen who did not give birth in the past 12 months Now married:
47.5% (128)Unmarried:
52.5% (141)
Marital status - White alone, not Hispanic / Latino population 15 years and over
Males 10.1% Never married81.9% Now married0.0% Separated0.7% Widowed7.3% DivorcedFemales 11.1% Never married60.3% Now married3.4% Separated20.4% Widowed4.8% DivorcedWomen who gave birth in the past 12 months Now married:
100.0% (83)Unmarried:
0.0% (0)
Women who did not give birth in the past 12 months Now married:
71.2% (163)Unmarried:
28.8% (66)
Marital status - Hispanic or Latino population 15 years and over
Males 36.7% Never married55.4% Now married2.1% Separated0.0% Widowed5.8% DivorcedFemales 29.1% Never married66.3% Now married1.2% Separated0.0% Widowed3.3% DivorcedWomen who gave birth in the past 12 months Now married:
72.9% (168)Unmarried:
27.1% (62)
Women who did not give birth in the past 12 months Now married:
54.9% (576)Unmarried:
45.1% (472)
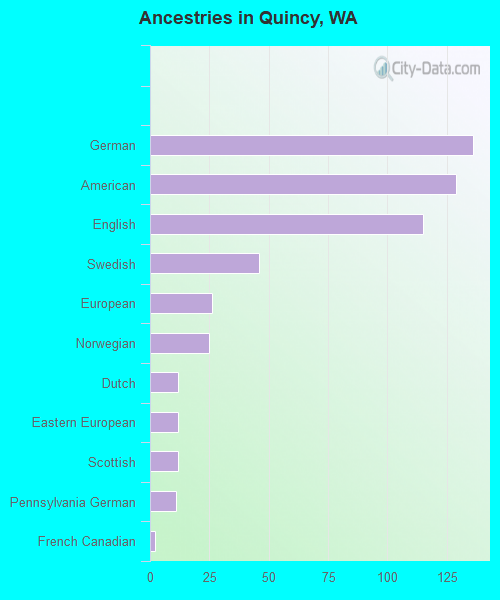
Ancestries in Quincy
136 2.9% German129 2.7% American115 2.4% English46 1.0% Swedish26 0.5% European25 0.5% Norwegian12 0.3% Dutch12 0.3% Eastern European12 0.3% Scottish11 0.2% Pennsylvania German2 0.04% French Canadian
Children Nativity (place of birth) in Quincy
Children under 6 years - Living with two parents Both parents native 518 100.0% NativeBoth parents foreign-born 297 100.0% NativeOne native, one foreign-born parent 150 100.0% NativeChildren under 6 years - Living with one parent Native parent 70 100.0% NativeForeign-born parent 118 100.0% NativeChildren 6 to 17 years - Living with two parents Both parents native 785 100.0% NativeBoth parents foreign-born 257 100.0% NativeOne native, one foreign-born parent 182 69.8% Native79 30.2% Foreign-bornChildren 6 to 17 years - Living with one parent Native parent 43 100.0% Foreign-bornForeign-born parent 281 64.2% Native156 35.8% Foreign-born