Races in Radnor Township, Pennsylvania (PA) Detailed Stats
Ancestries, Foreign-born residents, place of birth

Recent posts about races in Radnor Township, Pennsylvania on our local forum with over 2,400,000 registered users:
 | What are the chances of Trump winning Pennsylvania again in 2020 Election? (267 replies) |
| My turn! Let the house hunt begin! (17 replies) |
| Why Philly has so many bad schools? (78 replies) |
| Please tell me about the Main Line and other Philadelphia suburbs! (20 replies) |
| Good suburbs in Philadelphia (4 replies) |
| Recommendation on where to live in close suburbs (12 replies) |
8.3% of Radnor Township, PA residents are foreign-born (4.2% born in Asia, 2.9% born in Europe), which is 15.7% greater than the foreign-born rate of 7.0% across the entire state of Pennsylvania.
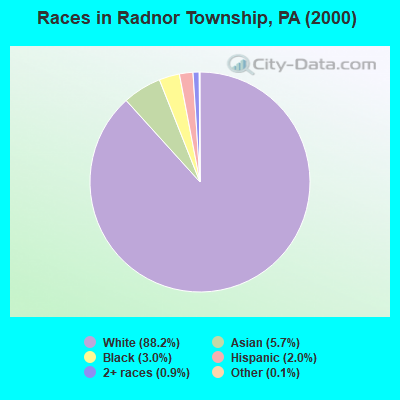
Race distribution in Radnor Township

- 27,23988.2%White alone
- 1,7485.7%Asian alone
- 9353.0%Black alone
- 6282.0%Hispanic
- 2700.9%Two or more races
- 370.1%Other race alone
- 170.06%American Indian alone
- 40.01%Native Hawaiian and Other
Pacific Islander alone
2000
2022
-
- 10,322,45584.1%White alone
- 1,202,4379.8%Black alone
- 394,0883.2%Hispanic
- 218,2961.8%Asian alone
- 113,0970.9%Two or more races
- 13,0860.1%Other race alone
- 14,9040.1%American Indian alone
- 2,6910.02%Native Hawaiian and Other
Pacific Islander alone

-
- 9,487,22873.1%White alone
- 1,311,58110.1%Black alone
- 1,115,9978.6%Hispanic
- 493,9423.8%Two or more races
- 487,1243.8%Asian alone
- 63,5820.5%Other race alone
- 10,1300.08%American Indian alone
- 2,4240.02%Native Hawaiian and Other
Pacific Islander alone

Income and house value in Radnor Township
- Median household income in 2022
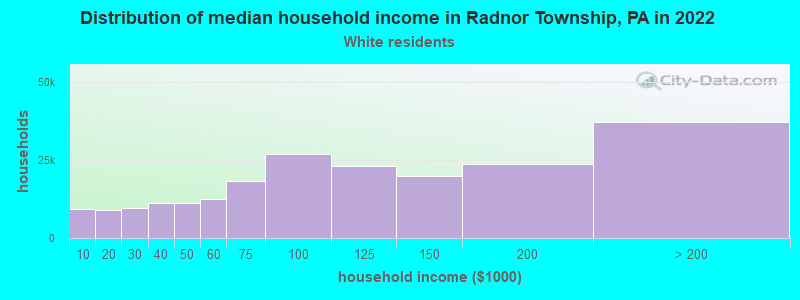
- $142,087White non-Hispanic householders
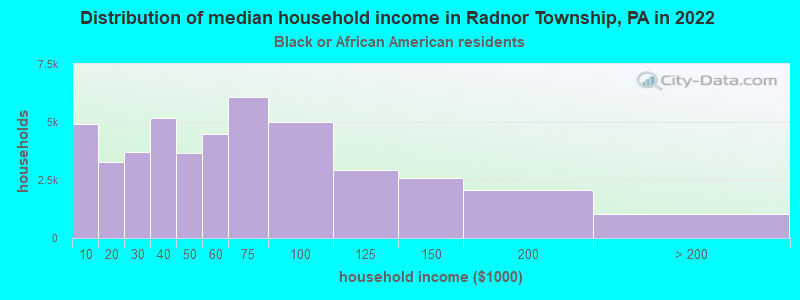
- $50,821Black householders
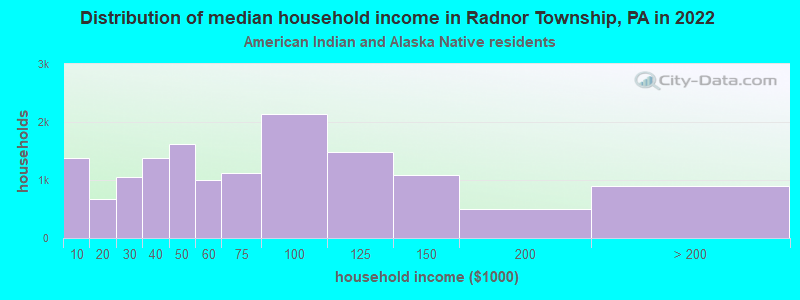
- $147,990American Indian and Alaska Native householders
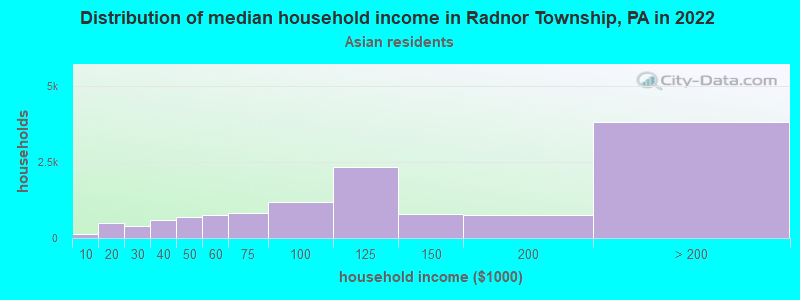
- $113,125Asian householders
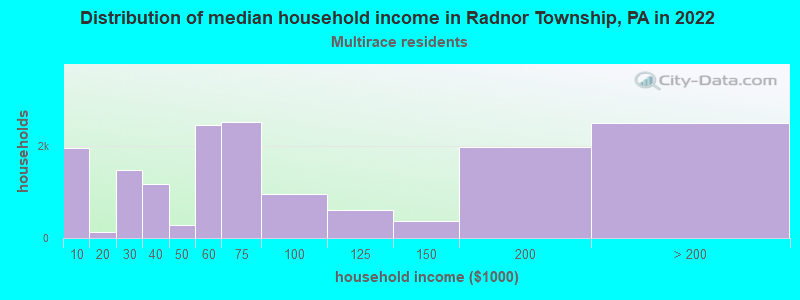
- $120,675Two or more races householders
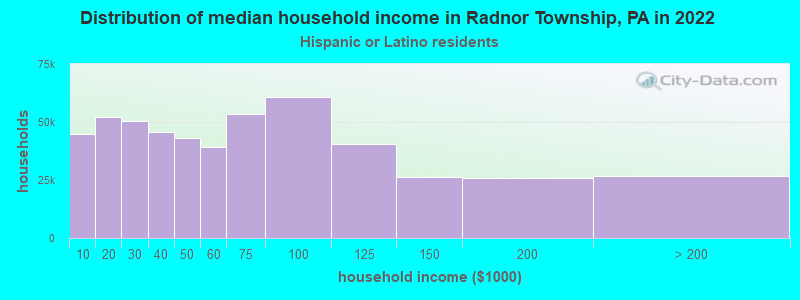
- $125,782Hispanic or Latino race householders
- Median 2022 house value
- $836,311White Non-Hispanic householders
- $340,350Black or African American householders
- $466,830American Indian or Alaska Native householders
- $620,698Asian householders
- $709,582Two or more races householders
- $304,498Hispanic or Latino householders
Household income for White non-Hispanic householders
Household income for Black householders
Household income for American Indian and Alaska Native householders
Household income for Asian householders
Household income for Two or more races householders
Household income for Hispanic or Latino race householders
Foreign-born residents in Radnor Township
2,563 residents are foreign born (4.2% Asia, 2.9% Europe).
| This city: | 8.3% |
| Pennsylvania: | 4.1% |
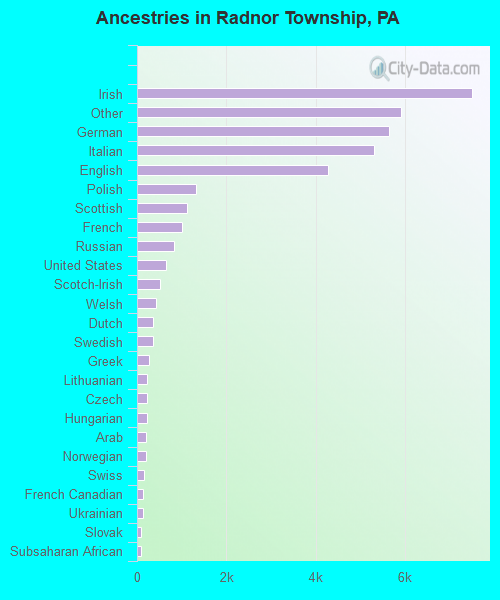
Ancestries in Radnor Township

- 7,50720.1%Irish
- 5,90315.8%Other
- 5,64415.1%German
- 5,29914.2%Italian
- 4,27911.4%English
- 1,3263.5%Polish
- 1,1113.0%Scottish
- 1,0072.7%French
- 8342.2%Russian
- 6431.7%United States
- 5231.4%Scotch-Irish
- 4231.1%Welsh
- 3611.0%Dutch
- 3510.9%Swedish
- 2700.7%Greek
- 2290.6%Lithuanian
- 2230.6%Czech
- 2170.6%Hungarian
- 1970.5%Arab
- 1940.5%Norwegian
- 1590.4%Swiss
- 1430.4%French Canadian
- 1430.4%Ukrainian
- 970.3%Slovak
- 950.3%Subsaharan African
- 910.2%Danish
- 800.2%West Indian
- 440.1%Portuguese
Zip codes: 19087.