Races in Rainier, Washington (WA) Detailed Stats
Data:
Races - White alone (%)
Races - White alone (% change since 2000)
Races - Black alone (%)
Races - Black alone (% change since 2000)
Races - American Indian alone (%)
Races - American Indian alone (% change since 2000)
Races - Asian alone (%)
Races - Asian alone (% change since 2000)
Races - Hispanic (%)
Races - Hispanic (% change since 2000)
Races - Native Hawaiian and Other Pacific Islander alone (%)
Races - Native Hawaiian and Other Pacific Islander alone (% change since 2000)
Races - Two or more races(%)
Races - Two or more races(% change since 2000)
Races - Other race alone (%)
Races - Other race alone (% change since 2000)
Racial diversity
Place of birth - Born in state of residence (%)
Place of birth - Born in state of residence (%) - White
Place of birth - Born in state of residence (%) - Black or African American
Place of birth - Born in state of residence (%) - Asian
Place of birth - Born in state of residence (%) - Hispanic or Latino
Place of birth - Born in state of residence (%) - American Indian and Alaska Native
Place of birth - Born in state of residence (%) - Multirace
Place of birth - Born in state of residence (%) - Other Race
Place of birth - Born in other state (%)
Place of birth - Born in other state (%) - White
Place of birth - Born in other state (%) - Black or African American
Place of birth - Born in other state (%) - Asian
Place of birth - Born in other state (%) - Hispanic or Latino
Place of birth - Born in other state (%) - American Indian and Alaska Native
Place of birth - Born in other state (%) - Multirace
Place of birth - Born in other state (%) - Other Race
Place of birth - Native, outside of US (%)
Place of birth - Native, outside of US (%) - White
Place of birth - Native, outside of US (%) - Black or African American
Place of birth - Native, outside of US (%) - Asian
Place of birth - Native, outside of US (%) - Hispanic or Latino
Place of birth - Native, outside of US (%) - American Indian and Alaska Native
Place of birth - Native, outside of US (%) - Multirace
Place of birth - Native, outside of US (%) - Other Race
Place of birth - Foreign born (%)
Place of birth - Foreign born (%) - White
Place of birth - Foreign born (%) - Black or African American
Place of birth - Foreign born (%) - Asian
Place of birth - Foreign born (%) - Hispanic or Latino
Place of birth - Foreign born (%) - American Indian and Alaska Native
Place of birth - Foreign born (%) - Multirace
Place of birth - Foreign born (%) - Other Race
Residents speaking English at home (%)
Residents speaking English at home - Born in the United States (%)
Residents speaking English at home - Native, born elsewhere (%)
Residents speaking English at home - Foreign born (%)
Residents speaking Spanish at home (%)
Residents speaking Spanish at home - Born in the United States (%)
Residents speaking Spanish at home - Native, born elsewhere (%)
Residents speaking Spanish at home - Foreign born (%)
Residents speaking other language at home (%)
Residents speaking other language at home - Born in the United States (%)
Residents speaking other language at home - Native, born elsewhere (%)
Residents speaking other language at home - Foreign born (%)
Marital status - Never married (%)
Marital status - Now married (%)
Marital status - Separated (%)
Marital status - Widowed (%)
Marital status - Divorced (%)
Ancestries Reported - Arab (%)
Ancestries Reported - Czech (%)
Ancestries Reported - Danish (%)
Ancestries Reported - Dutch (%)
Ancestries Reported - English (%)
Ancestries Reported - French (%)
Ancestries Reported - French Canadian (%)
Ancestries Reported - German (%)
Ancestries Reported - Greek (%)
Ancestries Reported - Hungarian (%)
Ancestries Reported - Irish (%)
Ancestries Reported - Italian (%)
Ancestries Reported - Lithuanian (%)
Ancestries Reported - Norwegian (%)
Ancestries Reported - Polish (%)
Ancestries Reported - Portuguese (%)
Ancestries Reported - Russian (%)
Ancestries Reported - Scotch-Irish (%)
Ancestries Reported - Scottish (%)
Ancestries Reported - Slovak (%)
Ancestries Reported - Subsaharan African (%)
Ancestries Reported - Swedish (%)
Ancestries Reported - Swiss (%)
Ancestries Reported - Ukrainian (%)
Ancestries Reported - United States (%)
Ancestries Reported - Welsh (%)
Ancestries Reported - West Indian (%)
Ancestries Reported - Other (%)
Geographical mobility - Same house 1 year ago (%)
Geographical mobility - Same house 1 year ago (%) - White
Geographical mobility - Same house 1 year ago (%) - Black or African American
Geographical mobility - Same house 1 year ago (%) - Asian
Geographical mobility - Same house 1 year ago (%) - Hispanic or Latino
Geographical mobility - Same house 1 year ago (%) - American Indian and Alaska Native
Geographical mobility - Same house 1 year ago (%) - Multirace
Geographical mobility - Same house 1 year ago (%) - Other Race
Geographical mobility - Moved within same county (%)
Geographical mobility - Moved within same county (%) - White
Geographical mobility - Moved within same county (%) - Black or African American
Geographical mobility - Moved within same county (%) - Asian
Geographical mobility - Moved within same county (%) - Hispanic or Latino
Geographical mobility - Moved within same county (%) - American Indian and Alaska Native
Geographical mobility - Moved within same county (%) - Multirace
Geographical mobility - Moved within same county (%) - Other Race
Geographical mobility - Moved from different county within same state (%)
Geographical mobility - Moved from different county within same state (%) - White
Geographical mobility - Moved from different county within same state (%) - Black or African American
Geographical mobility - Moved from different county within same state (%) - Asian
Geographical mobility - Moved from different county within same state (%) - Hispanic or Latino
Geographical mobility - Moved from different county within same state (%) - American Indian and Alaska Native
Geographical mobility - Moved from different county within same state (%) - Multirace
Geographical mobility - Moved from different county within same state (%) - Other Race
Geographical mobility - Moved from different state (%)
Geographical mobility - Moved from different state (%) - White
Geographical mobility - Moved from different state (%) - Black or African American
Geographical mobility - Moved from different state (%) - Asian
Geographical mobility - Moved from different state (%) - Hispanic or Latino
Geographical mobility - Moved from different state (%) - American Indian and Alaska Native
Geographical mobility - Moved from different state (%) - Multirace
Geographical mobility - Moved from different state (%) - Other Race
Geographical mobility - Moved from abroad (%)
Geographical mobility - Moved from abroad (%) - White
Geographical mobility - Moved from abroad (%) - Black or African American
Geographical mobility - Moved from abroad (%) - Asian
Geographical mobility - Moved from abroad (%) - Hispanic or Latino
Geographical mobility - Moved from abroad (%) - American Indian and Alaska Native
Geographical mobility - Moved from abroad (%) - Multirace
Geographical mobility - Moved from abroad (%) - Other Race
Place of birth for the foreign-born population - Ireland (%)
Place of birth for the foreign-born population - Denmark (%)
Place of birth for the foreign-born population - Norway (%)
Place of birth for the foreign-born population - Sweden (%)
Place of birth for the foreign-born population - United Kingdom (%)
Place of birth for the foreign-born population - England (%)
Place of birth for the foreign-born population - Scotland (%)
Place of birth for the foreign-born population - Other Northern Europe (%)
Place of birth for the foreign-born population - Austria (%)
Place of birth for the foreign-born population - Belgium (%)
Place of birth for the foreign-born population - France (%)
Place of birth for the foreign-born population - Germany (%)
Place of birth for the foreign-born population - Netherlands (%)
Place of birth for the foreign-born population - Switzerland (%)
Place of birth for the foreign-born population - Other Western Europe (%)
Place of birth for the foreign-born population - Greece (%)
Place of birth for the foreign-born population - Italy (%)
Place of birth for the foreign-born population - Portugal (%)
Place of birth for the foreign-born population - Spain (%)
Place of birth for the foreign-born population - Other Southern Europe (%)
Place of birth for the foreign-born population - Albania (%)
Place of birth for the foreign-born population - Belarus (%)
Place of birth for the foreign-born population - Bosnia and Herzegovina (%)
Place of birth for the foreign-born population - Bulgaria (%)
Place of birth for the foreign-born population - Croatia (%)
Place of birth for the foreign-born population - Czechoslovakia (%)
Place of birth for the foreign-born population - Hungary (%)
Place of birth for the foreign-born population - Latvia (%)
Place of birth for the foreign-born population - Lithuania (%)
Place of birth for the foreign-born population - North Macedonia (Macedonia) (%)
Place of birth for the foreign-born population - Moldova (%)
Place of birth for the foreign-born population - Poland (%)
Place of birth for the foreign-born population - Romania (%)
Place of birth for the foreign-born population - Russia (%)
Place of birth for the foreign-born population - Serbia (%)
Place of birth for the foreign-born population - Ukraine (%)
Place of birth for the foreign-born population - Other Eastern Europe (%)
Place of birth for the foreign-born population - China (%)
Place of birth for the foreign-born population - Hong Kong (%)
Place of birth for the foreign-born population - Taiwan (%)
Place of birth for the foreign-born population - Japan (%)
Place of birth for the foreign-born population - Korea (%)
Place of birth for the foreign-born population - Other Eastern Asia (%)
Place of birth for the foreign-born population - Afghanistan (%)
Place of birth for the foreign-born population - Bangladesh (%)
Place of birth for the foreign-born population - India (%)
Place of birth for the foreign-born population - Iran (%)
Place of birth for the foreign-born population - Kazakhstan (%)
Place of birth for the foreign-born population - Nepal (%)
Place of birth for the foreign-born population - Pakistan (%)
Place of birth for the foreign-born population - Sri Lanka (%)
Place of birth for the foreign-born population - Uzbekistan (%)
Place of birth for the foreign-born population - Other South Central Asia (%)
Place of birth for the foreign-born population - Burma (%)
Place of birth for the foreign-born population - Cambodia (%)
Place of birth for the foreign-born population - Indonesia (%)
Place of birth for the foreign-born population - Laos (%)
Place of birth for the foreign-born population - Malaysia (%)
Place of birth for the foreign-born population - Philippines (%)
Place of birth for the foreign-born population - Singapore (%)
Place of birth for the foreign-born population - Thailand (%)
Place of birth for the foreign-born population - Vietnam (%)
Place of birth for the foreign-born population - Other South Eastern Asia (%)
Place of birth for the foreign-born population - Armenia (%)
Place of birth for the foreign-born population - Iraq (%)
Place of birth for the foreign-born population - Israel (%)
Place of birth for the foreign-born population - Jordan (%)
Place of birth for the foreign-born population - Kuwait (%)
Place of birth for the foreign-born population - Lebanon (%)
Place of birth for the foreign-born population - Saudi Arabia (%)
Place of birth for the foreign-born population - Syria (%)
Place of birth for the foreign-born population - Turkey (%)
Place of birth for the foreign-born population - Yemen (%)
Place of birth for the foreign-born population - Other Western Asia (%)
Place of birth for the foreign-born population - Eritrea (%)
Place of birth for the foreign-born population - Ethiopia (%)
Place of birth for the foreign-born population - Kenya (%)
Place of birth for the foreign-born population - Somalia (%)
Place of birth for the foreign-born population - Uganda (%)
Place of birth for the foreign-born population - Zimbabwe (%)
Place of birth for the foreign-born population - Other Eastern Africa (%)
Place of birth for the foreign-born population - Cameroon (%)
Place of birth for the foreign-born population - Congo (%)
Place of birth for the foreign-born population - Democratic Republic of Congo (Zaire) (%)
Place of birth for the foreign-born population - Other Middle Africa (%)
Place of birth for the foreign-born population - Egypt (%)
Place of birth for the foreign-born population - Morocco (%)
Place of birth for the foreign-born population - Sudan (%)
Place of birth for the foreign-born population - Other Northern Africa (%)
Place of birth for the foreign-born population - South Africa (%)
Place of birth for the foreign-born population - Other Southern Africa (%)
Place of birth for the foreign-born population - Cabo Verde (%)
Place of birth for the foreign-born population - Ghana (%)
Place of birth for the foreign-born population - Liberia (%)
Place of birth for the foreign-born population - Nigeria (%)
Place of birth for the foreign-born population - Senegal (%)
Place of birth for the foreign-born population - Sierra Leone (%)
Place of birth for the foreign-born population - Other Western Africa (%)
Place of birth for the foreign-born population - Australia (%)
Place of birth for the foreign-born population - New Zealand (%)
Place of birth for the foreign-born population - Fiji (%)
Place of birth for the foreign-born population - Micronesia (%)
Place of birth for the foreign-born population - Bahamas (%)
Place of birth for the foreign-born population - Barbados (%)
Place of birth for the foreign-born population - Cuba (%)
Place of birth for the foreign-born population - Dominica (%)
Place of birth for the foreign-born population - Dominican Republic (%)
Place of birth for the foreign-born population - Grenada (%)
Place of birth for the foreign-born population - Haiti (%)
Place of birth for the foreign-born population - Jamaica (%)
Place of birth for the foreign-born population - St. Vincent and the Grenadines (%)
Place of birth for the foreign-born population - Trinidad and Tobago (%)
Place of birth for the foreign-born population - West Indies (%)
Place of birth for the foreign-born population - Other Caribbean (%)
Place of birth for the foreign-born population - Belize (%)
Place of birth for the foreign-born population - Costa Rica (%)
Place of birth for the foreign-born population - El Salvador (%)
Place of birth for the foreign-born population - Guatemala (%)
Place of birth for the foreign-born population - Honduras (%)
Place of birth for the foreign-born population - Mexico (%)
Place of birth for the foreign-born population - Nicaragua (%)
Place of birth for the foreign-born population - Panama (%)
Place of birth for the foreign-born population - Other Central America (%)
Place of birth for the foreign-born population - Argentina (%)
Place of birth for the foreign-born population - Bolivia (%)
Place of birth for the foreign-born population - Brazil (%)
Place of birth for the foreign-born population - Chile (%)
Place of birth for the foreign-born population - Colombia (%)
Place of birth for the foreign-born population - Ecuador (%)
Place of birth for the foreign-born population - Guyana (%)
Place of birth for the foreign-born population - Peru (%)
Place of birth for the foreign-born population - Uruguay (%)
Place of birth for the foreign-born population - Venezuela (%)
Place of birth for the foreign-born population - Other South America (%)
Place of birth for the foreign-born population - Canada (%)
Place of birth for the foreign-born population - Other Northern America (%)
Place of birth for the foreign-born population - Other (%)
Latest news about races in Rainier, WA collected exclusively by city-data.com from local newspapers, TV, and radio stations
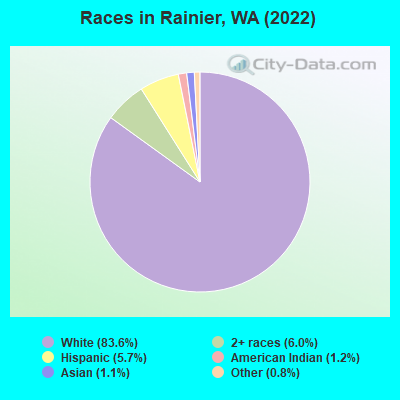
According to 2022 data, the most numerous races in Rainier, WA are White alone (2,296 residents), Hispanic (157 residents), and Asian alone (29 residents). 96.4% of Rainier residents speak English at home. 2.1% of Rainier, WA residents are foreign-born (1.3% born in North America, 0.4% born in Europe), which is 610.7% less than the foreign-born rate of 15.0% across the entire state of Washington.
Race distribution in Rainier
2000 2022
4,652,490 78.9% White alone 441,509 7.5% Hispanic 319,401 5.4% Asian alone 184,631 3.1% Black alone 175,926 3.0% Two or more races 85,396 1.4% American Indian alone 22,779 0.4% Native Hawaiian and Other 11,989 0.2% Other race alone
4,941,456 63.5% White alone 1,093,313 14.0% Hispanic 755,832 9.7% Asian alone 523,448 6.7% Two or more races 299,537 3.8% Black alone 69,024 0.9% American Indian alone 52,231 0.7% Native Hawaiian and Other 50,945 0.7% Other race alone
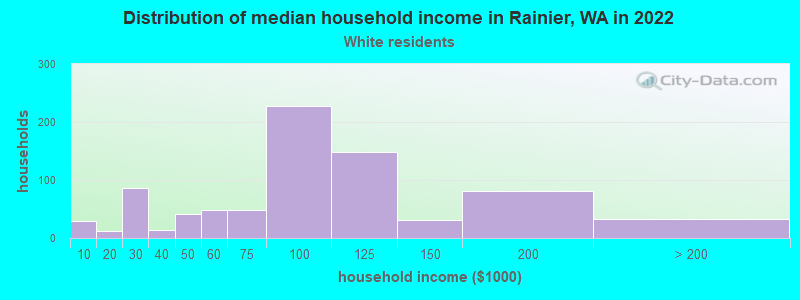
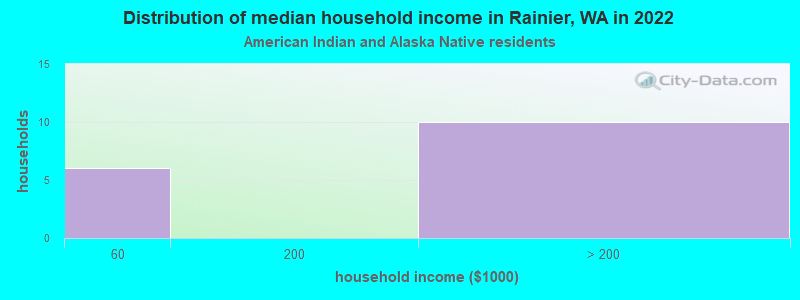
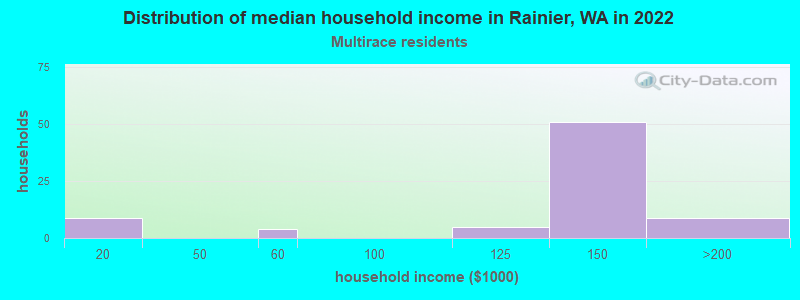
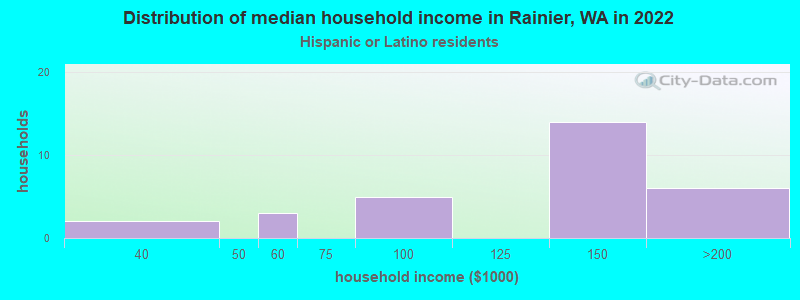
Income and house value in Rainier Median household income in 2022 $86,363 White non-Hispanic householders$147,951 Two or more races householders$142,520 Hispanic or Latino race householdersMedian 2022 house value $405,259 White Non-Hispanic householders$318,266 American Indian or Alaska Native householders $318,266 Asian householders$138,622 Some other race householders$397,833 Two or more races householders$265,222 Hispanic or Latino householders
Median age by race in Rainier
39.8 Median age for White residents42.5 39.7 -681,295,715.1 Median age for Black or African American residents-642,276,422.1 -749,469,213.7 45.9 Median age for American Indian / Alaska Native residents47.0 40.1 53.0 Median age for Asian residents-718,360,070.6 -683,563,747.4 -768,670,308.9 Median age for Native Hawaiian / Pacific Islander residents-810,861,422.4 -642,361,110.5 71.4 Median age for Other race residents-746,296,295.6 -910,356,831.1 29.3 Median age for Two or more races residents37.2 17.3 39.8 Median age for White alone residents42.0 39.0 31.5 Median age for Hispanic or Latino residents39.3 18.3
Owner/renter occupied households by race in Rainier
House owners and renters - White residents 621 81.8% Owner occupied138 18.2% Renter occupiedHouse owners and renters - American Indian / Alaska Native residents 17 100.0% Owner occupiedHouse owners and renters - Other race residents 6 100.0% Owner occupiedHouse owners and renters - Two or more races residents 85 100.0% Owner occupiedHouse owners and renters - White alone residents 623 81.9% Owner occupied138 18.1% Renter occupiedHouse owners and renters - Hispanic or Latino residents 44 100.0% Owner occupied
Language usage in Rainier
English speakers - Total 96.4% of residents of Rainier speak English at home.
2.4% of residents speak Spanish at home 57 93.4% Speak English very well4 6.6% Speak English less than very well1.2% of residents speak other language at home 24 80.0% Speak English very well6 20.0% Speak English less than very well
English speakers - Born in the United States 99.2% of residents of Rainier speak English at home.
1.0% of residents speak Spanish at home 9 100.0% Speak English very well0.5% of residents speak other language at home 2 40.0% Speak English very well3 60.0% Speak English less than very well
English speakers - Native, born elsewhere 91.8% of residents of Rainier speak English at home.
2.9% of residents speak other language at home 5 100.0% Speak English very well
English speakers - Foreign-born 70.2% of residents of Rainier speak English at home.
5.3% of residents speak Spanish at home 3 100.0% Speak English less than very well17.5% of residents speak other language at home 7 70.0% Speak English very well3 30.0% Speak English less than very well
White (Caucasian) - Speak only English Native:
97.4% (2,108)Foreign-born:
81.0% (35)
White (Caucasian) - Speak another language Native:
2.4% (52)Foreign-born:
24.6% (11)
Asian - Speak only English Native:
100.0% (27)Foreign-born:
98.6% (3)
White alone - Speak only English Native:
97.7% (2,106)Foreign-born:
85.7% (38)
White alone - Speak another language Native:
2.0% (44)Foreign-born:
18.8% (8)
Hispanic or Latino - Speak another language Native:
16.2% (20)Foreign-born:
98.8% (4)
Foreign-born residents in Rainier 58 residents are foreign born (1.3% North America , 0.4% Europe ).
This city:
2.1%Washington:
14.9%
Marital status for residents in Rainier Marital status - White (Caucasian) population 15 years and over
Males 34.1% Never married53.7% Now married2.7% Separated1.2% Widowed8.3% DivorcedFemales 24.8% Never married52.4% Now married3.3% Separated4.7% Widowed14.9% DivorcedWomen who gave birth in the past 12 months Now married:
77.8% (14)Unmarried:
22.2% (4)
Women who did not give birth in the past 12 months Now married:
43.2% (231)Unmarried:
56.8% (304)
Marital status - American Indian / Alaska Native population 15 years and over
Males 0.0% Never married42.9% Now married0.0% Separated0.0% Widowed57.1% DivorcedFemales 68.8% Never married31.2% Now married0.0% Separated0.0% Widowed0.0% DivorcedWomen who did not give birth in the past 12 months Now married:
0.0% (0)Unmarried:
100.0% (13)
Marital status - Asian population 15 years and over
Males 100.0% Never married0.0% Now married0.0% Separated0.0% Widowed0.0% DivorcedFemales 0.0% Never married100.0% Now married0.0% Separated0.0% Widowed0.0% DivorcedMarital status - Other race population 15 years and over
Males 0.0% Never married100.0% Now married0.0% Separated0.0% Widowed0.0% DivorcedFemales 0.0% Never married100.0% Now married0.0% Separated0.0% Widowed0.0% DivorcedMarital status - Two or more races population 15 years and over
Males 57.1% Never married38.1% Now married0.0% Separated0.0% Widowed4.8% DivorcedFemales 56.6% Never married10.8% Now married0.0% Separated10.8% Widowed21.7% DivorcedWomen who gave birth in the past 12 months Now married:
0.0% (0)Unmarried:
100.0% (2)
Women who did not give birth in the past 12 months Now married:
11.3% (9)Unmarried:
88.7% (71)
Marital status - White alone, not Hispanic / Latino population 15 years and over
Males 34.4% Never married53.2% Now married2.8% Separated1.2% Widowed8.4% DivorcedFemales 24.9% Never married51.8% Now married3.3% Separated4.8% Widowed15.1% DivorcedWomen who gave birth in the past 12 months Now married:
71.4% (10)Unmarried:
28.6% (4)
Women who did not give birth in the past 12 months Now married:
43.2% (232)Unmarried:
56.8% (306)
Marital status - Hispanic or Latino population 15 years and over
Males 56.1% Never married43.9% Now married0.0% Separated0.0% Widowed0.0% DivorcedFemales 75.9% Never married24.1% Now married0.0% Separated0.0% Widowed0.0% DivorcedWomen who gave birth in the past 12 months Now married:
66.7% (4)Unmarried:
33.3% (2)
Women who did not give birth in the past 12 months Now married:
4.5% (2)Unmarried:
95.5% (41)
Ancestries in Rainier
193 22.8% Irish98 11.6% German70 8.3% English64 7.6% American54 6.4% Polish35 4.1% European25 2.9% Italian24 2.8% Norwegian24 2.8% Scotch-Irish23 2.7% Northern European22 2.6% Swedish17 2.0% Scottish16 1.9% Australian15 1.8% Scandinavian13 1.5% French8 0.9% Lebanese3 0.4% Portuguese2 0.2% British2 0.2% Eastern European2 0.2% French Canadian
Children Nativity (place of birth) in Rainier
Children under 6 years - Living with two parents Both parents native 81 100.0% NativeOne native, one foreign-born parent 19 100.0% NativeChildren under 6 years - Living with one parent Native parent 66 100.0% NativeChildren 6 to 17 years - Living with two parents Both parents native 200 100.0% NativeOne native, one foreign-born parent 3 100.0% NativeChildren 6 to 17 years - Living with one parent Native parent 111 100.0% NativeForeign-born parent 28 60.8% Native18 39.2% Foreign-born
Grandparents responsible for own grandchildren in Rainier
Grandparents (30 to 59 years) White / Caucasian 5 23.0% Responsible for grandchildren16 77.0% Not responsible for grandchildrenAmerican Indian / Alaska Native 6 100.0% Responsible for grandchildrenTwo or more races 1 93.8% Not responsible for grandchildrenWhite alone, not Hispanic / Latino 5 32.9% Responsible for grandchildren10 67.1% Not responsible for grandchildrenHispanic or Latino 7 100.0% Not responsible for grandchildrenGrandparents (60 years and over) White / Caucasian 12 17.3% Responsible for grandchildren55 82.7% Not responsible for grandchildrenTwo or more races 13 100.0% Not responsible for grandchildrenWhite alone, not Hispanic / Latino 12 16.2% Responsible for grandchildren60 83.8% Not responsible for grandchildren