Races in Ramapo, New York (NY) Detailed Stats
Ancestries, Foreign-born residents, place of birth

Recent posts about races in Ramapo, New York on our local forum with over 2,400,000 registered users:

Latest news about races in Ramapo, NY collected exclusively by city-data.com from local newspapers, TV, and radio stations
22.8% of Ramapo, NY residents are foreign-born (11.3% born in Latin America, 5.3% born in Europe, 5.2% born in Asia), which is 3.6% greater than the foreign-born rate of 22.0% across the entire state of New York.
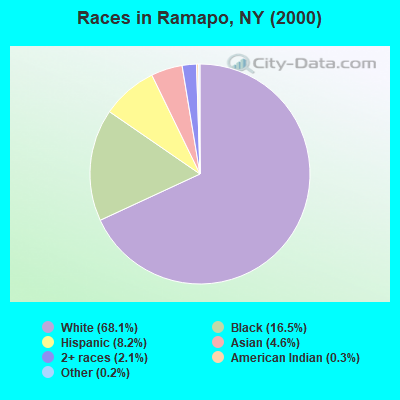
Race distribution in Ramapo

- 74,19968.1%White alone
- 17,96516.5%Black alone
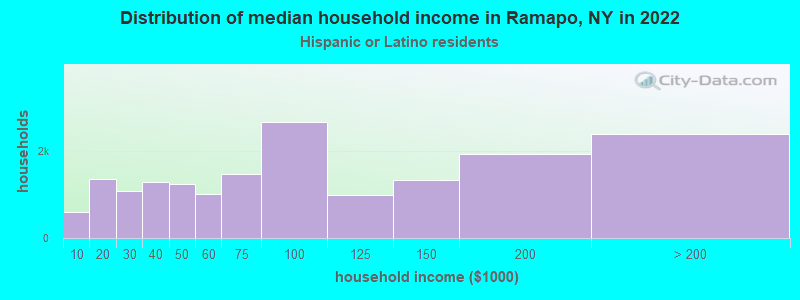
- 8,9238.2%Hispanic
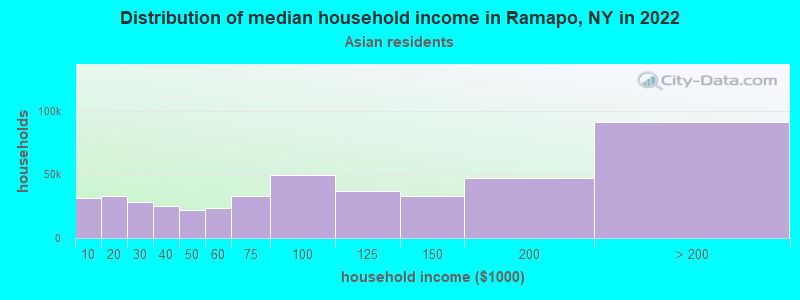
- 4,9644.6%Asian alone
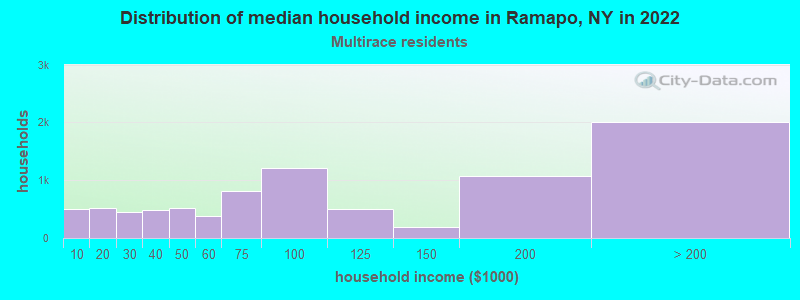
- 2,2942.1%Two or more races
- 2770.3%American Indian alone
- 2430.2%Other race alone
- 400.04%Native Hawaiian and Other
Pacific Islander alone
2000
2022
-
- 11,760,98162.0%White alone
- 2,867,58315.1%Hispanic
- 2,812,62314.8%Black alone
- 1,035,9265.5%Asian alone
- 366,1161.9%Two or more races
- 75,4990.4%Other race alone
- 52,4990.3%American Indian alone
- 5,2300.03%Native Hawaiian and Other
Pacific Islander alone

-
- 10,408,93352.9%White alone
- 3,867,29919.7%Hispanic
- 2,633,84013.4%Black alone
- 1,776,2869.0%Asian alone
- 732,6703.7%Two or more races
- 216,1101.1%Other race alone
- 35,0820.2%American Indian alone
- 6,9310.04%Native Hawaiian and Other
Pacific Islander alone

Income and house value in Ramapo
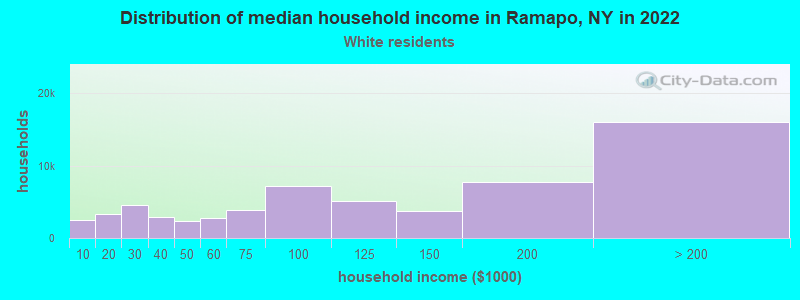
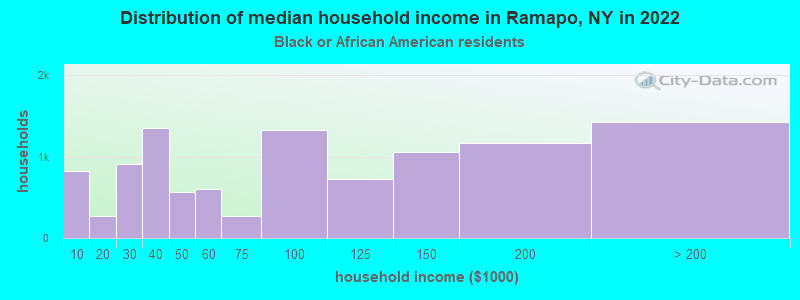
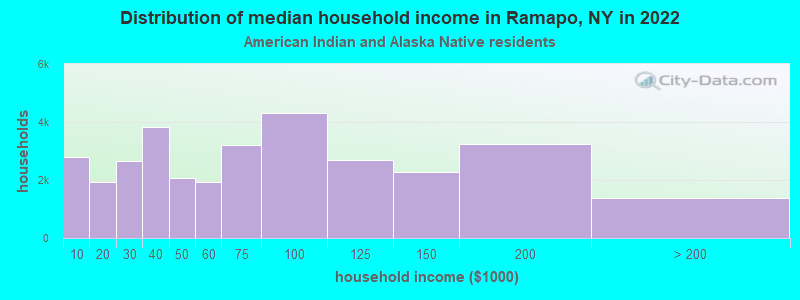
- Median household income in 2022
- $94,823White non-Hispanic householders
- $78,439Black householders
- $146,602American Indian and Alaska Native householders
- $108,392Asian householders
- $77,410Some other race householders
- $82,695Two or more races householders
- $85,273Hispanic or Latino race householders
- Median 2022 house value
- $564,762White Non-Hispanic householders
- $452,045Black or African American householders
- $367,154American Indian or Alaska Native householders
- $506,988Asian householders
- $436,246Some other race householders
- $479,163Two or more races householders
- $506,045Hispanic or Latino householders
Household income for White non-Hispanic householders
Household income for Black householders
Household income for American Indian and Alaska Native householders
Household income for Asian householders
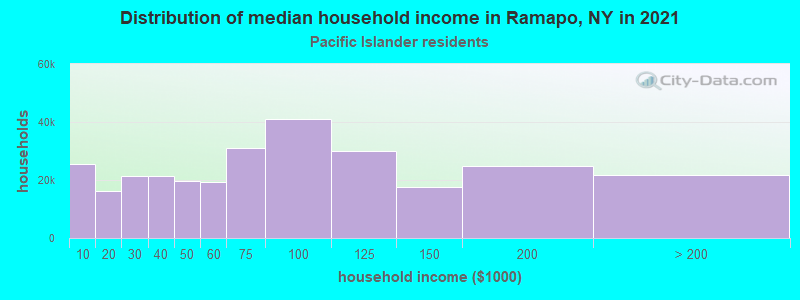
Household income for Native Hawaiian and other Pacific Islander householders
Household income for Two or more races householders
Household income for Hispanic or Latino race householders
Foreign-born residents in Ramapo
24,848 residents are foreign born (11.3% Latin America, 5.3% Europe, 5.2% Asia).
| This city: | 22.8% |
| New York: | 20.4% |
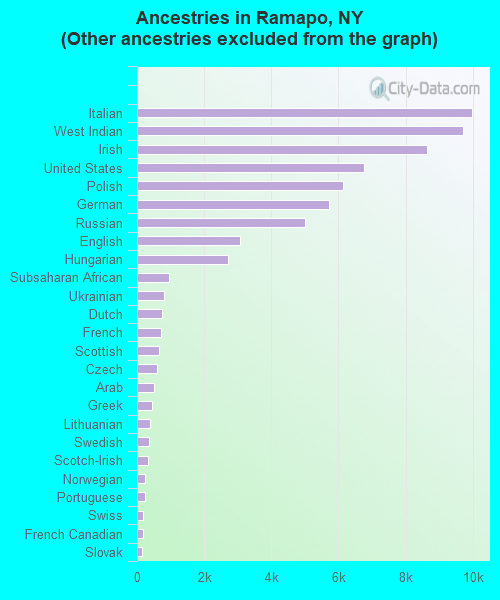
Ancestries in Ramapo

- 42,50139.4%Other
- 9,9879.3%Italian
- 9,7169.0%West Indian
- 8,6388.0%Irish
- 6,7526.3%United States
- 6,1245.7%Polish
- 5,7115.3%German
- 4,9974.6%Russian
- 3,0822.9%English
- 2,7082.5%Hungarian
- 9400.9%Subsaharan African
- 8070.7%Ukrainian
- 7480.7%Dutch
- 7280.7%French
- 6560.6%Scottish
- 6030.6%Czech
- 5050.5%Arab
- 4340.4%Greek
- 3750.3%Lithuanian
- 3480.3%Swedish
- 3360.3%Scotch-Irish
- 2490.2%Norwegian
- 2310.2%Portuguese
- 1820.2%Swiss
- 1790.2%French Canadian
- 1530.1%Slovak
- 1050.10%Welsh
- 630.06%Danish
Zip codes: 10952.