Races in Rantoul, Illinois (IL) Detailed Stats
Data:
Races - White alone (%)
Races - White alone (% change since 2000)
Races - Black alone (%)
Races - Black alone (% change since 2000)
Races - American Indian alone (%)
Races - American Indian alone (% change since 2000)
Races - Asian alone (%)
Races - Asian alone (% change since 2000)
Races - Hispanic (%)
Races - Hispanic (% change since 2000)
Races - Native Hawaiian and Other Pacific Islander alone (%)
Races - Native Hawaiian and Other Pacific Islander alone (% change since 2000)
Races - Two or more races(%)
Races - Two or more races(% change since 2000)
Races - Other race alone (%)
Races - Other race alone (% change since 2000)
Racial diversity
Place of birth - Born in state of residence (%)
Place of birth - Born in state of residence (%) - White
Place of birth - Born in state of residence (%) - Black or African American
Place of birth - Born in state of residence (%) - Asian
Place of birth - Born in state of residence (%) - Hispanic or Latino
Place of birth - Born in state of residence (%) - American Indian and Alaska Native
Place of birth - Born in state of residence (%) - Multirace
Place of birth - Born in state of residence (%) - Other Race
Place of birth - Born in other state (%)
Place of birth - Born in other state (%) - White
Place of birth - Born in other state (%) - Black or African American
Place of birth - Born in other state (%) - Asian
Place of birth - Born in other state (%) - Hispanic or Latino
Place of birth - Born in other state (%) - American Indian and Alaska Native
Place of birth - Born in other state (%) - Multirace
Place of birth - Born in other state (%) - Other Race
Place of birth - Native, outside of US (%)
Place of birth - Native, outside of US (%) - White
Place of birth - Native, outside of US (%) - Black or African American
Place of birth - Native, outside of US (%) - Asian
Place of birth - Native, outside of US (%) - Hispanic or Latino
Place of birth - Native, outside of US (%) - American Indian and Alaska Native
Place of birth - Native, outside of US (%) - Multirace
Place of birth - Native, outside of US (%) - Other Race
Place of birth - Foreign born (%)
Place of birth - Foreign born (%) - White
Place of birth - Foreign born (%) - Black or African American
Place of birth - Foreign born (%) - Asian
Place of birth - Foreign born (%) - Hispanic or Latino
Place of birth - Foreign born (%) - American Indian and Alaska Native
Place of birth - Foreign born (%) - Multirace
Place of birth - Foreign born (%) - Other Race
Residents speaking English at home (%)
Residents speaking English at home - Born in the United States (%)
Residents speaking English at home - Native, born elsewhere (%)
Residents speaking English at home - Foreign born (%)
Residents speaking Spanish at home (%)
Residents speaking Spanish at home - Born in the United States (%)
Residents speaking Spanish at home - Native, born elsewhere (%)
Residents speaking Spanish at home - Foreign born (%)
Residents speaking other language at home (%)
Residents speaking other language at home - Born in the United States (%)
Residents speaking other language at home - Native, born elsewhere (%)
Residents speaking other language at home - Foreign born (%)
Marital status - Never married (%)
Marital status - Now married (%)
Marital status - Separated (%)
Marital status - Widowed (%)
Marital status - Divorced (%)
Ancestries Reported - Arab (%)
Ancestries Reported - Czech (%)
Ancestries Reported - Danish (%)
Ancestries Reported - Dutch (%)
Ancestries Reported - English (%)
Ancestries Reported - French (%)
Ancestries Reported - French Canadian (%)
Ancestries Reported - German (%)
Ancestries Reported - Greek (%)
Ancestries Reported - Hungarian (%)
Ancestries Reported - Irish (%)
Ancestries Reported - Italian (%)
Ancestries Reported - Lithuanian (%)
Ancestries Reported - Norwegian (%)
Ancestries Reported - Polish (%)
Ancestries Reported - Portuguese (%)
Ancestries Reported - Russian (%)
Ancestries Reported - Scotch-Irish (%)
Ancestries Reported - Scottish (%)
Ancestries Reported - Slovak (%)
Ancestries Reported - Subsaharan African (%)
Ancestries Reported - Swedish (%)
Ancestries Reported - Swiss (%)
Ancestries Reported - Ukrainian (%)
Ancestries Reported - United States (%)
Ancestries Reported - Welsh (%)
Ancestries Reported - West Indian (%)
Ancestries Reported - Other (%)
Geographical mobility - Same house 1 year ago (%)
Geographical mobility - Same house 1 year ago (%) - White
Geographical mobility - Same house 1 year ago (%) - Black or African American
Geographical mobility - Same house 1 year ago (%) - Asian
Geographical mobility - Same house 1 year ago (%) - Hispanic or Latino
Geographical mobility - Same house 1 year ago (%) - American Indian and Alaska Native
Geographical mobility - Same house 1 year ago (%) - Multirace
Geographical mobility - Same house 1 year ago (%) - Other Race
Geographical mobility - Moved within same county (%)
Geographical mobility - Moved within same county (%) - White
Geographical mobility - Moved within same county (%) - Black or African American
Geographical mobility - Moved within same county (%) - Asian
Geographical mobility - Moved within same county (%) - Hispanic or Latino
Geographical mobility - Moved within same county (%) - American Indian and Alaska Native
Geographical mobility - Moved within same county (%) - Multirace
Geographical mobility - Moved within same county (%) - Other Race
Geographical mobility - Moved from different county within same state (%)
Geographical mobility - Moved from different county within same state (%) - White
Geographical mobility - Moved from different county within same state (%) - Black or African American
Geographical mobility - Moved from different county within same state (%) - Asian
Geographical mobility - Moved from different county within same state (%) - Hispanic or Latino
Geographical mobility - Moved from different county within same state (%) - American Indian and Alaska Native
Geographical mobility - Moved from different county within same state (%) - Multirace
Geographical mobility - Moved from different county within same state (%) - Other Race
Geographical mobility - Moved from different state (%)
Geographical mobility - Moved from different state (%) - White
Geographical mobility - Moved from different state (%) - Black or African American
Geographical mobility - Moved from different state (%) - Asian
Geographical mobility - Moved from different state (%) - Hispanic or Latino
Geographical mobility - Moved from different state (%) - American Indian and Alaska Native
Geographical mobility - Moved from different state (%) - Multirace
Geographical mobility - Moved from different state (%) - Other Race
Geographical mobility - Moved from abroad (%)
Geographical mobility - Moved from abroad (%) - White
Geographical mobility - Moved from abroad (%) - Black or African American
Geographical mobility - Moved from abroad (%) - Asian
Geographical mobility - Moved from abroad (%) - Hispanic or Latino
Geographical mobility - Moved from abroad (%) - American Indian and Alaska Native
Geographical mobility - Moved from abroad (%) - Multirace
Geographical mobility - Moved from abroad (%) - Other Race
Place of birth for the foreign-born population - Ireland (%)
Place of birth for the foreign-born population - Denmark (%)
Place of birth for the foreign-born population - Norway (%)
Place of birth for the foreign-born population - Sweden (%)
Place of birth for the foreign-born population - United Kingdom (%)
Place of birth for the foreign-born population - England (%)
Place of birth for the foreign-born population - Scotland (%)
Place of birth for the foreign-born population - Other Northern Europe (%)
Place of birth for the foreign-born population - Austria (%)
Place of birth for the foreign-born population - Belgium (%)
Place of birth for the foreign-born population - France (%)
Place of birth for the foreign-born population - Germany (%)
Place of birth for the foreign-born population - Netherlands (%)
Place of birth for the foreign-born population - Switzerland (%)
Place of birth for the foreign-born population - Other Western Europe (%)
Place of birth for the foreign-born population - Greece (%)
Place of birth for the foreign-born population - Italy (%)
Place of birth for the foreign-born population - Portugal (%)
Place of birth for the foreign-born population - Spain (%)
Place of birth for the foreign-born population - Other Southern Europe (%)
Place of birth for the foreign-born population - Albania (%)
Place of birth for the foreign-born population - Belarus (%)
Place of birth for the foreign-born population - Bosnia and Herzegovina (%)
Place of birth for the foreign-born population - Bulgaria (%)
Place of birth for the foreign-born population - Croatia (%)
Place of birth for the foreign-born population - Czechoslovakia (%)
Place of birth for the foreign-born population - Hungary (%)
Place of birth for the foreign-born population - Latvia (%)
Place of birth for the foreign-born population - Lithuania (%)
Place of birth for the foreign-born population - North Macedonia (Macedonia) (%)
Place of birth for the foreign-born population - Moldova (%)
Place of birth for the foreign-born population - Poland (%)
Place of birth for the foreign-born population - Romania (%)
Place of birth for the foreign-born population - Russia (%)
Place of birth for the foreign-born population - Serbia (%)
Place of birth for the foreign-born population - Ukraine (%)
Place of birth for the foreign-born population - Other Eastern Europe (%)
Place of birth for the foreign-born population - China (%)
Place of birth for the foreign-born population - Hong Kong (%)
Place of birth for the foreign-born population - Taiwan (%)
Place of birth for the foreign-born population - Japan (%)
Place of birth for the foreign-born population - Korea (%)
Place of birth for the foreign-born population - Other Eastern Asia (%)
Place of birth for the foreign-born population - Afghanistan (%)
Place of birth for the foreign-born population - Bangladesh (%)
Place of birth for the foreign-born population - India (%)
Place of birth for the foreign-born population - Iran (%)
Place of birth for the foreign-born population - Kazakhstan (%)
Place of birth for the foreign-born population - Nepal (%)
Place of birth for the foreign-born population - Pakistan (%)
Place of birth for the foreign-born population - Sri Lanka (%)
Place of birth for the foreign-born population - Uzbekistan (%)
Place of birth for the foreign-born population - Other South Central Asia (%)
Place of birth for the foreign-born population - Burma (%)
Place of birth for the foreign-born population - Cambodia (%)
Place of birth for the foreign-born population - Indonesia (%)
Place of birth for the foreign-born population - Laos (%)
Place of birth for the foreign-born population - Malaysia (%)
Place of birth for the foreign-born population - Philippines (%)
Place of birth for the foreign-born population - Singapore (%)
Place of birth for the foreign-born population - Thailand (%)
Place of birth for the foreign-born population - Vietnam (%)
Place of birth for the foreign-born population - Other South Eastern Asia (%)
Place of birth for the foreign-born population - Armenia (%)
Place of birth for the foreign-born population - Iraq (%)
Place of birth for the foreign-born population - Israel (%)
Place of birth for the foreign-born population - Jordan (%)
Place of birth for the foreign-born population - Kuwait (%)
Place of birth for the foreign-born population - Lebanon (%)
Place of birth for the foreign-born population - Saudi Arabia (%)
Place of birth for the foreign-born population - Syria (%)
Place of birth for the foreign-born population - Turkey (%)
Place of birth for the foreign-born population - Yemen (%)
Place of birth for the foreign-born population - Other Western Asia (%)
Place of birth for the foreign-born population - Eritrea (%)
Place of birth for the foreign-born population - Ethiopia (%)
Place of birth for the foreign-born population - Kenya (%)
Place of birth for the foreign-born population - Somalia (%)
Place of birth for the foreign-born population - Uganda (%)
Place of birth for the foreign-born population - Zimbabwe (%)
Place of birth for the foreign-born population - Other Eastern Africa (%)
Place of birth for the foreign-born population - Cameroon (%)
Place of birth for the foreign-born population - Congo (%)
Place of birth for the foreign-born population - Democratic Republic of Congo (Zaire) (%)
Place of birth for the foreign-born population - Other Middle Africa (%)
Place of birth for the foreign-born population - Egypt (%)
Place of birth for the foreign-born population - Morocco (%)
Place of birth for the foreign-born population - Sudan (%)
Place of birth for the foreign-born population - Other Northern Africa (%)
Place of birth for the foreign-born population - South Africa (%)
Place of birth for the foreign-born population - Other Southern Africa (%)
Place of birth for the foreign-born population - Cabo Verde (%)
Place of birth for the foreign-born population - Ghana (%)
Place of birth for the foreign-born population - Liberia (%)
Place of birth for the foreign-born population - Nigeria (%)
Place of birth for the foreign-born population - Senegal (%)
Place of birth for the foreign-born population - Sierra Leone (%)
Place of birth for the foreign-born population - Other Western Africa (%)
Place of birth for the foreign-born population - Australia (%)
Place of birth for the foreign-born population - New Zealand (%)
Place of birth for the foreign-born population - Fiji (%)
Place of birth for the foreign-born population - Micronesia (%)
Place of birth for the foreign-born population - Bahamas (%)
Place of birth for the foreign-born population - Barbados (%)
Place of birth for the foreign-born population - Cuba (%)
Place of birth for the foreign-born population - Dominica (%)
Place of birth for the foreign-born population - Dominican Republic (%)
Place of birth for the foreign-born population - Grenada (%)
Place of birth for the foreign-born population - Haiti (%)
Place of birth for the foreign-born population - Jamaica (%)
Place of birth for the foreign-born population - St. Vincent and the Grenadines (%)
Place of birth for the foreign-born population - Trinidad and Tobago (%)
Place of birth for the foreign-born population - West Indies (%)
Place of birth for the foreign-born population - Other Caribbean (%)
Place of birth for the foreign-born population - Belize (%)
Place of birth for the foreign-born population - Costa Rica (%)
Place of birth for the foreign-born population - El Salvador (%)
Place of birth for the foreign-born population - Guatemala (%)
Place of birth for the foreign-born population - Honduras (%)
Place of birth for the foreign-born population - Mexico (%)
Place of birth for the foreign-born population - Nicaragua (%)
Place of birth for the foreign-born population - Panama (%)
Place of birth for the foreign-born population - Other Central America (%)
Place of birth for the foreign-born population - Argentina (%)
Place of birth for the foreign-born population - Bolivia (%)
Place of birth for the foreign-born population - Brazil (%)
Place of birth for the foreign-born population - Chile (%)
Place of birth for the foreign-born population - Colombia (%)
Place of birth for the foreign-born population - Ecuador (%)
Place of birth for the foreign-born population - Guyana (%)
Place of birth for the foreign-born population - Peru (%)
Place of birth for the foreign-born population - Uruguay (%)
Place of birth for the foreign-born population - Venezuela (%)
Place of birth for the foreign-born population - Other South America (%)
Place of birth for the foreign-born population - Canada (%)
Place of birth for the foreign-born population - Other Northern America (%)
Place of birth for the foreign-born population - Other (%)
Latest news about races in Rantoul, IL collected exclusively by city-data.com from local newspapers, TV, and radio stations
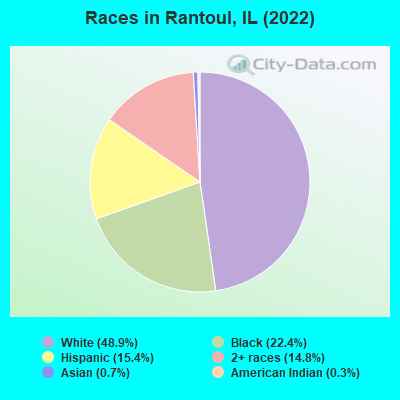
According to 2022 data, the most numerous races in Rantoul, IL are White alone (6,138 residents), Hispanic (1,926 residents), and Black alone (2,815 residents). 85.5% of Rantoul residents speak English at home. 6.6% of Rantoul, IL residents are foreign-born (5.2% born in Latin America), which is 113.7% less than the foreign-born rate of 14.0% across the entire state of Illinois.
Race distribution in Rantoul
2000 2022
8,424,140 67.8% White alone 1,856,152 14.9% Black alone 1,530,262 12.3% Hispanic 419,916 3.4% Asian alone 153,996 1.2% Two or more races 13,479 0.1% Other race alone 18,232 0.1% American Indian alone 3,116 0.03% Native Hawaiian and Other
7,356,301 58.5% White alone 2,299,726 18.3% Hispanic 1,660,423 13.2% Black alone 747,296 5.9% Asian alone 458,599 3.6% Two or more races 45,386 0.4% Other race alone 10,405 0.08% American Indian alone 3,896 0.03% Native Hawaiian and Other
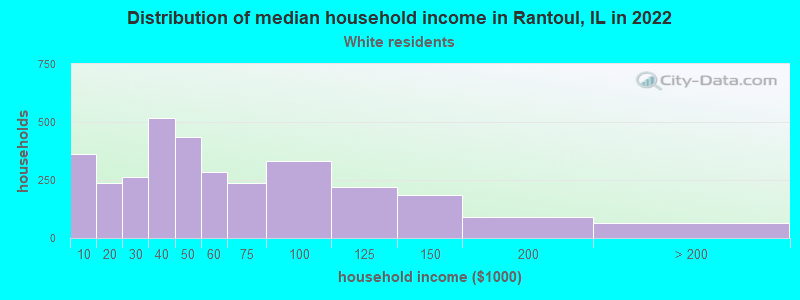
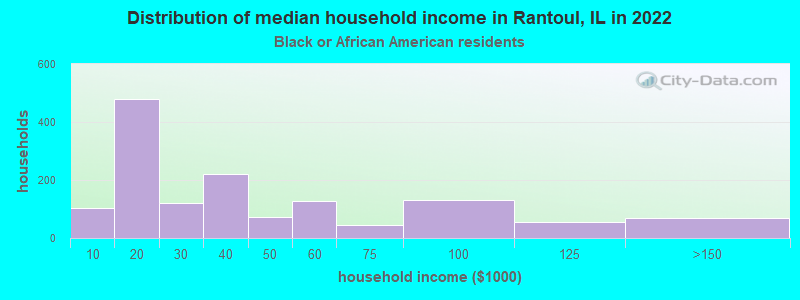
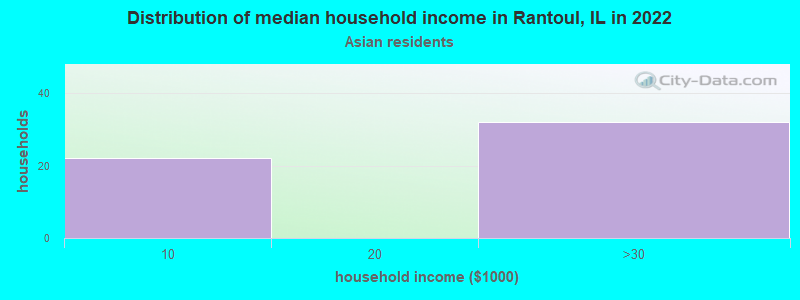
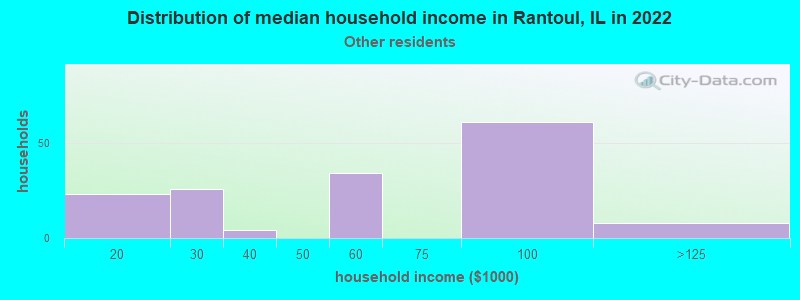
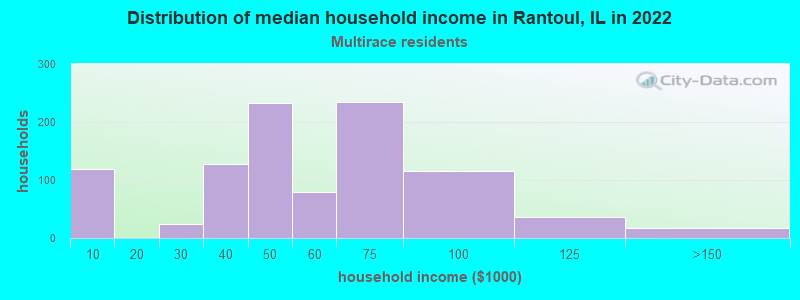
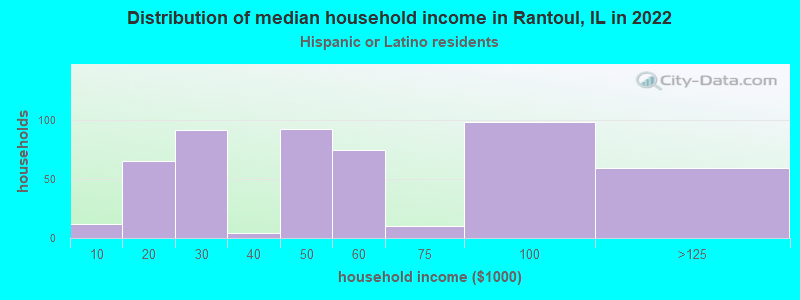
Income and house value in Rantoul Median household income in 2022 $46,293 White non-Hispanic householders$29,230 Black householders$53,234 Some other race householders$76,744 Two or more races householders$69,716 Hispanic or Latino race householdersMedian 2022 house value $112,823 White Non-Hispanic householders$98,513 Black or African American householders$128,037 American Indian or Alaska Native householders $114,179 Asian householders$79,684 Two or more races householders$119,300 Hispanic or Latino householders
Median age by race in Rantoul
46.1 Median age for White residents41.3 51.0 25.3 Median age for Black or African American residents22.8 27.8 -303,030,302.7 Median age for American Indian / Alaska Native residents-663,453,814.6 -442,105,262.7 42.2 Median age for Asian residents-686,357,242.6 41.5 -593,236,714.4 Median age for Native Hawaiian / Pacific Islander residents-666,666,666.0 -576,015,108.0 37.7 Median age for Other race residents43.7 11.4 21.9 Median age for Two or more races residents21.0 20.9 48.1 Median age for White alone residents42.0 52.8 21.2 Median age for Hispanic or Latino residents21.1 21.0
Owner/renter occupied households by race in Rantoul
House owners and renters - White residents 2,142 66.6% Owner occupied1,074 33.4% Renter occupiedHouse owners and renters - Black or African American residents 348 26.8% Owner occupied954 73.2% Renter occupiedHouse owners and renters - American Indian / Alaska Native residents 19 100.0% Owner occupiedHouse owners and renters - Asian residents 49 100.0% Renter occupiedHouse owners and renters - Other race residents 97 57.1% Owner occupied73 42.9% Renter occupiedHouse owners and renters - Two or more races residents 284 37.1% Owner occupied481 62.9% Renter occupiedHouse owners and renters - White alone residents 2,084 67.8% Owner occupied991 32.2% Renter occupiedHouse owners and renters - Hispanic or Latino residents 244 43.4% Owner occupied318 56.6% Renter occupied
Language usage in Rantoul
English speakers - Total 85.5% of residents of Rantoul speak English at home.
12.3% of residents speak Spanish at home 865 60.6% Speak English very well562 39.4% Speak English less than very well1.6% of residents speak other language at home 116 62.7% Speak English very well69 37.3% Speak English less than very well
English speakers - Born in the United States 94.2% of residents of Rantoul speak English at home.
5.7% of residents speak Spanish at home 134 88.7% Speak English very well17 11.3% Speak English less than very well1.0% of residents speak other language at home 28 100.0% Speak English very well
English speakers - Native, born elsewhere 80.5% of residents of Rantoul speak English at home.
16.5% of residents speak Spanish at home 64 100.0% Speak English very well
English speakers - Foreign-born 10.7% of residents of Rantoul speak English at home.
80.4% of residents speak Spanish at home 278 39.8% Speak English very well421 60.2% Speak English less than very well14.5% of residents speak other language at home 60 47.6% Speak English very well66 52.4% Speak English less than very well
White (Caucasian) - Speak only English Native:
95.1% (5,825)Foreign-born:
13.0% (62)
White (Caucasian) - Speak another language Native:
3.5% (217)Foreign-born:
87.6% (419)
Black or African American - Speak another language Native:
1.1% (27)Foreign-born:
100.0% (34)
Asian - Speak only English Native:
100.0% (47)Foreign-born:
7.5% (3)
Other race - Speak another language Native:
100.0% (156)Foreign-born:
100.0% (214)
Two or more races - Speak only English Native:
78.7% (1,756)Foreign-born:
12.2% (44)
Two or more races - Speak another language Native:
18.7% (417)Foreign-born:
84.2% (304)
White alone - Speak only English Native:
99.1% (5,634)Foreign-born:
26.8% (32)
White alone - Speak another language Native:
1.1% (60)Foreign-born:
50.2% (60)
Hispanic or Latino - Speak only English Native:
34.2% (366)Foreign-born:
8.4% (63)
Hispanic or Latino - Speak another language Native:
66.9% (716)Foreign-born:
92.2% (694)
Foreign-born residents in Rantoul 822 residents are foreign born (5.2% Latin America ).
This city:
6.6%Illinois:
14.1%
Marital status for residents in Rantoul Marital status - White (Caucasian) population 15 years and over
Males 39.7% Never married47.0% Now married0.3% Separated4.7% Widowed8.3% DivorcedFemales 24.2% Never married41.4% Now married3.6% Separated15.0% Widowed15.8% DivorcedWomen who gave birth in the past 12 months Now married:
12.3% (19)Unmarried:
87.7% (134)
Women who did not give birth in the past 12 months Now married:
46.8% (593)Unmarried:
53.2% (673)
Marital status - Black or African American population 15 years and over
Males 53.1% Never married18.6% Now married4.8% Separated0.0% Widowed23.5% DivorcedFemales 58.3% Never married11.2% Now married4.1% Separated6.3% Widowed20.1% DivorcedWomen who gave birth in the past 12 months Now married:
100.0% (22)Unmarried:
0.0% (0)
Women who did not give birth in the past 12 months Now married:
7.5% (55)Unmarried:
92.5% (677)
Marital status - American Indian / Alaska Native population 15 years and over
Males 0.0% Never married100.0% Now married0.0% Separated0.0% Widowed0.0% DivorcedFemales 100.0% Never married0.0% Now married0.0% Separated0.0% Widowed0.0% DivorcedWomen who did not give birth in the past 12 months Now married:
0.0% (0)Unmarried:
100.0% (18)
Marital status - Other race population 15 years and over
Males 0.0% Never married71.4% Now married0.0% Separated0.0% Widowed28.6% DivorcedFemales 0.9% Never married61.9% Now married0.0% Separated0.0% Widowed37.2% DivorcedWomen who did not give birth in the past 12 months Now married:
70.7% (48)Unmarried:
29.3% (20)
Marital status - Two or more races population 15 years and over
Males 51.1% Never married27.5% Now married8.6% Separated0.0% Widowed12.8% DivorcedFemales 67.9% Never married12.1% Now married0.0% Separated1.3% Widowed18.6% DivorcedWomen who gave birth in the past 12 months Now married:
0.0% (0)Unmarried:
100.0% (93)
Women who did not give birth in the past 12 months Now married:
13.4% (118)Unmarried:
86.6% (758)
Marital status - White alone, not Hispanic / Latino population 15 years and over
Males 38.9% Never married47.8% Now married0.3% Separated4.0% Widowed9.0% DivorcedFemales 22.6% Never married40.0% Now married3.0% Separated16.8% Widowed17.6% DivorcedWomen who gave birth in the past 12 months Now married:
9.4% (12)Unmarried:
90.6% (114)
Women who did not give birth in the past 12 months Now married:
44.9% (486)Unmarried:
55.1% (596)
Marital status - Hispanic or Latino population 15 years and over
Males 37.8% Never married48.5% Now married3.2% Separated4.6% Widowed5.8% DivorcedFemales 28.8% Never married55.6% Now married5.8% Separated2.0% Widowed7.8% DivorcedWomen who gave birth in the past 12 months Now married:
23.5% (8)Unmarried:
76.5% (26)
Women who did not give birth in the past 12 months Now married:
60.2% (222)Unmarried:
39.8% (147)
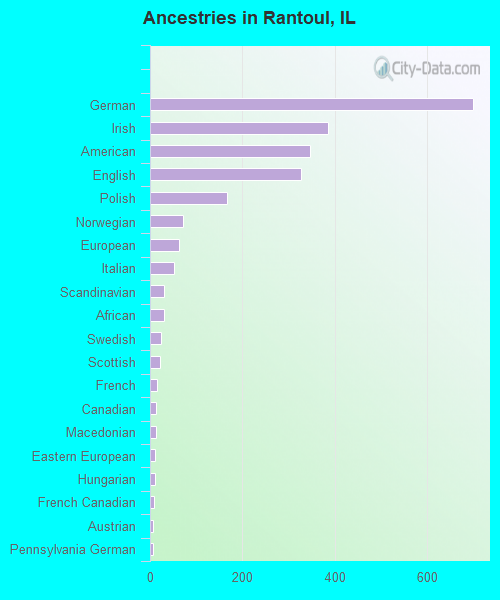
Ancestries in Rantoul
699 11.4% German385 6.3% Irish347 5.6% American327 5.3% English166 2.7% Polish72 1.2% Norwegian63 1.0% European52 0.8% Italian31 0.5% Scandinavian30 0.5% African23 0.4% Swedish22 0.4% Scottish15 0.2% French13 0.2% Canadian12 0.2% Macedonian11 0.2% Eastern European10 0.2% Hungarian9 0.1% French Canadian7 0.1% Austrian7 0.1% Pennsylvania German6 0.10% Russian5 0.08% Finnish5 0.08% Slovak4 0.07% Palestinian4 0.07% Welsh3 0.05% Belgian
Geographical mobility in Rantoul Same house 1 year ago 5,612 83.3% White (Caucasian)2,386 84.8% Black or African American28 99.7% American Indian / Alaska Native82 95.8% Asian354 88.2% Other race2,887 97.7% Two or more races5,224 86.4% White alone, not Hispanic / Latino1,465 77.8% Hispanic or LatinoMoved within same county 539 8.0% White / Caucasian107 3.8% Black or African American76 2.6% Two or more races554 9.2% White alone, not Hispanic / Latino17 0.9% Hispanic or LatinoMoved within same state 439 6.5% White / Caucasian128 4.5% Black or African American48 1.6% Two or more races131 2.2% White alone, not Hispanic / Latino234 12.4% Hispanic or LatinoMoved from different state 55 0.8% White / Caucasian214 7.6% Black or African American18 0.6% Two or more races56 0.9% White alone, not Hispanic / LatinoMoved from abroad 26 0.4% White39 1.4% Black or African American1 1.0% Asian25 0.4% White alone, not Hispanic / Latino55 2.9% Hispanic or Latino
Children Nativity (place of birth) in Rantoul
Children under 6 years - Living with two parents Both parents native 265 100.0% NativeBoth parents foreign-born 52 100.0% NativeOne native, one foreign-born parent 68 100.0% NativeChildren under 6 years - Living with one parent Native parent 536 100.0% NativeForeign-born parent 5 100.0% NativeChildren 6 to 17 years - Living with two parents Both parents native 143 100.0% NativeBoth parents foreign-born 440 100.0% NativeOne native, one foreign-born parent 113 100.0% NativeChildren 6 to 17 years - Living with one parent Native parent 974 100.0% NativeForeign-born parent 99 49.8% Native100 50.2% Foreign-born
Grandparents responsible for own grandchildren in Rantoul
Grandparents (30 to 59 years) White / Caucasian 25 42.9% Responsible for grandchildren33 57.1% Not responsible for grandchildrenTwo or more races 83 100.0% Not responsible for grandchildrenWhite alone, not Hispanic / Latino 28 40.2% Responsible for grandchildren41 59.8% Not responsible for grandchildrenGrandparents (60 years and over) White / Caucasian 11 20.9% Responsible for grandchildren41 79.1% Not responsible for grandchildrenWhite alone, not Hispanic / Latino 12 20.2% Responsible for grandchildren46 79.8% Not responsible for grandchildren