Races in Rapid Valley, South Dakota (SD) Detailed Stats
Data:
Races - White alone (%)
Races - White alone (% change since 2000)
Races - Black alone (%)
Races - Black alone (% change since 2000)
Races - American Indian alone (%)
Races - American Indian alone (% change since 2000)
Races - Asian alone (%)
Races - Asian alone (% change since 2000)
Races - Hispanic (%)
Races - Hispanic (% change since 2000)
Races - Native Hawaiian and Other Pacific Islander alone (%)
Races - Native Hawaiian and Other Pacific Islander alone (% change since 2000)
Races - Two or more races(%)
Races - Two or more races(% change since 2000)
Races - Other race alone (%)
Races - Other race alone (% change since 2000)
Racial diversity
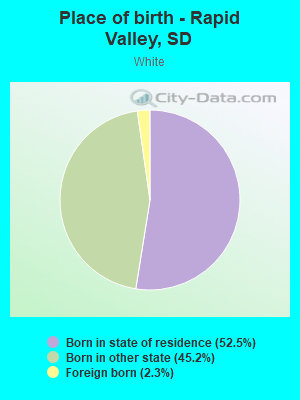
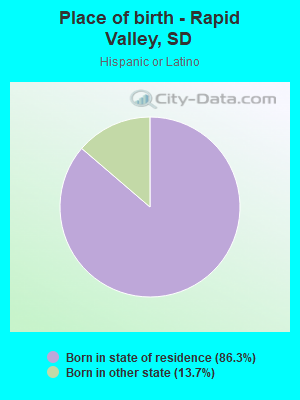
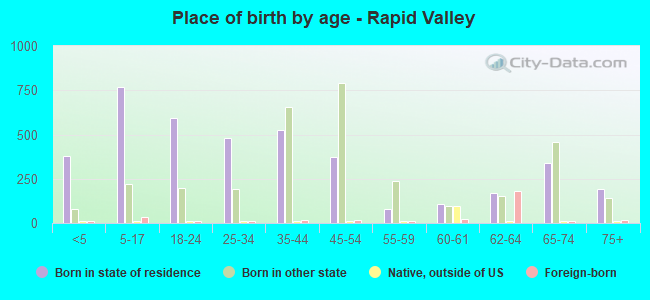
Place of birth - Born in state of residence (%)
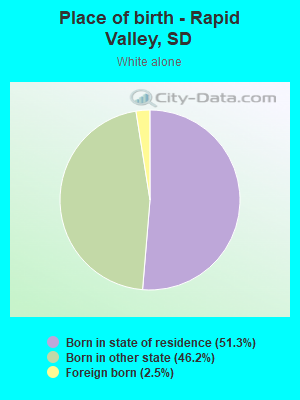
Place of birth - Born in state of residence (%) - White
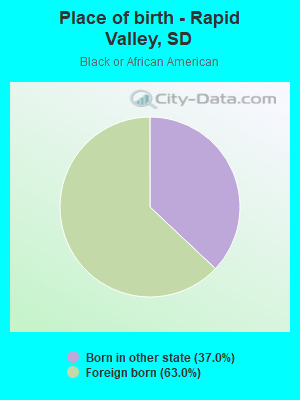
Place of birth - Born in state of residence (%) - Black or African American
Place of birth - Born in state of residence (%) - Asian
Place of birth - Born in state of residence (%) - Hispanic or Latino
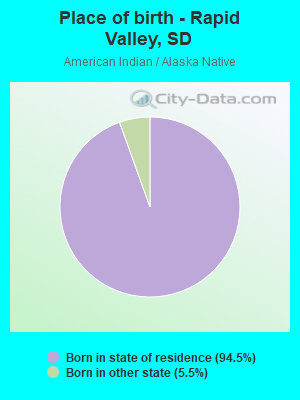
Place of birth - Born in state of residence (%) - American Indian and Alaska Native
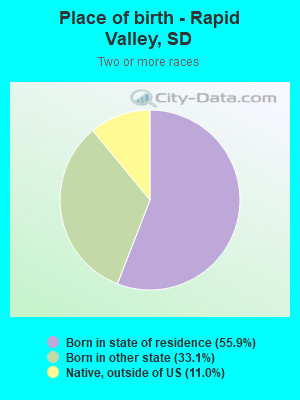
Place of birth - Born in state of residence (%) - Multirace
Place of birth - Born in state of residence (%) - Other Race
Place of birth - Born in other state (%)
Place of birth - Born in other state (%) - White
Place of birth - Born in other state (%) - Black or African American
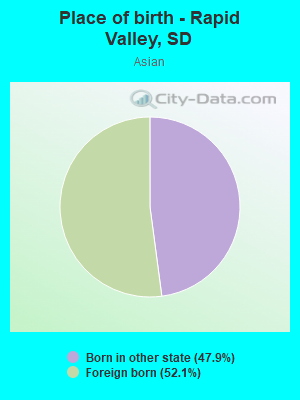
Place of birth - Born in other state (%) - Asian
Place of birth - Born in other state (%) - Hispanic or Latino
Place of birth - Born in other state (%) - American Indian and Alaska Native
Place of birth - Born in other state (%) - Multirace
Place of birth - Born in other state (%) - Other Race
Place of birth - Native, outside of US (%)
Place of birth - Native, outside of US (%) - White
Place of birth - Native, outside of US (%) - Black or African American
Place of birth - Native, outside of US (%) - Asian
Place of birth - Native, outside of US (%) - Hispanic or Latino
Place of birth - Native, outside of US (%) - American Indian and Alaska Native
Place of birth - Native, outside of US (%) - Multirace
Place of birth - Native, outside of US (%) - Other Race
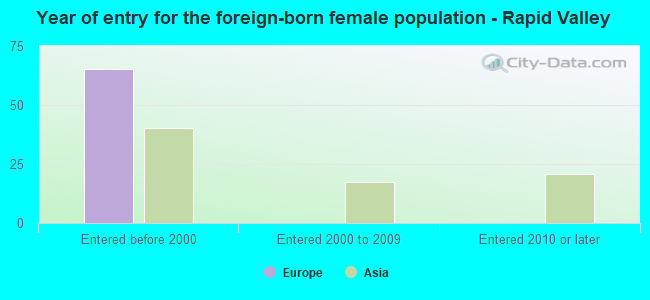
Place of birth - Foreign born (%)
Place of birth - Foreign born (%) - White
Place of birth - Foreign born (%) - Black or African American
Place of birth - Foreign born (%) - Asian
Place of birth - Foreign born (%) - Hispanic or Latino
Place of birth - Foreign born (%) - American Indian and Alaska Native
Place of birth - Foreign born (%) - Multirace
Place of birth - Foreign born (%) - Other Race
Residents speaking English at home (%)
Residents speaking English at home - Born in the United States (%)
Residents speaking English at home - Native, born elsewhere (%)
Residents speaking English at home - Foreign born (%)
Residents speaking Spanish at home (%)
Residents speaking Spanish at home - Born in the United States (%)
Residents speaking Spanish at home - Native, born elsewhere (%)
Residents speaking Spanish at home - Foreign born (%)
Residents speaking other language at home (%)
Residents speaking other language at home - Born in the United States (%)
Residents speaking other language at home - Native, born elsewhere (%)
Residents speaking other language at home - Foreign born (%)
Marital status - Never married (%)
Marital status - Now married (%)
Marital status - Separated (%)
Marital status - Widowed (%)
Marital status - Divorced (%)
Ancestries Reported - Arab (%)
Ancestries Reported - Czech (%)
Ancestries Reported - Danish (%)
Ancestries Reported - Dutch (%)
Ancestries Reported - English (%)
Ancestries Reported - French (%)
Ancestries Reported - French Canadian (%)
Ancestries Reported - German (%)
Ancestries Reported - Greek (%)
Ancestries Reported - Hungarian (%)
Ancestries Reported - Irish (%)
Ancestries Reported - Italian (%)
Ancestries Reported - Lithuanian (%)
Ancestries Reported - Norwegian (%)
Ancestries Reported - Polish (%)
Ancestries Reported - Portuguese (%)
Ancestries Reported - Russian (%)
Ancestries Reported - Scotch-Irish (%)
Ancestries Reported - Scottish (%)
Ancestries Reported - Slovak (%)
Ancestries Reported - Subsaharan African (%)
Ancestries Reported - Swedish (%)
Ancestries Reported - Swiss (%)
Ancestries Reported - Ukrainian (%)
Ancestries Reported - United States (%)
Ancestries Reported - Welsh (%)
Ancestries Reported - West Indian (%)
Ancestries Reported - Other (%)
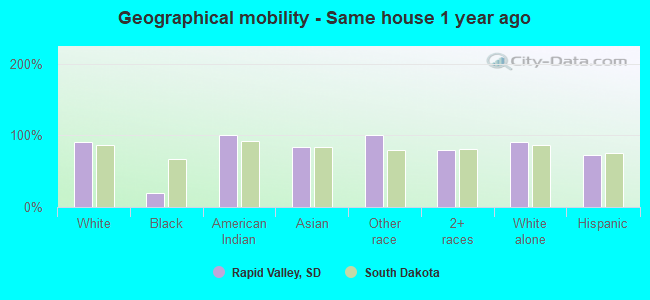
Geographical mobility - Same house 1 year ago (%)
Geographical mobility - Same house 1 year ago (%) - White
Geographical mobility - Same house 1 year ago (%) - Black or African American
Geographical mobility - Same house 1 year ago (%) - Asian
Geographical mobility - Same house 1 year ago (%) - Hispanic or Latino
Geographical mobility - Same house 1 year ago (%) - American Indian and Alaska Native
Geographical mobility - Same house 1 year ago (%) - Multirace
Geographical mobility - Same house 1 year ago (%) - Other Race
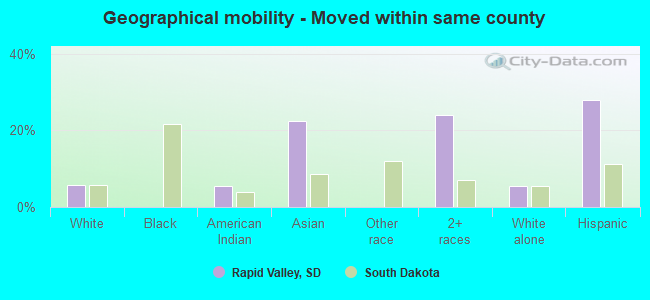
Geographical mobility - Moved within same county (%)
Geographical mobility - Moved within same county (%) - White
Geographical mobility - Moved within same county (%) - Black or African American
Geographical mobility - Moved within same county (%) - Asian
Geographical mobility - Moved within same county (%) - Hispanic or Latino
Geographical mobility - Moved within same county (%) - American Indian and Alaska Native
Geographical mobility - Moved within same county (%) - Multirace
Geographical mobility - Moved within same county (%) - Other Race
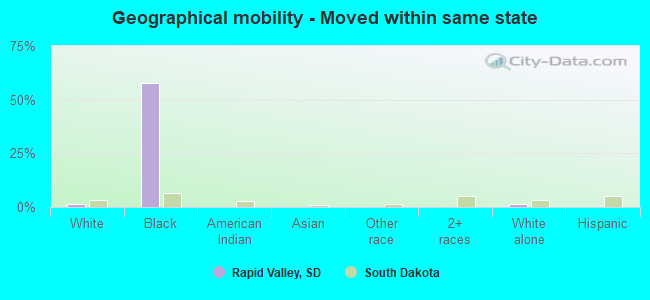
Geographical mobility - Moved from different county within same state (%)
Geographical mobility - Moved from different county within same state (%) - White
Geographical mobility - Moved from different county within same state (%) - Black or African American
Geographical mobility - Moved from different county within same state (%) - Asian
Geographical mobility - Moved from different county within same state (%) - Hispanic or Latino
Geographical mobility - Moved from different county within same state (%) - American Indian and Alaska Native
Geographical mobility - Moved from different county within same state (%) - Multirace
Geographical mobility - Moved from different county within same state (%) - Other Race
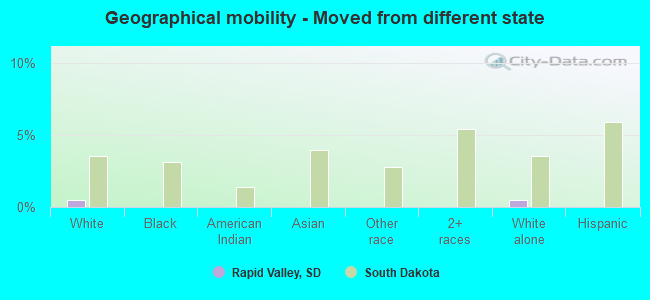
Geographical mobility - Moved from different state (%)
Geographical mobility - Moved from different state (%) - White
Geographical mobility - Moved from different state (%) - Black or African American
Geographical mobility - Moved from different state (%) - Asian
Geographical mobility - Moved from different state (%) - Hispanic or Latino
Geographical mobility - Moved from different state (%) - American Indian and Alaska Native
Geographical mobility - Moved from different state (%) - Multirace
Geographical mobility - Moved from different state (%) - Other Race
Geographical mobility - Moved from abroad (%)
Geographical mobility - Moved from abroad (%) - White
Geographical mobility - Moved from abroad (%) - Black or African American
Geographical mobility - Moved from abroad (%) - Asian
Geographical mobility - Moved from abroad (%) - Hispanic or Latino
Geographical mobility - Moved from abroad (%) - American Indian and Alaska Native
Geographical mobility - Moved from abroad (%) - Multirace
Geographical mobility - Moved from abroad (%) - Other Race
Place of birth for the foreign-born population - Ireland (%)
Place of birth for the foreign-born population - Denmark (%)
Place of birth for the foreign-born population - Norway (%)
Place of birth for the foreign-born population - Sweden (%)
Place of birth for the foreign-born population - United Kingdom (%)
Place of birth for the foreign-born population - England (%)
Place of birth for the foreign-born population - Scotland (%)
Place of birth for the foreign-born population - Other Northern Europe (%)
Place of birth for the foreign-born population - Austria (%)
Place of birth for the foreign-born population - Belgium (%)
Place of birth for the foreign-born population - France (%)
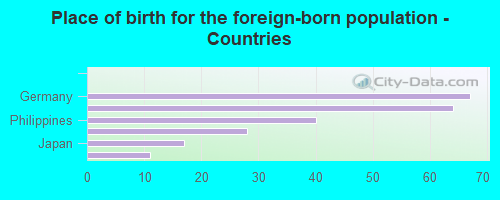
Place of birth for the foreign-born population - Germany (%)
Place of birth for the foreign-born population - Netherlands (%)
Place of birth for the foreign-born population - Switzerland (%)
Place of birth for the foreign-born population - Other Western Europe (%)
Place of birth for the foreign-born population - Greece (%)
Place of birth for the foreign-born population - Italy (%)
Place of birth for the foreign-born population - Portugal (%)
Place of birth for the foreign-born population - Spain (%)
Place of birth for the foreign-born population - Other Southern Europe (%)
Place of birth for the foreign-born population - Albania (%)
Place of birth for the foreign-born population - Belarus (%)
Place of birth for the foreign-born population - Bosnia and Herzegovina (%)
Place of birth for the foreign-born population - Bulgaria (%)
Place of birth for the foreign-born population - Croatia (%)
Place of birth for the foreign-born population - Czechoslovakia (%)
Place of birth for the foreign-born population - Hungary (%)
Place of birth for the foreign-born population - Latvia (%)
Place of birth for the foreign-born population - Lithuania (%)
Place of birth for the foreign-born population - North Macedonia (Macedonia) (%)
Place of birth for the foreign-born population - Moldova (%)
Place of birth for the foreign-born population - Poland (%)
Place of birth for the foreign-born population - Romania (%)
Place of birth for the foreign-born population - Russia (%)
Place of birth for the foreign-born population - Serbia (%)
Place of birth for the foreign-born population - Ukraine (%)
Place of birth for the foreign-born population - Other Eastern Europe (%)
Place of birth for the foreign-born population - China (%)
Place of birth for the foreign-born population - Hong Kong (%)
Place of birth for the foreign-born population - Taiwan (%)
Place of birth for the foreign-born population - Japan (%)
Place of birth for the foreign-born population - Korea (%)
Place of birth for the foreign-born population - Other Eastern Asia (%)
Place of birth for the foreign-born population - Afghanistan (%)
Place of birth for the foreign-born population - Bangladesh (%)
Place of birth for the foreign-born population - India (%)
Place of birth for the foreign-born population - Iran (%)
Place of birth for the foreign-born population - Kazakhstan (%)
Place of birth for the foreign-born population - Nepal (%)
Place of birth for the foreign-born population - Pakistan (%)
Place of birth for the foreign-born population - Sri Lanka (%)
Place of birth for the foreign-born population - Uzbekistan (%)
Place of birth for the foreign-born population - Other South Central Asia (%)
Place of birth for the foreign-born population - Burma (%)
Place of birth for the foreign-born population - Cambodia (%)
Place of birth for the foreign-born population - Indonesia (%)
Place of birth for the foreign-born population - Laos (%)
Place of birth for the foreign-born population - Malaysia (%)
Place of birth for the foreign-born population - Philippines (%)
Place of birth for the foreign-born population - Singapore (%)
Place of birth for the foreign-born population - Thailand (%)
Place of birth for the foreign-born population - Vietnam (%)
Place of birth for the foreign-born population - Other South Eastern Asia (%)
Place of birth for the foreign-born population - Armenia (%)
Place of birth for the foreign-born population - Iraq (%)
Place of birth for the foreign-born population - Israel (%)
Place of birth for the foreign-born population - Jordan (%)
Place of birth for the foreign-born population - Kuwait (%)
Place of birth for the foreign-born population - Lebanon (%)
Place of birth for the foreign-born population - Saudi Arabia (%)
Place of birth for the foreign-born population - Syria (%)
Place of birth for the foreign-born population - Turkey (%)
Place of birth for the foreign-born population - Yemen (%)
Place of birth for the foreign-born population - Other Western Asia (%)
Place of birth for the foreign-born population - Eritrea (%)
Place of birth for the foreign-born population - Ethiopia (%)
Place of birth for the foreign-born population - Kenya (%)
Place of birth for the foreign-born population - Somalia (%)
Place of birth for the foreign-born population - Uganda (%)
Place of birth for the foreign-born population - Zimbabwe (%)
Place of birth for the foreign-born population - Other Eastern Africa (%)
Place of birth for the foreign-born population - Cameroon (%)
Place of birth for the foreign-born population - Congo (%)
Place of birth for the foreign-born population - Democratic Republic of Congo (Zaire) (%)
Place of birth for the foreign-born population - Other Middle Africa (%)
Place of birth for the foreign-born population - Egypt (%)
Place of birth for the foreign-born population - Morocco (%)
Place of birth for the foreign-born population - Sudan (%)
Place of birth for the foreign-born population - Other Northern Africa (%)
Place of birth for the foreign-born population - South Africa (%)
Place of birth for the foreign-born population - Other Southern Africa (%)
Place of birth for the foreign-born population - Cabo Verde (%)
Place of birth for the foreign-born population - Ghana (%)
Place of birth for the foreign-born population - Liberia (%)
Place of birth for the foreign-born population - Nigeria (%)
Place of birth for the foreign-born population - Senegal (%)
Place of birth for the foreign-born population - Sierra Leone (%)
Place of birth for the foreign-born population - Other Western Africa (%)
Place of birth for the foreign-born population - Australia (%)
Place of birth for the foreign-born population - New Zealand (%)
Place of birth for the foreign-born population - Fiji (%)
Place of birth for the foreign-born population - Micronesia (%)
Place of birth for the foreign-born population - Bahamas (%)
Place of birth for the foreign-born population - Barbados (%)
Place of birth for the foreign-born population - Cuba (%)
Place of birth for the foreign-born population - Dominica (%)
Place of birth for the foreign-born population - Dominican Republic (%)
Place of birth for the foreign-born population - Grenada (%)
Place of birth for the foreign-born population - Haiti (%)
Place of birth for the foreign-born population - Jamaica (%)
Place of birth for the foreign-born population - St. Vincent and the Grenadines (%)
Place of birth for the foreign-born population - Trinidad and Tobago (%)
Place of birth for the foreign-born population - West Indies (%)
Place of birth for the foreign-born population - Other Caribbean (%)
Place of birth for the foreign-born population - Belize (%)
Place of birth for the foreign-born population - Costa Rica (%)
Place of birth for the foreign-born population - El Salvador (%)
Place of birth for the foreign-born population - Guatemala (%)
Place of birth for the foreign-born population - Honduras (%)
Place of birth for the foreign-born population - Mexico (%)
Place of birth for the foreign-born population - Nicaragua (%)
Place of birth for the foreign-born population - Panama (%)
Place of birth for the foreign-born population - Other Central America (%)
Place of birth for the foreign-born population - Argentina (%)
Place of birth for the foreign-born population - Bolivia (%)
Place of birth for the foreign-born population - Brazil (%)
Place of birth for the foreign-born population - Chile (%)
Place of birth for the foreign-born population - Colombia (%)
Place of birth for the foreign-born population - Ecuador (%)
Place of birth for the foreign-born population - Guyana (%)
Place of birth for the foreign-born population - Peru (%)
Place of birth for the foreign-born population - Uruguay (%)
Place of birth for the foreign-born population - Venezuela (%)
Place of birth for the foreign-born population - Other South America (%)
Place of birth for the foreign-born population - Canada (%)
Place of birth for the foreign-born population - Other Northern America (%)
Place of birth for the foreign-born population - Other (%)
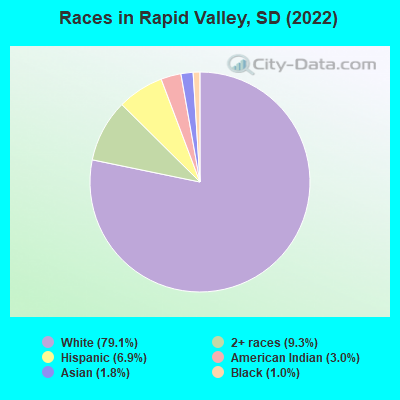
According to 2022 data, the most numerous races in Rapid Valley, SD are White alone (6,006 residents), American Indian alone (230 residents), and Hispanic (522 residents). 94.4% of Rapid Valley residents speak English at home. 3.0% of Rapid Valley, SD residents are foreign-born (1.2% born in Asia, 1.0% born in Europe, 0.9% born in Africa), which is about the same as the foreign-born rate of 3.0% across the entire state of South Dakota.
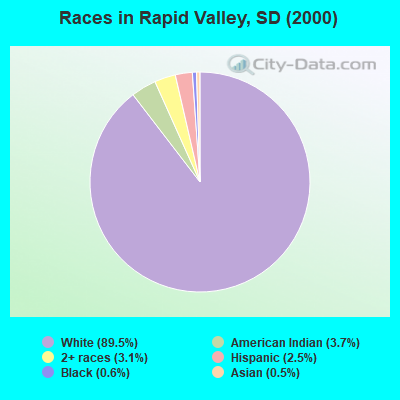
Race distribution in Rapid Valley
2000 2022
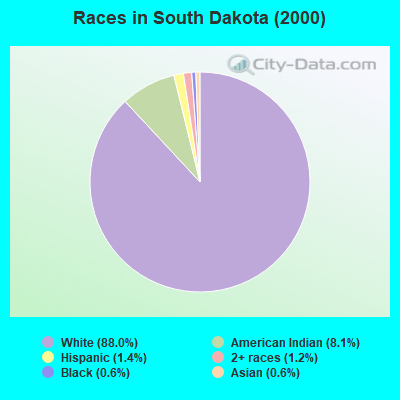
664,585 88.0% White alone 60,988 8.1% American Indian alone 10,903 1.4% Hispanic 8,960 1.2% Two or more races 4,563 0.6% Black alone 4,316 0.6% Asian alone 310 0.04% Other race alone 219 0.03% Native Hawaiian and Other
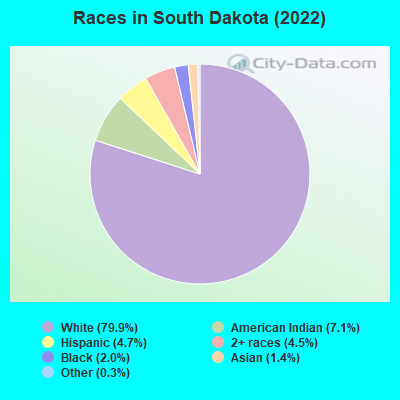
726,885 79.9% White alone 64,666 7.1% American Indian alone 42,430 4.7% Hispanic 40,984 4.5% Two or more races 18,053 2.0% Black alone 12,874 1.4% Asian alone 3,136 0.3% Other race alone 796 0.09% Native Hawaiian and Other
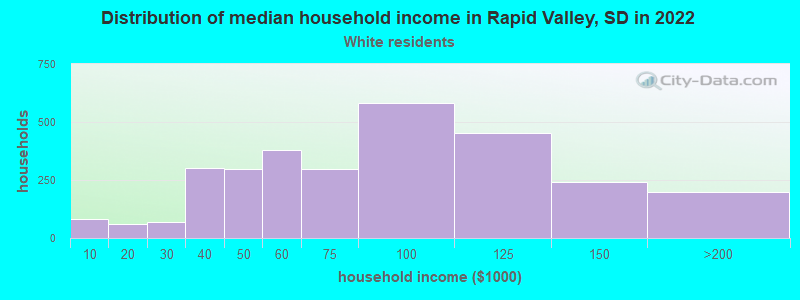
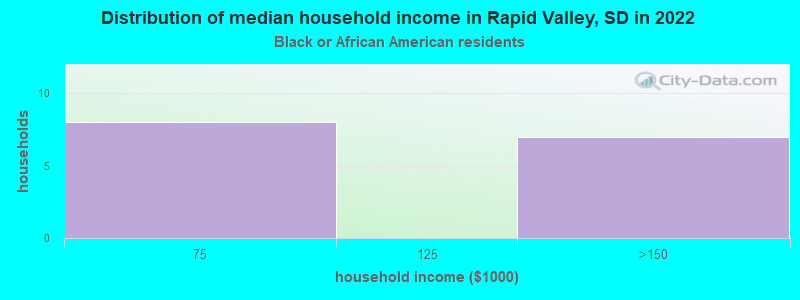
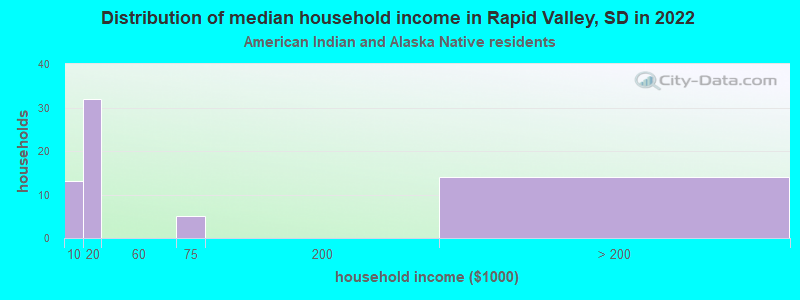
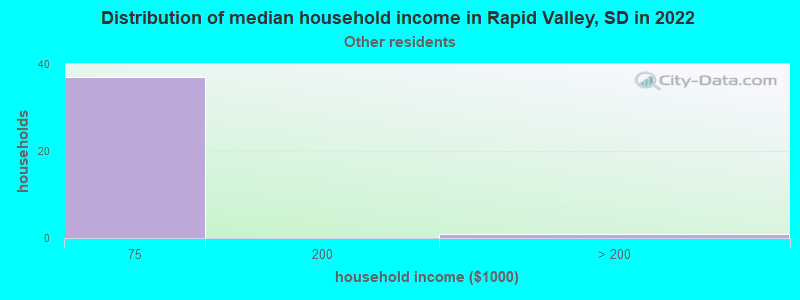
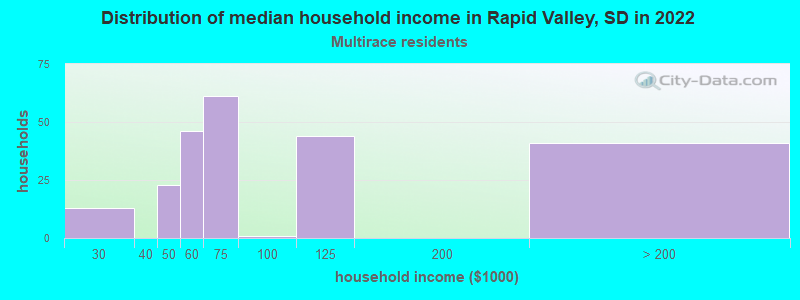
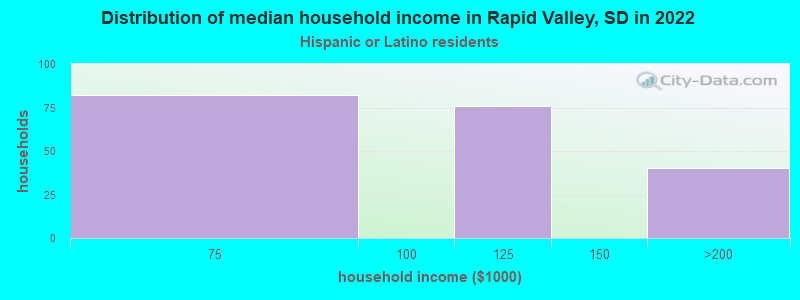
Income and house value in Rapid Valley Median household income in 2022 $76,953 White non-Hispanic householders$71,501 Two or more races householders$125,107 Hispanic or Latino race householdersMedian 2022 house value $249,805 White Non-Hispanic householders$244,170 Black or African American householders$229,458 American Indian or Alaska Native householders $297,387 Asian householders$219,127 Some other race householders$226,953 Two or more races householders$224,449 Hispanic or Latino householders
Median age by race in Rapid Valley
44.0 Median age for White residents41.9 45.2 10.8 Median age for Black or African American residents-875,555,554.7 -563,535,911.0 31.6 Median age for American Indian / Alaska Native residents25.1 45.5 41.5 Median age for Asian residents-538,386,782.7 56.1 -1,333,333,332.0 Median age for Native Hawaiian / Pacific Islander residents-1,038,202,246.2 -666,666,666.0 21.0 Median age for Other race residents22.9 -614,929,785.0 26.6 Median age for Two or more races residents56.2 21.9 44.4 Median age for White alone residents42.8 44.9 21.7 Median age for Hispanic or Latino residents24.4 -537,444,933.4
Owner/renter occupied households by race in Rapid Valley
House owners and renters - White residents 2,733 93.3% Owner occupied196 6.7% Renter occupiedHouse owners and renters - Black or African American residents 30 100.0% Owner occupiedHouse owners and renters - American Indian / Alaska Native residents 43 75.5% Owner occupied14 24.5% Renter occupiedHouse owners and renters - Other race residents 52 100.0% Owner occupiedHouse owners and renters - Two or more races residents 209 100.0% Owner occupiedHouse owners and renters - White alone residents 2,625 93.0% Owner occupied197 7.0% Renter occupiedHouse owners and renters - Hispanic or Latino residents 114 100.0% Owner occupied
Language usage in Rapid Valley
English speakers - Total 94.4% of residents of Rapid Valley speak English at home.
2.0% of residents speak Spanish at home 141 100.0% Speak English very well3.2% of residents speak other language at home 170 76.2% Speak English very well53 23.8% Speak English less than very well
English speakers - Born in the United States 97.8% of residents of Rapid Valley speak English at home.
0.7% of residents speak Spanish at home 21 100.0% Speak English very well1.4% of residents speak other language at home 42 100.0% Speak English very well
English speakers - Native, born elsewhere 96.5% of residents of Rapid Valley speak English at home.
English speakers - Foreign-born 46.7% of residents of Rapid Valley speak English at home.
43.3% of residents speak other language at home 48 52.7% Speak English very well43 47.3% Speak English less than very well
White (Caucasian) - Speak only English Native:
97.4% (5,532)Foreign-born:
8.6% (12)
White (Caucasian) - Speak another language Native:
2.8% (162)Foreign-born:
100.0% (142)
Black or African American - Speak only English Native:
100.0% (18)Foreign-born:
100.0% (36)
Asian - Speak only English Native:
91.5% (54)Foreign-born:
26.0% (21)
White alone - Speak only English Native:
97.7% (5,300)Foreign-born:
7.0% (10)
White alone - Speak another language Native:
2.8% (152)Foreign-born:
41.0% (61)
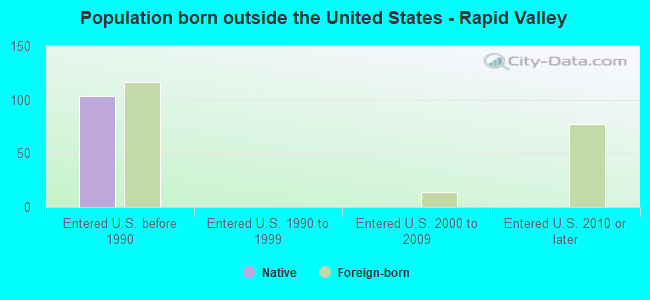
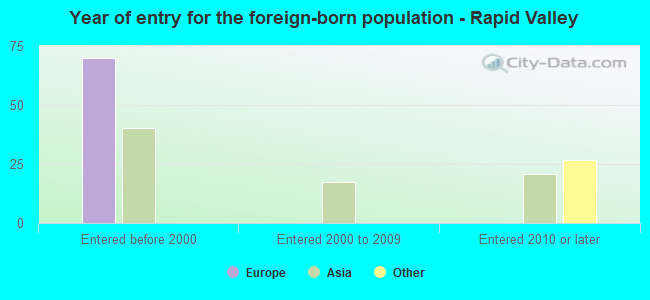
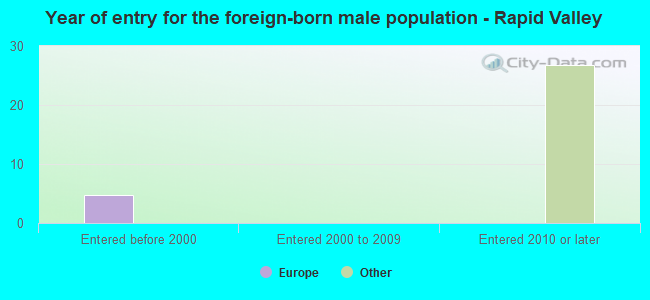
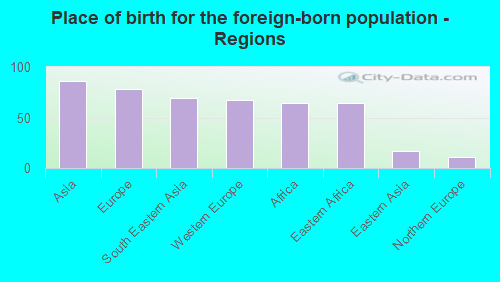
Foreign-born residents in Rapid Valley 229 residents are foreign born (1.2% Asia , 1.0% Europe , 0.9% Africa ).
This city:
3.0%South Dakota:
3.8%
Marital status for residents in Rapid Valley Marital status - White (Caucasian) population 15 years and over
Males 33.6% Never married53.6% Now married0.0% Separated1.9% Widowed10.9% DivorcedFemales 20.3% Never married57.0% Now married0.0% Separated6.0% Widowed16.7% DivorcedWomen who gave birth in the past 12 months Now married:
47.2% (25)Unmarried:
52.8% (28)
Women who did not give birth in the past 12 months Now married:
56.3% (618)Unmarried:
43.7% (480)
Marital status - Black or African American population 15 years and over
Males 0.0% Never married0.0% Now married0.0% Separated100.0% Widowed0.0% DivorcedFemales 0.0% Never married0.0% Now married0.0% Separated100.0% Widowed0.0% DivorcedMarital status - American Indian / Alaska Native population 15 years and over
Males 100.0% Never married0.0% Now married0.0% Separated0.0% Widowed0.0% DivorcedFemales 38.2% Never married24.4% Now married0.0% Separated3.3% Widowed34.1% DivorcedWomen who did not give birth in the past 12 months Now married:
21.8% (17)Unmarried:
78.2% (60)
Marital status - Two or more races population 15 years and over
Males 69.7% Never married30.3% Now married0.0% Separated0.0% Widowed0.0% DivorcedFemales 27.2% Never married65.6% Now married0.0% Separated7.2% Widowed0.0% DivorcedWomen who gave birth in the past 12 months Now married:
19.2% (6)Unmarried:
80.8% (24)
Women who did not give birth in the past 12 months Now married:
75.9% (102)Unmarried:
24.1% (32)
Marital status - White alone, not Hispanic / Latino population 15 years and over
Males 30.1% Never married56.6% Now married0.0% Separated2.0% Widowed11.2% DivorcedFemales 20.3% Never married57.0% Now married0.0% Separated6.0% Widowed16.7% DivorcedWomen who gave birth in the past 12 months Now married:
47.2% (25)Unmarried:
52.8% (28)
Women who did not give birth in the past 12 months Now married:
56.3% (622)Unmarried:
43.7% (483)
Marital status - Hispanic or Latino population 15 years and over
Males 70.2% Never married14.8% Now married0.0% Separated0.0% Widowed15.1% DivorcedFemales 100.0% Never married0.0% Now married0.0% Separated0.0% Widowed0.0% DivorcedWomen who gave birth in the past 12 months Now married:
0.0% (0)Unmarried:
100.0% (22)
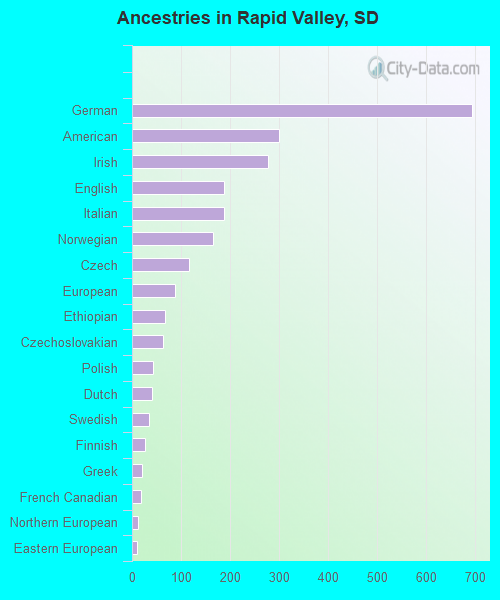
Ancestries in Rapid Valley
693 24.2% German299 10.4% American277 9.7% Irish188 6.6% English188 6.6% Italian165 5.8% Norwegian116 4.0% Czech87 3.0% European68 2.4% Ethiopian63 2.2% Czechoslovakian42 1.5% Polish41 1.4% Dutch34 1.2% Swedish27 0.9% Finnish21 0.7% Greek18 0.6% French Canadian12 0.4% Northern European11 0.4% Eastern European
Children Nativity (place of birth) in Rapid Valley
Children under 6 years - Living with two parents Both parents native 267 100.0% NativeChildren under 6 years - Living with one parent Native parent 313 100.0% NativeChildren 6 to 17 years - Living with two parents Both parents native 465 100.0% NativeOne native, one foreign-born parent 88 100.0% NativeChildren 6 to 17 years - Living with one parent Native parent 242 77.6% Native70 22.4% Foreign-born