Races in Raymore, Missouri (MO) Detailed Stats
Data:
Races - White alone (%)
Races - White alone (% change since 2000)
Races - Black alone (%)
Races - Black alone (% change since 2000)
Races - American Indian alone (%)
Races - American Indian alone (% change since 2000)
Races - Asian alone (%)
Races - Asian alone (% change since 2000)
Races - Hispanic (%)
Races - Hispanic (% change since 2000)
Races - Native Hawaiian and Other Pacific Islander alone (%)
Races - Native Hawaiian and Other Pacific Islander alone (% change since 2000)
Races - Two or more races(%)
Races - Two or more races(% change since 2000)
Races - Other race alone (%)
Races - Other race alone (% change since 2000)
Racial diversity
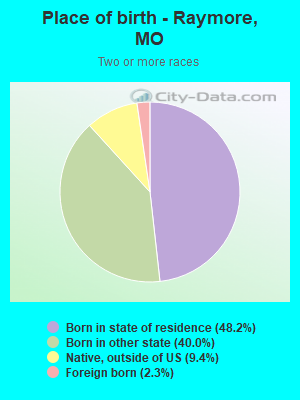
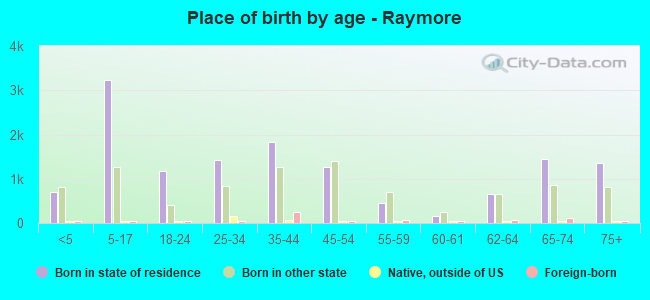
Place of birth - Born in state of residence (%)
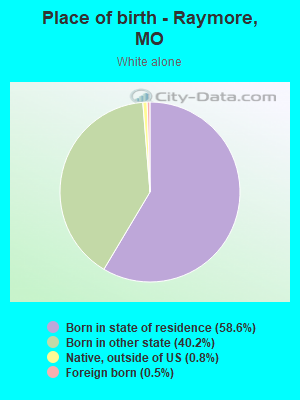
Place of birth - Born in state of residence (%) - White
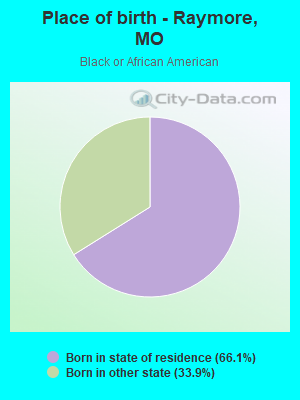
Place of birth - Born in state of residence (%) - Black or African American
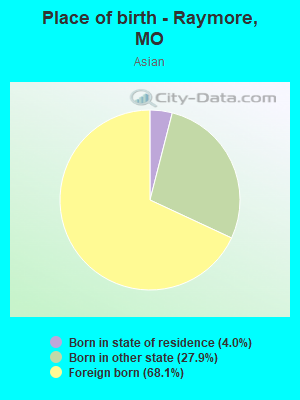
Place of birth - Born in state of residence (%) - Asian
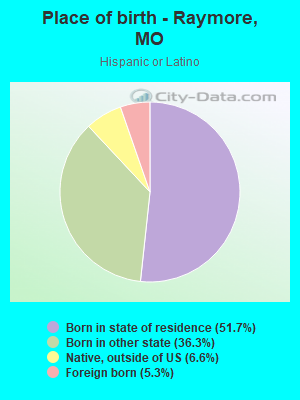
Place of birth - Born in state of residence (%) - Hispanic or Latino
Place of birth - Born in state of residence (%) - American Indian and Alaska Native
Place of birth - Born in state of residence (%) - Multirace
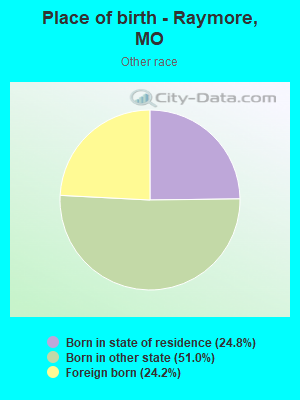
Place of birth - Born in state of residence (%) - Other Race
Place of birth - Born in other state (%)
Place of birth - Born in other state (%) - White
Place of birth - Born in other state (%) - Black or African American
Place of birth - Born in other state (%) - Asian
Place of birth - Born in other state (%) - Hispanic or Latino
Place of birth - Born in other state (%) - American Indian and Alaska Native
Place of birth - Born in other state (%) - Multirace
Place of birth - Born in other state (%) - Other Race
Place of birth - Native, outside of US (%)
Place of birth - Native, outside of US (%) - White
Place of birth - Native, outside of US (%) - Black or African American
Place of birth - Native, outside of US (%) - Asian
Place of birth - Native, outside of US (%) - Hispanic or Latino
Place of birth - Native, outside of US (%) - American Indian and Alaska Native
Place of birth - Native, outside of US (%) - Multirace
Place of birth - Native, outside of US (%) - Other Race
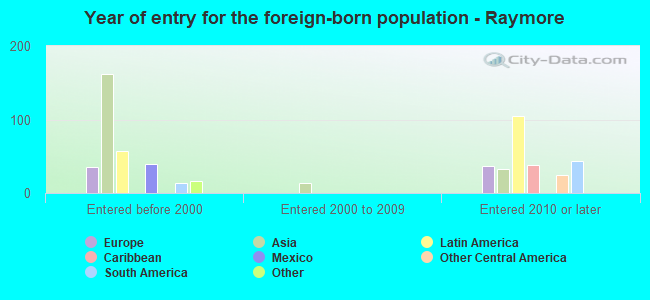
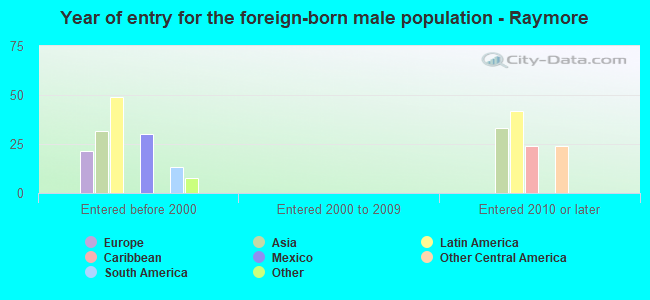
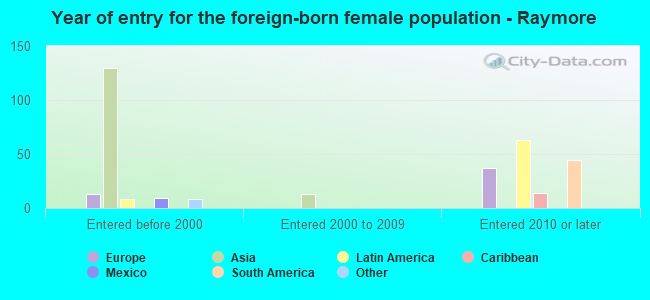
Place of birth - Foreign born (%)
Place of birth - Foreign born (%) - White
Place of birth - Foreign born (%) - Black or African American
Place of birth - Foreign born (%) - Asian
Place of birth - Foreign born (%) - Hispanic or Latino
Place of birth - Foreign born (%) - American Indian and Alaska Native
Place of birth - Foreign born (%) - Multirace
Place of birth - Foreign born (%) - Other Race
Residents speaking English at home (%)
Residents speaking English at home - Born in the United States (%)
Residents speaking English at home - Native, born elsewhere (%)
Residents speaking English at home - Foreign born (%)
Residents speaking Spanish at home (%)
Residents speaking Spanish at home - Born in the United States (%)
Residents speaking Spanish at home - Native, born elsewhere (%)
Residents speaking Spanish at home - Foreign born (%)
Residents speaking other language at home (%)
Residents speaking other language at home - Born in the United States (%)
Residents speaking other language at home - Native, born elsewhere (%)
Residents speaking other language at home - Foreign born (%)
Marital status - Never married (%)
Marital status - Now married (%)
Marital status - Separated (%)
Marital status - Widowed (%)
Marital status - Divorced (%)
Ancestries Reported - Arab (%)
Ancestries Reported - Czech (%)
Ancestries Reported - Danish (%)
Ancestries Reported - Dutch (%)
Ancestries Reported - English (%)
Ancestries Reported - French (%)
Ancestries Reported - French Canadian (%)
Ancestries Reported - German (%)
Ancestries Reported - Greek (%)
Ancestries Reported - Hungarian (%)
Ancestries Reported - Irish (%)
Ancestries Reported - Italian (%)
Ancestries Reported - Lithuanian (%)
Ancestries Reported - Norwegian (%)
Ancestries Reported - Polish (%)
Ancestries Reported - Portuguese (%)
Ancestries Reported - Russian (%)
Ancestries Reported - Scotch-Irish (%)
Ancestries Reported - Scottish (%)
Ancestries Reported - Slovak (%)
Ancestries Reported - Subsaharan African (%)
Ancestries Reported - Swedish (%)
Ancestries Reported - Swiss (%)
Ancestries Reported - Ukrainian (%)
Ancestries Reported - United States (%)
Ancestries Reported - Welsh (%)
Ancestries Reported - West Indian (%)
Ancestries Reported - Other (%)
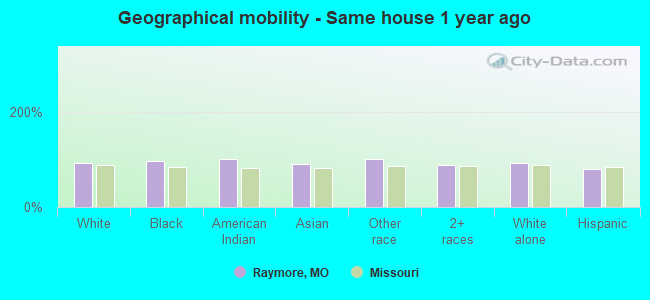
Geographical mobility - Same house 1 year ago (%)
Geographical mobility - Same house 1 year ago (%) - White
Geographical mobility - Same house 1 year ago (%) - Black or African American
Geographical mobility - Same house 1 year ago (%) - Asian
Geographical mobility - Same house 1 year ago (%) - Hispanic or Latino
Geographical mobility - Same house 1 year ago (%) - American Indian and Alaska Native
Geographical mobility - Same house 1 year ago (%) - Multirace
Geographical mobility - Same house 1 year ago (%) - Other Race
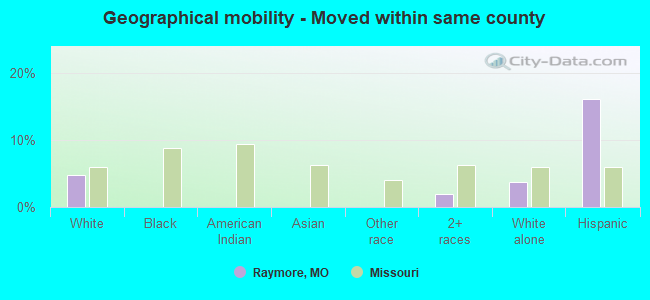
Geographical mobility - Moved within same county (%)
Geographical mobility - Moved within same county (%) - White
Geographical mobility - Moved within same county (%) - Black or African American
Geographical mobility - Moved within same county (%) - Asian
Geographical mobility - Moved within same county (%) - Hispanic or Latino
Geographical mobility - Moved within same county (%) - American Indian and Alaska Native
Geographical mobility - Moved within same county (%) - Multirace
Geographical mobility - Moved within same county (%) - Other Race
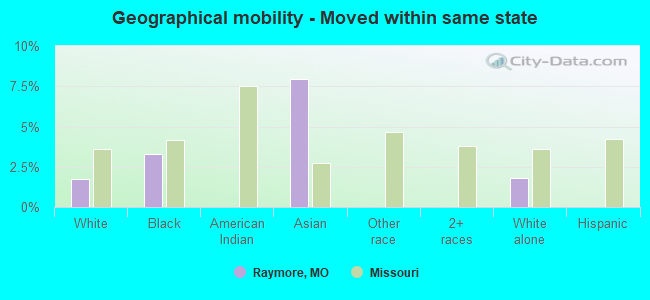
Geographical mobility - Moved from different county within same state (%)
Geographical mobility - Moved from different county within same state (%) - White
Geographical mobility - Moved from different county within same state (%) - Black or African American
Geographical mobility - Moved from different county within same state (%) - Asian
Geographical mobility - Moved from different county within same state (%) - Hispanic or Latino
Geographical mobility - Moved from different county within same state (%) - American Indian and Alaska Native
Geographical mobility - Moved from different county within same state (%) - Multirace
Geographical mobility - Moved from different county within same state (%) - Other Race
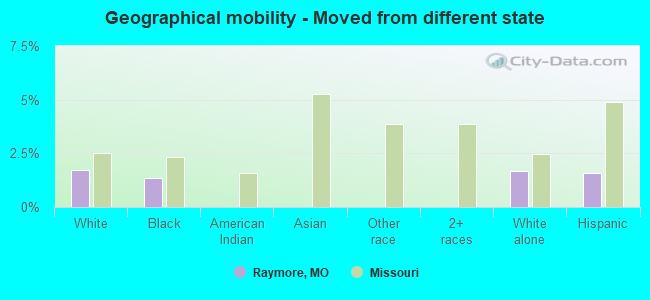
Geographical mobility - Moved from different state (%)
Geographical mobility - Moved from different state (%) - White
Geographical mobility - Moved from different state (%) - Black or African American
Geographical mobility - Moved from different state (%) - Asian
Geographical mobility - Moved from different state (%) - Hispanic or Latino
Geographical mobility - Moved from different state (%) - American Indian and Alaska Native
Geographical mobility - Moved from different state (%) - Multirace
Geographical mobility - Moved from different state (%) - Other Race
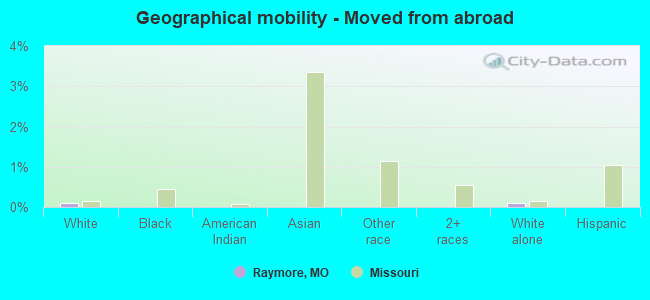
Geographical mobility - Moved from abroad (%)
Geographical mobility - Moved from abroad (%) - White
Geographical mobility - Moved from abroad (%) - Black or African American
Geographical mobility - Moved from abroad (%) - Asian
Geographical mobility - Moved from abroad (%) - Hispanic or Latino
Geographical mobility - Moved from abroad (%) - American Indian and Alaska Native
Geographical mobility - Moved from abroad (%) - Multirace
Geographical mobility - Moved from abroad (%) - Other Race
Place of birth for the foreign-born population - Ireland (%)
Place of birth for the foreign-born population - Denmark (%)
Place of birth for the foreign-born population - Norway (%)
Place of birth for the foreign-born population - Sweden (%)
Place of birth for the foreign-born population - United Kingdom (%)
Place of birth for the foreign-born population - England (%)
Place of birth for the foreign-born population - Scotland (%)
Place of birth for the foreign-born population - Other Northern Europe (%)
Place of birth for the foreign-born population - Austria (%)
Place of birth for the foreign-born population - Belgium (%)
Place of birth for the foreign-born population - France (%)
Place of birth for the foreign-born population - Germany (%)
Place of birth for the foreign-born population - Netherlands (%)
Place of birth for the foreign-born population - Switzerland (%)
Place of birth for the foreign-born population - Other Western Europe (%)
Place of birth for the foreign-born population - Greece (%)
Place of birth for the foreign-born population - Italy (%)
Place of birth for the foreign-born population - Portugal (%)
Place of birth for the foreign-born population - Spain (%)
Place of birth for the foreign-born population - Other Southern Europe (%)
Place of birth for the foreign-born population - Albania (%)
Place of birth for the foreign-born population - Belarus (%)
Place of birth for the foreign-born population - Bosnia and Herzegovina (%)
Place of birth for the foreign-born population - Bulgaria (%)
Place of birth for the foreign-born population - Croatia (%)
Place of birth for the foreign-born population - Czechoslovakia (%)
Place of birth for the foreign-born population - Hungary (%)
Place of birth for the foreign-born population - Latvia (%)
Place of birth for the foreign-born population - Lithuania (%)
Place of birth for the foreign-born population - North Macedonia (Macedonia) (%)
Place of birth for the foreign-born population - Moldova (%)
Place of birth for the foreign-born population - Poland (%)
Place of birth for the foreign-born population - Romania (%)
Place of birth for the foreign-born population - Russia (%)
Place of birth for the foreign-born population - Serbia (%)
Place of birth for the foreign-born population - Ukraine (%)
Place of birth for the foreign-born population - Other Eastern Europe (%)
Place of birth for the foreign-born population - China (%)
Place of birth for the foreign-born population - Hong Kong (%)
Place of birth for the foreign-born population - Taiwan (%)
Place of birth for the foreign-born population - Japan (%)
Place of birth for the foreign-born population - Korea (%)
Place of birth for the foreign-born population - Other Eastern Asia (%)
Place of birth for the foreign-born population - Afghanistan (%)
Place of birth for the foreign-born population - Bangladesh (%)
Place of birth for the foreign-born population - India (%)
Place of birth for the foreign-born population - Iran (%)
Place of birth for the foreign-born population - Kazakhstan (%)
Place of birth for the foreign-born population - Nepal (%)
Place of birth for the foreign-born population - Pakistan (%)
Place of birth for the foreign-born population - Sri Lanka (%)
Place of birth for the foreign-born population - Uzbekistan (%)
Place of birth for the foreign-born population - Other South Central Asia (%)
Place of birth for the foreign-born population - Burma (%)
Place of birth for the foreign-born population - Cambodia (%)
Place of birth for the foreign-born population - Indonesia (%)
Place of birth for the foreign-born population - Laos (%)
Place of birth for the foreign-born population - Malaysia (%)
Place of birth for the foreign-born population - Philippines (%)
Place of birth for the foreign-born population - Singapore (%)
Place of birth for the foreign-born population - Thailand (%)
Place of birth for the foreign-born population - Vietnam (%)
Place of birth for the foreign-born population - Other South Eastern Asia (%)
Place of birth for the foreign-born population - Armenia (%)
Place of birth for the foreign-born population - Iraq (%)
Place of birth for the foreign-born population - Israel (%)
Place of birth for the foreign-born population - Jordan (%)
Place of birth for the foreign-born population - Kuwait (%)
Place of birth for the foreign-born population - Lebanon (%)
Place of birth for the foreign-born population - Saudi Arabia (%)
Place of birth for the foreign-born population - Syria (%)
Place of birth for the foreign-born population - Turkey (%)
Place of birth for the foreign-born population - Yemen (%)
Place of birth for the foreign-born population - Other Western Asia (%)
Place of birth for the foreign-born population - Eritrea (%)
Place of birth for the foreign-born population - Ethiopia (%)
Place of birth for the foreign-born population - Kenya (%)
Place of birth for the foreign-born population - Somalia (%)
Place of birth for the foreign-born population - Uganda (%)
Place of birth for the foreign-born population - Zimbabwe (%)
Place of birth for the foreign-born population - Other Eastern Africa (%)
Place of birth for the foreign-born population - Cameroon (%)
Place of birth for the foreign-born population - Congo (%)
Place of birth for the foreign-born population - Democratic Republic of Congo (Zaire) (%)
Place of birth for the foreign-born population - Other Middle Africa (%)
Place of birth for the foreign-born population - Egypt (%)
Place of birth for the foreign-born population - Morocco (%)
Place of birth for the foreign-born population - Sudan (%)
Place of birth for the foreign-born population - Other Northern Africa (%)
Place of birth for the foreign-born population - South Africa (%)
Place of birth for the foreign-born population - Other Southern Africa (%)
Place of birth for the foreign-born population - Cabo Verde (%)
Place of birth for the foreign-born population - Ghana (%)
Place of birth for the foreign-born population - Liberia (%)
Place of birth for the foreign-born population - Nigeria (%)
Place of birth for the foreign-born population - Senegal (%)
Place of birth for the foreign-born population - Sierra Leone (%)
Place of birth for the foreign-born population - Other Western Africa (%)
Place of birth for the foreign-born population - Australia (%)
Place of birth for the foreign-born population - New Zealand (%)
Place of birth for the foreign-born population - Fiji (%)
Place of birth for the foreign-born population - Micronesia (%)
Place of birth for the foreign-born population - Bahamas (%)
Place of birth for the foreign-born population - Barbados (%)
Place of birth for the foreign-born population - Cuba (%)
Place of birth for the foreign-born population - Dominica (%)
Place of birth for the foreign-born population - Dominican Republic (%)
Place of birth for the foreign-born population - Grenada (%)
Place of birth for the foreign-born population - Haiti (%)
Place of birth for the foreign-born population - Jamaica (%)
Place of birth for the foreign-born population - St. Vincent and the Grenadines (%)
Place of birth for the foreign-born population - Trinidad and Tobago (%)
Place of birth for the foreign-born population - West Indies (%)
Place of birth for the foreign-born population - Other Caribbean (%)
Place of birth for the foreign-born population - Belize (%)
Place of birth for the foreign-born population - Costa Rica (%)
Place of birth for the foreign-born population - El Salvador (%)
Place of birth for the foreign-born population - Guatemala (%)
Place of birth for the foreign-born population - Honduras (%)
Place of birth for the foreign-born population - Mexico (%)
Place of birth for the foreign-born population - Nicaragua (%)
Place of birth for the foreign-born population - Panama (%)
Place of birth for the foreign-born population - Other Central America (%)
Place of birth for the foreign-born population - Argentina (%)
Place of birth for the foreign-born population - Bolivia (%)
Place of birth for the foreign-born population - Brazil (%)
Place of birth for the foreign-born population - Chile (%)
Place of birth for the foreign-born population - Colombia (%)
Place of birth for the foreign-born population - Ecuador (%)
Place of birth for the foreign-born population - Guyana (%)
Place of birth for the foreign-born population - Peru (%)
Place of birth for the foreign-born population - Uruguay (%)
Place of birth for the foreign-born population - Venezuela (%)
Place of birth for the foreign-born population - Other South America (%)
Place of birth for the foreign-born population - Canada (%)
Place of birth for the foreign-born population - Other Northern America (%)
Place of birth for the foreign-born population - Other (%)
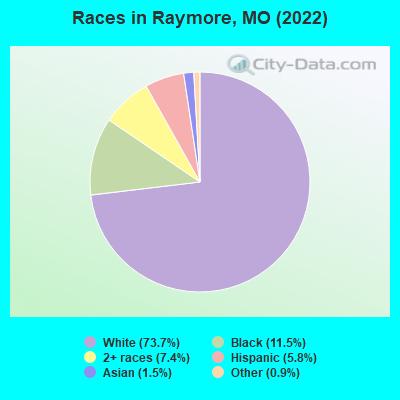
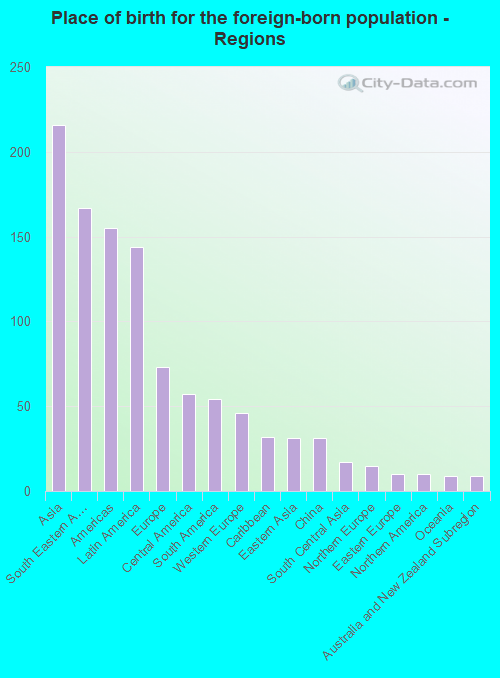
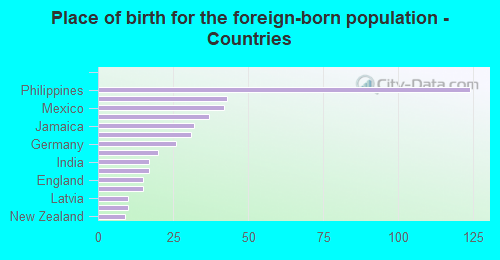
According to 2022 data, the most numerous races in Raymore, MO are White alone (17,465 residents), Black alone (2,723 residents), and Two or more races (1,758 residents). 96.9% of Raymore residents speak English at home. 1.9% of Raymore, MO residents are foreign-born , which is 108.8% less than the foreign-born rate of 4.0% across the entire state of Missouri.
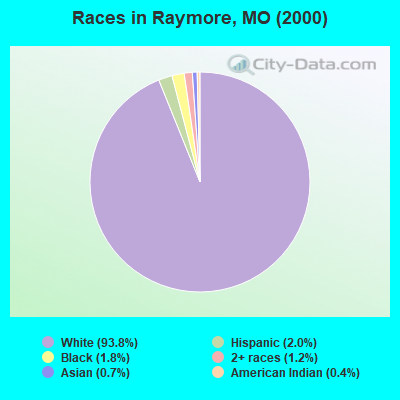
Race distribution in Raymore
2000 2022
4,686,474 83.8% White alone 625,667 11.2% Black alone 118,592 2.1% Hispanic 71,905 1.3% Two or more races 61,041 1.1% Asian alone 23,302 0.4% American Indian alone 5,291 0.09% Other race alone 2,939 0.05% Native Hawaiian and Other
4,733,411 76.6% White alone 656,739 10.6% Black alone 316,300 5.1% Two or more races 291,763 4.7% Hispanic 132,436 2.1% Asian alone 27,467 0.4% Other race alone 12,313 0.2% American Indian alone 7,528 0.1% Native Hawaiian and Other
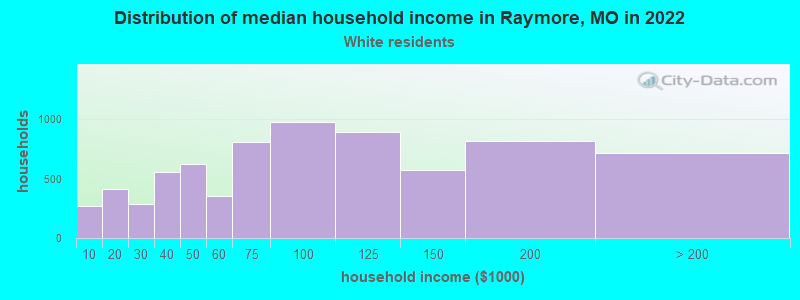
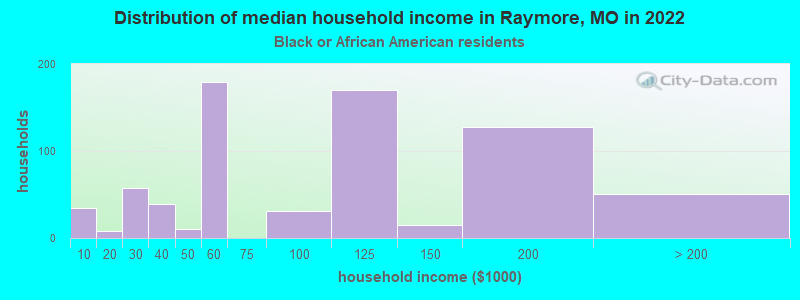
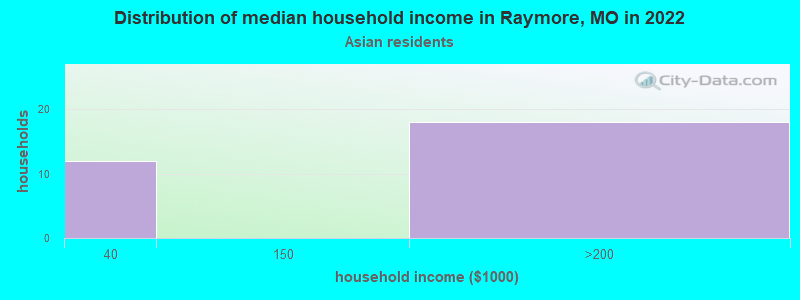
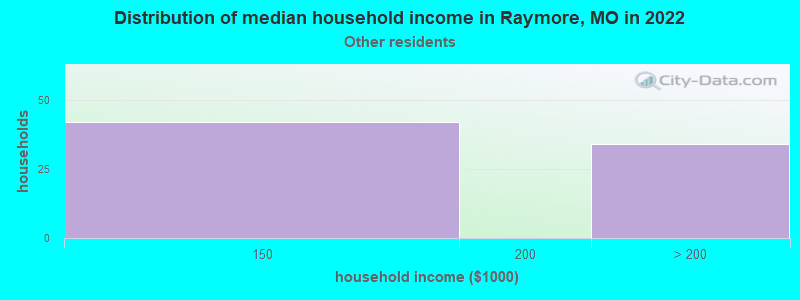
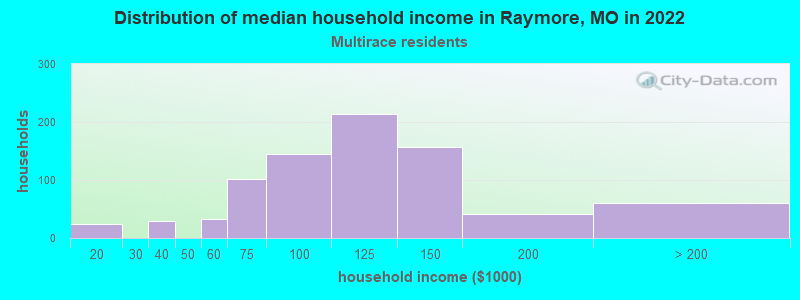
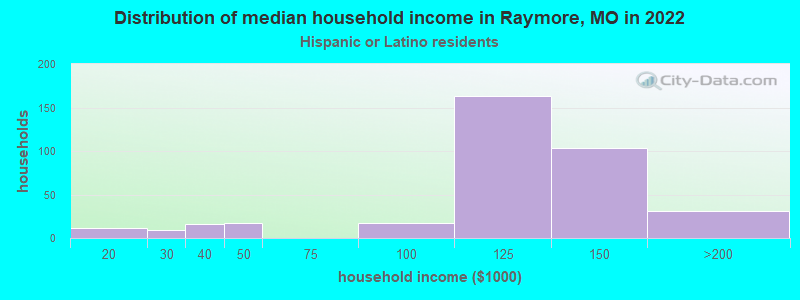
Income and house value in Raymore Median household income in 2022 $82,452 White non-Hispanic householders$100,679 Black householdersover $200,000 Some other race householders$105,098 Two or more races householders$108,963 Hispanic or Latino race householdersMedian 2022 house value $326,943 White Non-Hispanic householders$372,450 Black or African American householders$304,732 American Indian or Alaska Native householders $304,732 Asian householders$304,732 Some other race householders$366,761 Two or more races householders$321,797 Hispanic or Latino householders
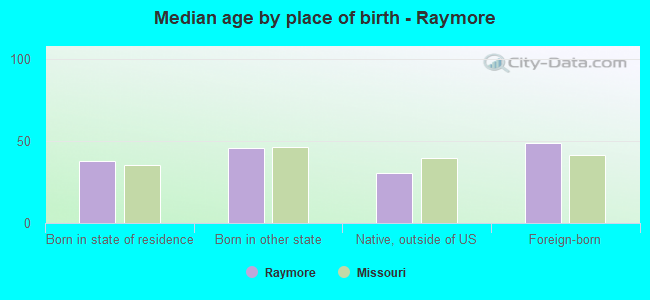
Median age by race in Raymore
43.8 Median age for White residents42.9 44.3 35.7 Median age for Black or African American residents34.1 48.8 -621,359,222.7 Median age for American Indian / Alaska Native residents-652,291,104.5 -729,166,665.9 53.2 Median age for Asian residents40.0 53.6 -958,592,131.5 Median age for Native Hawaiian / Pacific Islander residents-683,513,838.1 -752,136,751.4 31.3 Median age for Other race residents43.8 38.2 21.8 Median age for Two or more races residents23.8 16.7 43.7 Median age for White alone residents43.0 44.0 20.6 Median age for Hispanic or Latino residents20.8 21.2
Owner/renter occupied households by race in Raymore
House owners and renters - White residents 5,635 78.8% Owner occupied1,520 21.2% Renter occupiedHouse owners and renters - Black or African American residents 335 35.0% Owner occupied622 65.0% Renter occupiedHouse owners and renters - American Indian / Alaska Native residents 5 100.0% Owner occupiedHouse owners and renters - Asian residents 40 100.0% Owner occupiedHouse owners and renters - Other race residents 64 100.0% Owner occupiedHouse owners and renters - Two or more races residents 663 89.1% Owner occupied81 10.9% Renter occupiedHouse owners and renters - White alone residents 5,589 78.7% Owner occupied1,512 21.3% Renter occupiedHouse owners and renters - Hispanic or Latino residents 403 94.0% Owner occupied26 6.0% Renter occupied
Language usage in Raymore
English speakers - Total 96.9% of residents of Raymore speak English at home.
1.5% of residents speak Spanish at home 259 77.5% Speak English very well75 22.5% Speak English less than very well1.6% of residents speak other language at home 219 64.0% Speak English very well123 36.0% Speak English less than very well
English speakers - Born in the United States 96.5% of residents of Raymore speak English at home.
2.7% of residents speak Spanish at home 157 73.0% Speak English very well58 27.0% Speak English less than very well0.8% of residents speak other language at home 67 100.0% Speak English very well
English speakers - Native, born elsewhere 90.6% of residents of Raymore speak English at home.
7.7% of residents speak Spanish at home 27 100.0% Speak English very well
English speakers - Foreign-born 31.4% of residents of Raymore speak English at home.
19.3% of residents speak Spanish at home 63 71.6% Speak English very well25 28.4% Speak English less than very well48.1% of residents speak other language at home 96 43.8% Speak English very well123 56.2% Speak English less than very well
White (Caucasian) - Speak only English Native:
99.4% (16,500)Foreign-born:
57.0% (48)
White (Caucasian) - Speak another language Native:
0.6% (99)Foreign-born:
64.9% (55)
Asian - Speak only English Native:
69.7% (72)Foreign-born:
8.1% (18)
Asian - Speak another language Native:
32.4% (33)Foreign-born:
92.0% (204)
Other race - Speak only English Native:
100.0% (171)Foreign-born:
100.0% (56)
Two or more races - Speak only English Native:
92.1% (2,457)Foreign-born:
15.6% (25)
Two or more races - Speak another language Native:
7.6% (203)Foreign-born:
79.8% (130)
White alone - Speak only English Native:
99.4% (16,313)Foreign-born:
56.2% (49)
White alone - Speak another language Native:
0.6% (101)Foreign-born:
50.5% (44)
Hispanic or Latino - Speak only English Native:
89.8% (1,076)Foreign-born:
23.7% (28)
Hispanic or Latino - Speak another language Native:
11.6% (139)Foreign-born:
77.0% (90)
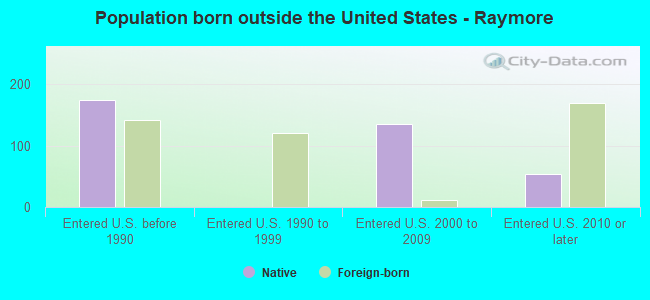
Foreign-born residents in Raymore 454 residents are foreign born
This city:
1.9%Missouri:
4.2%
Marital status for residents in Raymore Marital status - White (Caucasian) population 15 years and over
Males 22.7% Never married64.1% Now married1.0% Separated4.0% Widowed8.2% DivorcedFemales 17.0% Never married57.4% Now married1.3% Separated14.7% Widowed9.4% DivorcedWomen who gave birth in the past 12 months Now married:
100.0% (210)Unmarried:
0.0% (0)
Women who did not give birth in the past 12 months Now married:
58.9% (2,221)Unmarried:
41.1% (1,551)
Marital status - Black or African American population 15 years and over
Males 25.1% Never married57.6% Now married0.0% Separated3.3% Widowed14.0% DivorcedFemales 49.5% Never married43.3% Now married1.4% Separated0.0% Widowed5.8% DivorcedWomen who did not give birth in the past 12 months Now married:
37.7% (234)Unmarried:
62.3% (387)
Marital status - Asian population 15 years and over
Males 32.0% Never married68.0% Now married0.0% Separated0.0% Widowed0.0% DivorcedFemales 8.8% Never married66.3% Now married0.0% Separated3.4% Widowed21.5% DivorcedWomen who did not give birth in the past 12 months Now married:
56.1% (25)Unmarried:
43.9% (19)
Marital status - Other race population 15 years and over
Males 32.9% Never married67.1% Now married0.0% Separated0.0% Widowed0.0% DivorcedFemales 61.2% Never married38.8% Now married0.0% Separated0.0% Widowed0.0% DivorcedWomen who did not give birth in the past 12 months Now married:
14.9% (13)Unmarried:
85.1% (77)
Marital status - Two or more races population 15 years and over
Males 48.0% Never married42.4% Now married0.0% Separated0.0% Widowed9.6% DivorcedFemales 33.7% Never married60.0% Now married0.0% Separated0.0% Widowed6.2% DivorcedWomen who did not give birth in the past 12 months Now married:
44.0% (273)Unmarried:
56.0% (347)
Marital status - White alone, not Hispanic / Latino population 15 years and over
Males 21.9% Never married64.5% Now married1.1% Separated4.1% Widowed8.4% DivorcedFemales 16.5% Never married57.7% Now married1.2% Separated14.9% Widowed9.6% DivorcedWomen who gave birth in the past 12 months Now married:
100.0% (213)Unmarried:
0.0% (0)
Women who did not give birth in the past 12 months Now married:
59.3% (2,201)Unmarried:
40.7% (1,513)
Marital status - Hispanic or Latino population 15 years and over
Males 29.4% Never married56.6% Now married0.0% Separated0.0% Widowed14.1% DivorcedFemales 50.6% Never married40.9% Now married2.6% Separated0.0% Widowed5.9% DivorcedWomen who did not give birth in the past 12 months Now married:
39.2% (136)Unmarried:
60.8% (210)
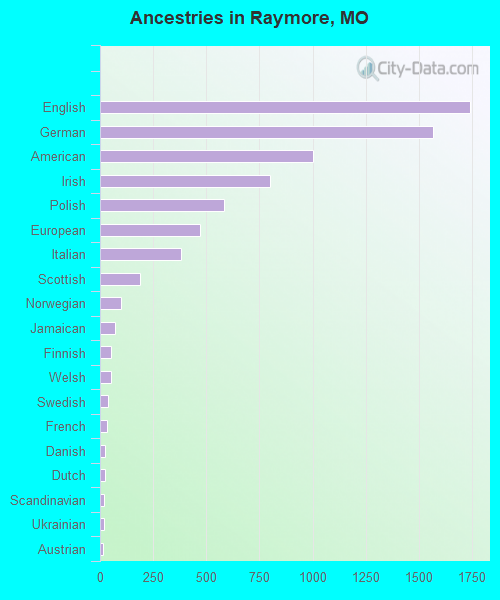
Ancestries in Raymore
1,743 17.6% English1,565 15.8% German1,004 10.1% American802 8.1% Irish585 5.9% Polish471 4.8% European380 3.8% Italian189 1.9% Scottish98 1.0% Norwegian70 0.7% Jamaican54 0.5% Finnish50 0.5% Welsh37 0.4% Swedish34 0.3% French24 0.2% Danish22 0.2% Dutch19 0.2% Scandinavian18 0.2% Ukrainian16 0.2% Austrian13 0.1% Egyptian12 0.1% Canadian10 0.1% Northern European10 0.1% Russian10 0.1% Slavic8 0.08% New Zealander5 0.05% British5 0.05% Czech5 0.05% Scotch-Irish
Geographical mobility in Raymore Same house 1 year ago 16,084 91.8% White (Caucasian)2,212 96.9% Black or African American5 100.0% American Indian / Alaska Native295 90.8% Asian227 100.0% Other race2,818 88.6% Two or more races16,110 92.8% White alone, not Hispanic / Latino1,064 79.5% Hispanic or LatinoMoved within same county 838 4.8% White / Caucasian59 1.9% Two or more races645 3.7% White alone, not Hispanic / Latino214 16.0% Hispanic or LatinoMoved within same state 307 1.8% White / Caucasian75 3.3% Black or African American26 8.0% Asian308 1.8% White alone, not Hispanic / LatinoMoved from different state 303 1.7% White / Caucasian30 1.3% Black or African American290 1.7% White alone, not Hispanic / Latino21 1.6% Hispanic or LatinoMoved from abroad 19 0.1% White19 0.1% White alone, not Hispanic / Latino
Children Nativity (place of birth) in Raymore
Children under 6 years - Living with two parents Both parents native 1,181 100.0% NativeChildren under 6 years - Living with one parent Native parent 387 100.0% NativeChildren 6 to 17 years - Living with two parents Both parents native 3,269 100.0% NativeBoth parents foreign-born 11 55.5% Native9 44.5% Foreign-bornOne native, one foreign-born parent 159 100.0% NativeChildren 6 to 17 years - Living with one parent Native parent 819 100.0% NativeForeign-born parent 48 51.6% Native45 48.4% Foreign-born
Grandparents responsible for own grandchildren in Raymore
Grandparents (30 to 59 years) White / Caucasian 48 30.6% Responsible for grandchildren108 69.4% Not responsible for grandchildrenTwo or more races 3 100.0% Not responsible for grandchildrenWhite alone, not Hispanic / Latino 48 30.3% Responsible for grandchildren110 69.7% Not responsible for grandchildrenGrandparents (60 years and over) White / Caucasian 25 19.6% Responsible for grandchildren100 80.4% Not responsible for grandchildrenTwo or more races 60 30.7% Responsible for grandchildren136 69.3% Not responsible for grandchildrenWhite alone, not Hispanic / Latino 25 19.6% Responsible for grandchildren100 80.4% Not responsible for grandchildren