Races in Raytown, Missouri (MO) Detailed Stats
Data:
Races - White alone (%)
Races - White alone (% change since 2000)
Races - Black alone (%)
Races - Black alone (% change since 2000)
Races - American Indian alone (%)
Races - American Indian alone (% change since 2000)
Races - Asian alone (%)
Races - Asian alone (% change since 2000)
Races - Hispanic (%)
Races - Hispanic (% change since 2000)
Races - Native Hawaiian and Other Pacific Islander alone (%)
Races - Native Hawaiian and Other Pacific Islander alone (% change since 2000)
Races - Two or more races(%)
Races - Two or more races(% change since 2000)
Races - Other race alone (%)
Races - Other race alone (% change since 2000)
Racial diversity
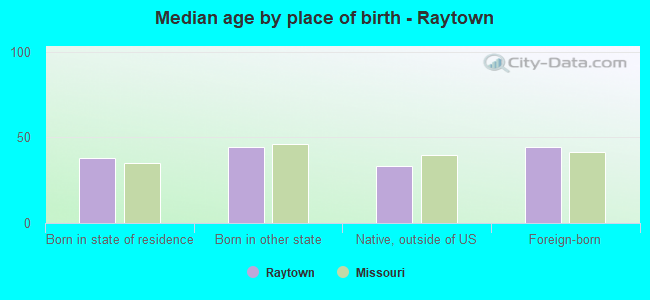
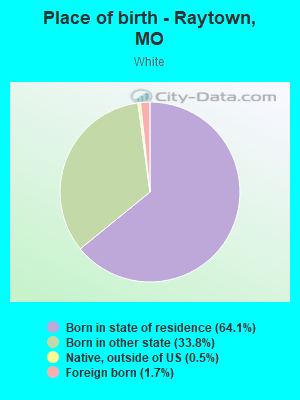
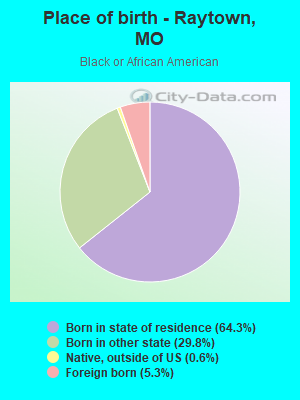
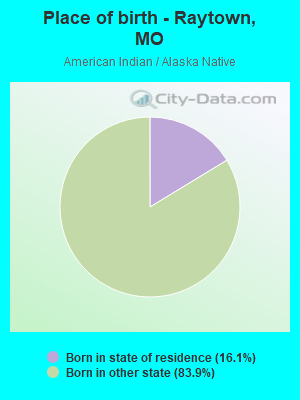
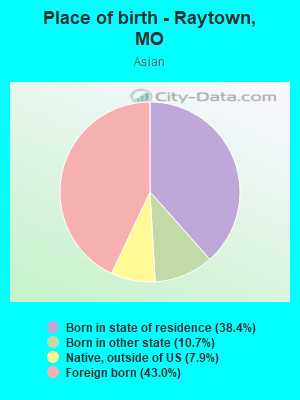
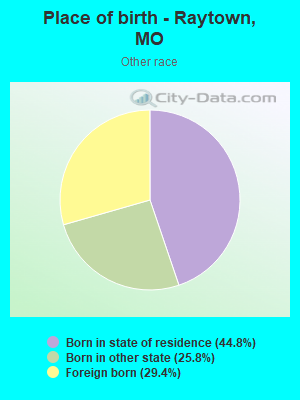
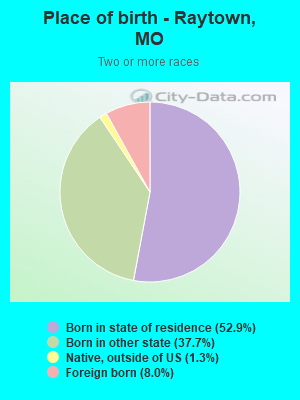
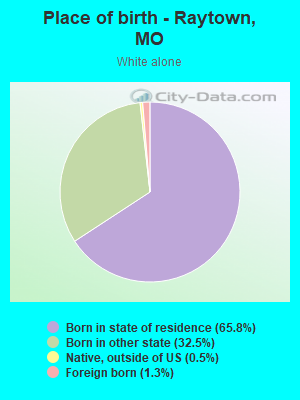
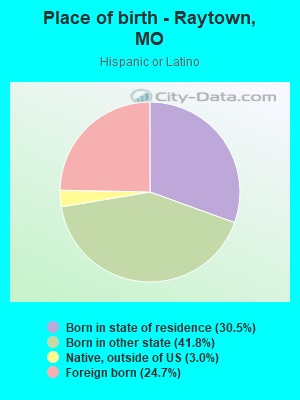
Place of birth - Born in state of residence (%)
Place of birth - Born in state of residence (%) - White
Place of birth - Born in state of residence (%) - Black or African American
Place of birth - Born in state of residence (%) - Asian
Place of birth - Born in state of residence (%) - Hispanic or Latino
Place of birth - Born in state of residence (%) - American Indian and Alaska Native
Place of birth - Born in state of residence (%) - Multirace
Place of birth - Born in state of residence (%) - Other Race
Place of birth - Born in other state (%)
Place of birth - Born in other state (%) - White
Place of birth - Born in other state (%) - Black or African American
Place of birth - Born in other state (%) - Asian
Place of birth - Born in other state (%) - Hispanic or Latino
Place of birth - Born in other state (%) - American Indian and Alaska Native
Place of birth - Born in other state (%) - Multirace
Place of birth - Born in other state (%) - Other Race
Place of birth - Native, outside of US (%)
Place of birth - Native, outside of US (%) - White
Place of birth - Native, outside of US (%) - Black or African American
Place of birth - Native, outside of US (%) - Asian
Place of birth - Native, outside of US (%) - Hispanic or Latino
Place of birth - Native, outside of US (%) - American Indian and Alaska Native
Place of birth - Native, outside of US (%) - Multirace
Place of birth - Native, outside of US (%) - Other Race
Place of birth - Foreign born (%)
Place of birth - Foreign born (%) - White
Place of birth - Foreign born (%) - Black or African American
Place of birth - Foreign born (%) - Asian
Place of birth - Foreign born (%) - Hispanic or Latino
Place of birth - Foreign born (%) - American Indian and Alaska Native
Place of birth - Foreign born (%) - Multirace
Place of birth - Foreign born (%) - Other Race
Residents speaking English at home (%)
Residents speaking English at home - Born in the United States (%)
Residents speaking English at home - Native, born elsewhere (%)
Residents speaking English at home - Foreign born (%)
Residents speaking Spanish at home (%)
Residents speaking Spanish at home - Born in the United States (%)
Residents speaking Spanish at home - Native, born elsewhere (%)
Residents speaking Spanish at home - Foreign born (%)
Residents speaking other language at home (%)
Residents speaking other language at home - Born in the United States (%)
Residents speaking other language at home - Native, born elsewhere (%)
Residents speaking other language at home - Foreign born (%)
Marital status - Never married (%)
Marital status - Now married (%)
Marital status - Separated (%)
Marital status - Widowed (%)
Marital status - Divorced (%)
Ancestries Reported - Arab (%)
Ancestries Reported - Czech (%)
Ancestries Reported - Danish (%)
Ancestries Reported - Dutch (%)
Ancestries Reported - English (%)
Ancestries Reported - French (%)
Ancestries Reported - French Canadian (%)
Ancestries Reported - German (%)
Ancestries Reported - Greek (%)
Ancestries Reported - Hungarian (%)
Ancestries Reported - Irish (%)
Ancestries Reported - Italian (%)
Ancestries Reported - Lithuanian (%)
Ancestries Reported - Norwegian (%)
Ancestries Reported - Polish (%)
Ancestries Reported - Portuguese (%)
Ancestries Reported - Russian (%)
Ancestries Reported - Scotch-Irish (%)
Ancestries Reported - Scottish (%)
Ancestries Reported - Slovak (%)
Ancestries Reported - Subsaharan African (%)
Ancestries Reported - Swedish (%)
Ancestries Reported - Swiss (%)
Ancestries Reported - Ukrainian (%)
Ancestries Reported - United States (%)
Ancestries Reported - Welsh (%)
Ancestries Reported - West Indian (%)
Ancestries Reported - Other (%)
Geographical mobility - Same house 1 year ago (%)
Geographical mobility - Same house 1 year ago (%) - White
Geographical mobility - Same house 1 year ago (%) - Black or African American
Geographical mobility - Same house 1 year ago (%) - Asian
Geographical mobility - Same house 1 year ago (%) - Hispanic or Latino
Geographical mobility - Same house 1 year ago (%) - American Indian and Alaska Native
Geographical mobility - Same house 1 year ago (%) - Multirace
Geographical mobility - Same house 1 year ago (%) - Other Race
Geographical mobility - Moved within same county (%)
Geographical mobility - Moved within same county (%) - White
Geographical mobility - Moved within same county (%) - Black or African American
Geographical mobility - Moved within same county (%) - Asian
Geographical mobility - Moved within same county (%) - Hispanic or Latino
Geographical mobility - Moved within same county (%) - American Indian and Alaska Native
Geographical mobility - Moved within same county (%) - Multirace
Geographical mobility - Moved within same county (%) - Other Race
Geographical mobility - Moved from different county within same state (%)
Geographical mobility - Moved from different county within same state (%) - White
Geographical mobility - Moved from different county within same state (%) - Black or African American
Geographical mobility - Moved from different county within same state (%) - Asian
Geographical mobility - Moved from different county within same state (%) - Hispanic or Latino
Geographical mobility - Moved from different county within same state (%) - American Indian and Alaska Native
Geographical mobility - Moved from different county within same state (%) - Multirace
Geographical mobility - Moved from different county within same state (%) - Other Race
Geographical mobility - Moved from different state (%)
Geographical mobility - Moved from different state (%) - White
Geographical mobility - Moved from different state (%) - Black or African American
Geographical mobility - Moved from different state (%) - Asian
Geographical mobility - Moved from different state (%) - Hispanic or Latino
Geographical mobility - Moved from different state (%) - American Indian and Alaska Native
Geographical mobility - Moved from different state (%) - Multirace
Geographical mobility - Moved from different state (%) - Other Race
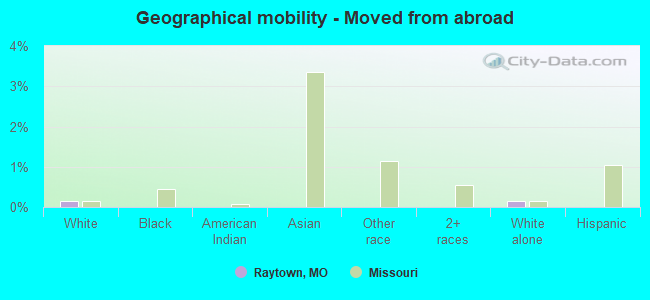
Geographical mobility - Moved from abroad (%)
Geographical mobility - Moved from abroad (%) - White
Geographical mobility - Moved from abroad (%) - Black or African American
Geographical mobility - Moved from abroad (%) - Asian
Geographical mobility - Moved from abroad (%) - Hispanic or Latino
Geographical mobility - Moved from abroad (%) - American Indian and Alaska Native
Geographical mobility - Moved from abroad (%) - Multirace
Geographical mobility - Moved from abroad (%) - Other Race
Place of birth for the foreign-born population - Ireland (%)
Place of birth for the foreign-born population - Denmark (%)
Place of birth for the foreign-born population - Norway (%)
Place of birth for the foreign-born population - Sweden (%)
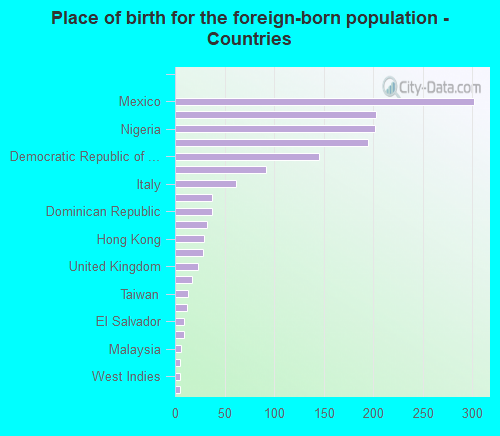
Place of birth for the foreign-born population - United Kingdom (%)
Place of birth for the foreign-born population - England (%)
Place of birth for the foreign-born population - Scotland (%)
Place of birth for the foreign-born population - Other Northern Europe (%)
Place of birth for the foreign-born population - Austria (%)
Place of birth for the foreign-born population - Belgium (%)
Place of birth for the foreign-born population - France (%)
Place of birth for the foreign-born population - Germany (%)
Place of birth for the foreign-born population - Netherlands (%)
Place of birth for the foreign-born population - Switzerland (%)
Place of birth for the foreign-born population - Other Western Europe (%)
Place of birth for the foreign-born population - Greece (%)
Place of birth for the foreign-born population - Italy (%)
Place of birth for the foreign-born population - Portugal (%)
Place of birth for the foreign-born population - Spain (%)
Place of birth for the foreign-born population - Other Southern Europe (%)
Place of birth for the foreign-born population - Albania (%)
Place of birth for the foreign-born population - Belarus (%)
Place of birth for the foreign-born population - Bosnia and Herzegovina (%)
Place of birth for the foreign-born population - Bulgaria (%)
Place of birth for the foreign-born population - Croatia (%)
Place of birth for the foreign-born population - Czechoslovakia (%)
Place of birth for the foreign-born population - Hungary (%)
Place of birth for the foreign-born population - Latvia (%)
Place of birth for the foreign-born population - Lithuania (%)
Place of birth for the foreign-born population - North Macedonia (Macedonia) (%)
Place of birth for the foreign-born population - Moldova (%)
Place of birth for the foreign-born population - Poland (%)
Place of birth for the foreign-born population - Romania (%)
Place of birth for the foreign-born population - Russia (%)
Place of birth for the foreign-born population - Serbia (%)
Place of birth for the foreign-born population - Ukraine (%)
Place of birth for the foreign-born population - Other Eastern Europe (%)
Place of birth for the foreign-born population - China (%)
Place of birth for the foreign-born population - Hong Kong (%)
Place of birth for the foreign-born population - Taiwan (%)
Place of birth for the foreign-born population - Japan (%)
Place of birth for the foreign-born population - Korea (%)
Place of birth for the foreign-born population - Other Eastern Asia (%)
Place of birth for the foreign-born population - Afghanistan (%)
Place of birth for the foreign-born population - Bangladesh (%)
Place of birth for the foreign-born population - India (%)
Place of birth for the foreign-born population - Iran (%)
Place of birth for the foreign-born population - Kazakhstan (%)
Place of birth for the foreign-born population - Nepal (%)
Place of birth for the foreign-born population - Pakistan (%)
Place of birth for the foreign-born population - Sri Lanka (%)
Place of birth for the foreign-born population - Uzbekistan (%)
Place of birth for the foreign-born population - Other South Central Asia (%)
Place of birth for the foreign-born population - Burma (%)
Place of birth for the foreign-born population - Cambodia (%)
Place of birth for the foreign-born population - Indonesia (%)
Place of birth for the foreign-born population - Laos (%)
Place of birth for the foreign-born population - Malaysia (%)
Place of birth for the foreign-born population - Philippines (%)
Place of birth for the foreign-born population - Singapore (%)
Place of birth for the foreign-born population - Thailand (%)
Place of birth for the foreign-born population - Vietnam (%)
Place of birth for the foreign-born population - Other South Eastern Asia (%)
Place of birth for the foreign-born population - Armenia (%)
Place of birth for the foreign-born population - Iraq (%)
Place of birth for the foreign-born population - Israel (%)
Place of birth for the foreign-born population - Jordan (%)
Place of birth for the foreign-born population - Kuwait (%)
Place of birth for the foreign-born population - Lebanon (%)
Place of birth for the foreign-born population - Saudi Arabia (%)
Place of birth for the foreign-born population - Syria (%)
Place of birth for the foreign-born population - Turkey (%)
Place of birth for the foreign-born population - Yemen (%)
Place of birth for the foreign-born population - Other Western Asia (%)
Place of birth for the foreign-born population - Eritrea (%)
Place of birth for the foreign-born population - Ethiopia (%)
Place of birth for the foreign-born population - Kenya (%)
Place of birth for the foreign-born population - Somalia (%)
Place of birth for the foreign-born population - Uganda (%)
Place of birth for the foreign-born population - Zimbabwe (%)
Place of birth for the foreign-born population - Other Eastern Africa (%)
Place of birth for the foreign-born population - Cameroon (%)
Place of birth for the foreign-born population - Congo (%)
Place of birth for the foreign-born population - Democratic Republic of Congo (Zaire) (%)
Place of birth for the foreign-born population - Other Middle Africa (%)
Place of birth for the foreign-born population - Egypt (%)
Place of birth for the foreign-born population - Morocco (%)
Place of birth for the foreign-born population - Sudan (%)
Place of birth for the foreign-born population - Other Northern Africa (%)
Place of birth for the foreign-born population - South Africa (%)
Place of birth for the foreign-born population - Other Southern Africa (%)
Place of birth for the foreign-born population - Cabo Verde (%)
Place of birth for the foreign-born population - Ghana (%)
Place of birth for the foreign-born population - Liberia (%)
Place of birth for the foreign-born population - Nigeria (%)
Place of birth for the foreign-born population - Senegal (%)
Place of birth for the foreign-born population - Sierra Leone (%)
Place of birth for the foreign-born population - Other Western Africa (%)
Place of birth for the foreign-born population - Australia (%)
Place of birth for the foreign-born population - New Zealand (%)
Place of birth for the foreign-born population - Fiji (%)
Place of birth for the foreign-born population - Micronesia (%)
Place of birth for the foreign-born population - Bahamas (%)
Place of birth for the foreign-born population - Barbados (%)
Place of birth for the foreign-born population - Cuba (%)
Place of birth for the foreign-born population - Dominica (%)
Place of birth for the foreign-born population - Dominican Republic (%)
Place of birth for the foreign-born population - Grenada (%)
Place of birth for the foreign-born population - Haiti (%)
Place of birth for the foreign-born population - Jamaica (%)
Place of birth for the foreign-born population - St. Vincent and the Grenadines (%)
Place of birth for the foreign-born population - Trinidad and Tobago (%)
Place of birth for the foreign-born population - West Indies (%)
Place of birth for the foreign-born population - Other Caribbean (%)
Place of birth for the foreign-born population - Belize (%)
Place of birth for the foreign-born population - Costa Rica (%)
Place of birth for the foreign-born population - El Salvador (%)
Place of birth for the foreign-born population - Guatemala (%)
Place of birth for the foreign-born population - Honduras (%)
Place of birth for the foreign-born population - Mexico (%)
Place of birth for the foreign-born population - Nicaragua (%)
Place of birth for the foreign-born population - Panama (%)
Place of birth for the foreign-born population - Other Central America (%)
Place of birth for the foreign-born population - Argentina (%)
Place of birth for the foreign-born population - Bolivia (%)
Place of birth for the foreign-born population - Brazil (%)
Place of birth for the foreign-born population - Chile (%)
Place of birth for the foreign-born population - Colombia (%)
Place of birth for the foreign-born population - Ecuador (%)
Place of birth for the foreign-born population - Guyana (%)
Place of birth for the foreign-born population - Peru (%)
Place of birth for the foreign-born population - Uruguay (%)
Place of birth for the foreign-born population - Venezuela (%)
Place of birth for the foreign-born population - Other South America (%)
Place of birth for the foreign-born population - Canada (%)
Place of birth for the foreign-born population - Other Northern America (%)
Place of birth for the foreign-born population - Other (%)
Latest news about races in Raytown, MO collected exclusively by city-data.com from local newspapers, TV, and radio stations
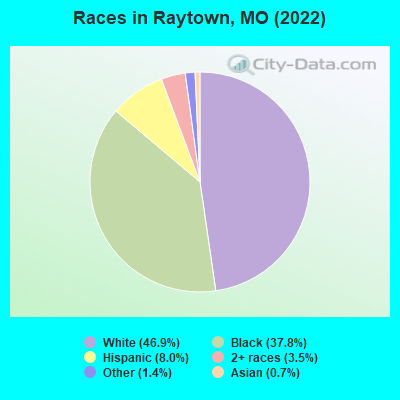
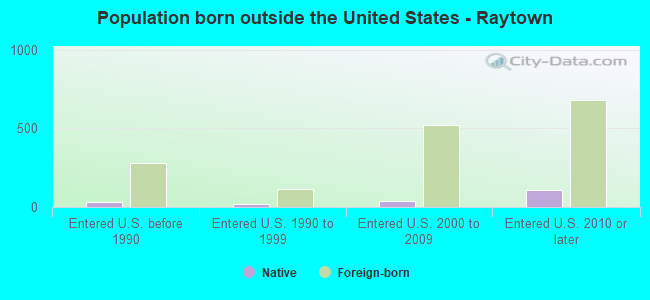
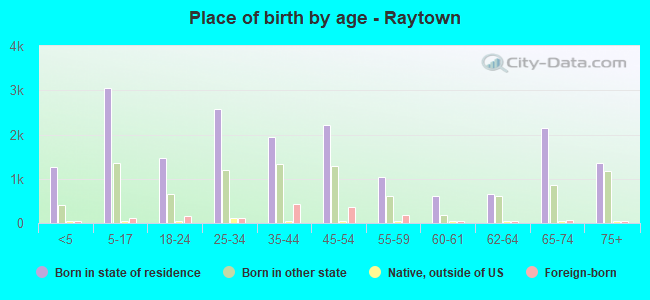
According to 2022 data, the most numerous races in Raytown, MO are White alone (13,988 residents), Black alone (11,271 residents), and Two or more races (1,048 residents). 93.0% of Raytown residents speak English at home. 5.1% of Raytown, MO residents are foreign-born (2.6% born in Latin America, 1.3% born in Africa), which is 21.7% greater than the foreign-born rate of 4.0% across the entire state of Missouri.
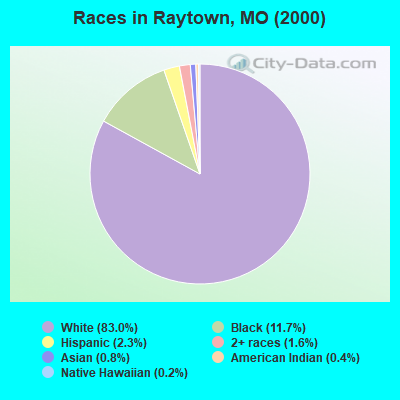
Race distribution in Raytown
2000 2022
4,686,474 83.8% White alone 625,667 11.2% Black alone 118,592 2.1% Hispanic 71,905 1.3% Two or more races 61,041 1.1% Asian alone 23,302 0.4% American Indian alone 5,291 0.09% Other race alone 2,939 0.05% Native Hawaiian and Other
4,733,411 76.6% White alone 656,739 10.6% Black alone 316,300 5.1% Two or more races 291,763 4.7% Hispanic 132,436 2.1% Asian alone 27,467 0.4% Other race alone 12,313 0.2% American Indian alone 7,528 0.1% Native Hawaiian and Other
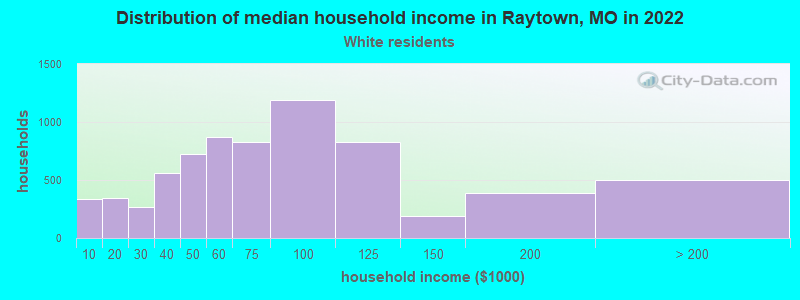
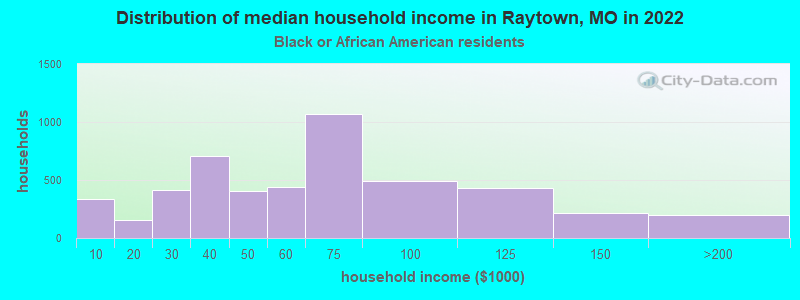
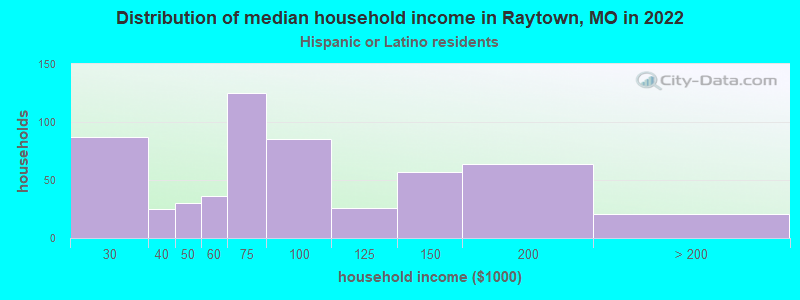
Income and house value in Raytown Median household income in 2022 $68,371 White non-Hispanic householders$59,642 Black householders$67,425 Asian householders$63,814 Some other race householders$61,594 Two or more races householders$73,229 Hispanic or Latino race householdersMedian 2022 house value $172,524 White Non-Hispanic householders$206,985 Black or African American householders$160,671 American Indian or Alaska Native householders $206,985 Asian householders$187,450 Some other race householders$147,941 Two or more races householders$185,694 Hispanic or Latino householders
Median age by race in Raytown
51.4 Median age for White residents52.5 50.6 36.5 Median age for Black or African American residents36.2 37.2 73.6 Median age for American Indian / Alaska Native residents-729,970,325.7 74.3 47.5 Median age for Asian residents31.8 50.1 -832,285,114.5 Median age for Native Hawaiian / Pacific Islander residents-678,601,874.9 -752,136,751.4 23.0 Median age for Other race residents21.3 27.2 17.7 Median age for Two or more races residents14.6 22.1 51.8 Median age for White alone residents53.2 50.6 23.2 Median age for Hispanic or Latino residents16.1 26.9
Owner/renter occupied households by race in Raytown
House owners and renters - White residents 5,262 76.0% Owner occupied1,659 24.0% Renter occupiedHouse owners and renters - Black or African American residents 2,578 52.8% Owner occupied2,306 47.2% Renter occupiedHouse owners and renters - American Indian / Alaska Native residents 6 41.1% Owner occupied8 58.9% Renter occupiedHouse owners and renters - Asian residents 80 72.5% Owner occupied30 27.5% Renter occupiedHouse owners and renters - Other race residents 21 28.9% Owner occupied53 71.1% Renter occupiedHouse owners and renters - Two or more races residents 481 48.9% Owner occupied503 51.1% Renter occupiedHouse owners and renters - White alone residents 5,250 76.6% Owner occupied1,604 23.4% Renter occupiedHouse owners and renters - Hispanic or Latino residents 306 53.0% Owner occupied271 47.0% Renter occupied
Language usage in Raytown
English speakers - Total 93.0% of residents of Raytown speak English at home.
4.4% of residents speak Spanish at home 941 76.8% Speak English very well285 23.2% Speak English less than very well2.5% of residents speak other language at home 478 67.0% Speak English very well235 33.0% Speak English less than very well
English speakers - Born in the United States 95.4% of residents of Raytown speak English at home.
3.5% of residents speak Spanish at home 252 77.5% Speak English very well73 22.5% Speak English less than very well1.0% of residents speak other language at home 80 85.1% Speak English very well14 14.9% Speak English less than very well
English speakers - Native, born elsewhere 48.1% of residents of Raytown speak English at home.
24.9% of residents speak Spanish at home 36 76.6% Speak English very well11 23.4% Speak English less than very well25.9% of residents speak other language at home 49 100.0% Speak English very well
English speakers - Foreign-born 32.6% of residents of Raytown speak English at home.
35.9% of residents speak Spanish at home 353 61.6% Speak English very well220 38.4% Speak English less than very well30.4% of residents speak other language at home 250 51.7% Speak English very well234 48.3% Speak English less than very well
White (Caucasian) - Speak only English Native:
98.1% (13,403)Foreign-born:
70.2% (166)
White (Caucasian) - Speak another language Native:
2.0% (270)Foreign-born:
42.0% (99)
Black or African American - Speak only English Native:
98.3% (9,777)Foreign-born:
48.7% (301)
Black or African American - Speak another language Native:
1.1% (113)Foreign-born:
53.5% (331)
Asian - Speak only English Native:
34.1% (69)Foreign-born:
20.9% (35)
Asian - Speak another language Native:
65.2% (132)Foreign-born:
79.0% (131)
Other race - Speak only English Native:
94.5% (457)Foreign-born:
5.8% (16)
Other race - Speak another language Native:
6.4% (31)Foreign-born:
91.3% (246)
Two or more races - Speak another language Native:
18.2% (405)Foreign-born:
100.0% (232)
White alone - Speak only English Native:
98.7% (13,296)Foreign-born:
92.9% (166)
White alone - Speak another language Native:
1.3% (179)Foreign-born:
7.4% (13)
Hispanic or Latino - Speak only English Native:
67.4% (975)Foreign-born:
1.8% (11)
Hispanic or Latino - Speak another language Native:
33.0% (478)Foreign-born:
98.1% (592)
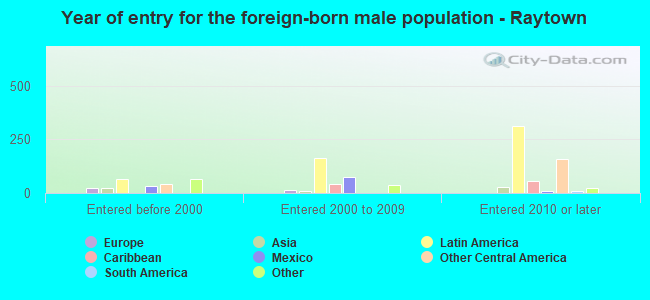
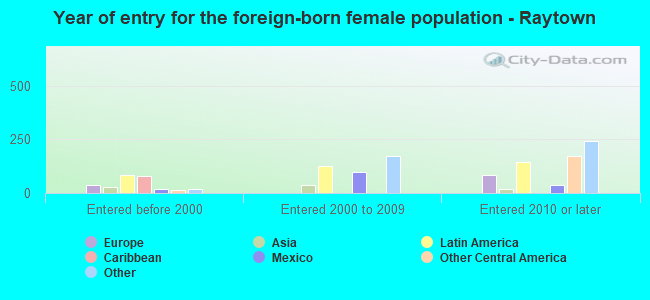
Foreign-born residents in Raytown 1,523 residents are foreign born (2.6% Latin America , 1.3% Africa ).
This city:
5.1%Missouri:
4.2%
Marital status for residents in Raytown Marital status - White (Caucasian) population 15 years and over
Males 32.0% Never married44.1% Now married0.9% Separated3.6% Widowed19.4% DivorcedFemales 27.4% Never married43.9% Now married0.3% Separated10.2% Widowed18.3% DivorcedWomen who gave birth in the past 12 months Now married:
81.8% (126)Unmarried:
18.2% (28)
Women who did not give birth in the past 12 months Now married:
41.1% (1,072)Unmarried:
58.9% (1,535)
Marital status - Black or African American population 15 years and over
Males 47.2% Never married35.7% Now married3.8% Separated0.9% Widowed12.4% DivorcedFemales 40.3% Never married29.5% Now married3.2% Separated5.4% Widowed21.6% DivorcedWomen who gave birth in the past 12 months Now married:
89.2% (118)Unmarried:
10.8% (14)
Women who did not give birth in the past 12 months Now married:
23.1% (634)Unmarried:
76.9% (2,111)
Marital status - Asian population 15 years and over
Males 28.2% Never married58.3% Now married0.0% Separated0.0% Widowed13.5% DivorcedFemales 7.0% Never married67.2% Now married0.0% Separated0.0% Widowed25.8% DivorcedWomen who did not give birth in the past 12 months Now married:
60.6% (51)Unmarried:
39.4% (33)
Marital status - Other race population 15 years and over
Males 71.6% Never married18.3% Now married0.0% Separated0.0% Widowed10.1% DivorcedFemales 50.6% Never married37.7% Now married11.7% Separated0.0% Widowed0.0% DivorcedWomen who gave birth in the past 12 months Now married:
42.2% (26)Unmarried:
57.8% (36)
Women who did not give birth in the past 12 months Now married:
46.4% (107)Unmarried:
53.6% (124)
Marital status - Two or more races population 15 years and over
Males 48.3% Never married33.9% Now married6.9% Separated0.0% Widowed10.9% DivorcedFemales 51.3% Never married31.0% Now married0.0% Separated8.4% Widowed9.2% DivorcedWomen who gave birth in the past 12 months Now married:
85.7% (37)Unmarried:
14.3% (6)
Women who did not give birth in the past 12 months Now married:
22.0% (125)Unmarried:
78.0% (446)
Marital status - White alone, not Hispanic / Latino population 15 years and over
Males 31.1% Never married43.9% Now married1.0% Separated3.7% Widowed20.2% DivorcedFemales 26.9% Never married43.4% Now married0.3% Separated10.5% Widowed18.9% DivorcedWomen who gave birth in the past 12 months Now married:
81.8% (130)Unmarried:
18.2% (29)
Women who did not give birth in the past 12 months Now married:
41.2% (1,046)Unmarried:
58.8% (1,494)
Marital status - Hispanic or Latino population 15 years and over
Males 43.2% Never married46.6% Now married3.6% Separated0.0% Widowed6.7% DivorcedFemales 44.0% Never married47.9% Now married1.6% Separated3.1% Widowed3.4% DivorcedWomen who gave birth in the past 12 months Now married:
39.3% (26)Unmarried:
60.7% (40)
Women who did not give birth in the past 12 months Now married:
41.9% (233)Unmarried:
58.1% (323)
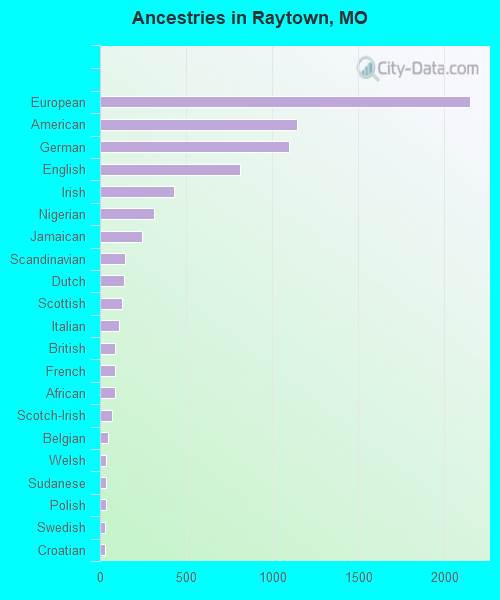
Ancestries in Raytown
2,151 12.0% European1,143 6.4% American1,097 6.1% German815 4.5% English430 2.4% Irish316 1.8% Nigerian245 1.4% Jamaican143 0.8% Scandinavian139 0.8% Dutch126 0.7% Scottish110 0.6% Italian89 0.5% British87 0.5% French86 0.5% African67 0.4% Scotch-Irish45 0.3% Belgian37 0.2% Welsh35 0.2% Sudanese33 0.2% Polish30 0.2% Swedish28 0.2% Croatian13 0.07% Eastern European13 0.07% Ukrainian9 0.05% Lithuanian8 0.04% French Canadian8 0.04% Slovak8 0.04% Bahamian7 0.04% Danish7 0.04% Norwegian3 0.02% Australian1 0.01% Northern European
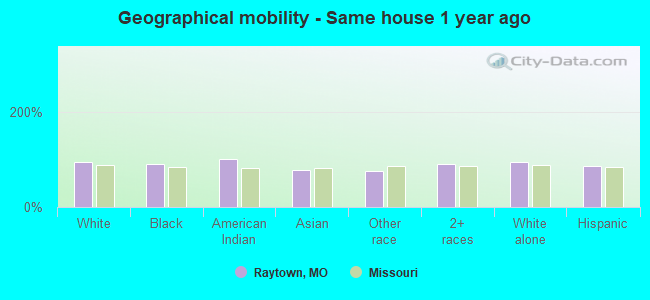
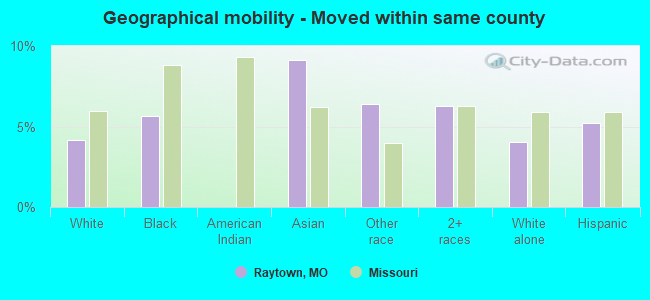
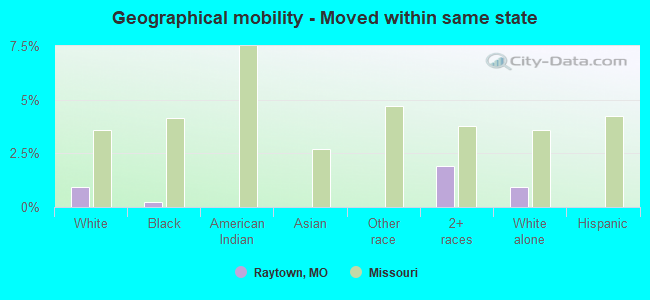
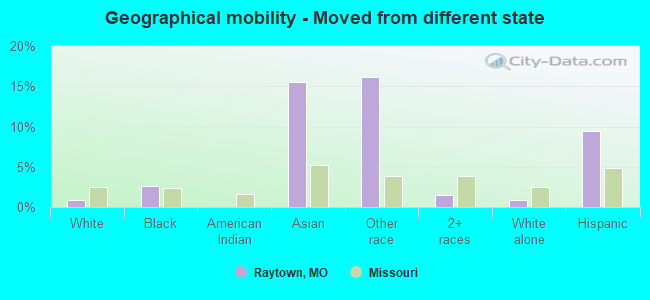
Geographical mobility in Raytown Same house 1 year ago 13,264 93.5% White (Caucasian)10,147 91.2% Black or African American19 100.0% American Indian / Alaska Native279 77.3% Asian676 76.0% Other race2,451 89.8% Two or more races13,017 93.8% White alone, not Hispanic / Latino1,966 85.0% Hispanic or LatinoMoved within same county 588 4.1% White / Caucasian630 5.7% Black or African American33 9.1% Asian57 6.4% Other race171 6.3% Two or more races562 4.0% White alone, not Hispanic / Latino120 5.2% Hispanic or LatinoMoved within same state 133 0.9% White / Caucasian26 0.2% Black or African American52 1.9% Two or more races130 0.9% White alone, not Hispanic / LatinoMoved from different state 131 0.9% White / Caucasian294 2.6% Black or African American56 15.5% Asian144 16.2% Other race40 1.5% Two or more races124 0.9% White alone, not Hispanic / Latino219 9.5% Hispanic or LatinoMoved from abroad 21 0.1% White20 0.1% White alone, not Hispanic / Latino
Children Nativity (place of birth) in Raytown
Children under 6 years - Living with two parents Both parents native 1,054 100.0% NativeBoth parents foreign-born 33 100.0% Foreign-bornOne native, one foreign-born parent 37 100.0% NativeChildren under 6 years - Living with one parent Native parent 669 100.0% NativeForeign-born parent 92 100.0% NativeChildren 6 to 17 years - Living with two parents Both parents native 1,638 99.7% Native5 0.3% Foreign-bornBoth parents foreign-born 23 56.3% Native18 43.7% Foreign-bornOne native, one foreign-born parent 16 100.0% NativeChildren 6 to 17 years - Living with one parent Native parent 1,935 100.0% NativeForeign-born parent 271 58.1% Native196 41.9% Foreign-born
Grandparents responsible for own grandchildren in Raytown
Grandparents (30 to 59 years) White / Caucasian 5 43.2% Responsible for grandchildren7 56.8% Not responsible for grandchildrenBlack or African American 127 48.9% Responsible for grandchildren132 51.1% Not responsible for grandchildrenTwo or more races 17 100.0% Not responsible for grandchildrenWhite alone, not Hispanic / Latino 6 48.0% Responsible for grandchildren7 52.0% Not responsible for grandchildrenGrandparents (60 years and over) White / Caucasian 55 26.6% Responsible for grandchildren153 73.4% Not responsible for grandchildrenBlack or African American 16 19.6% Responsible for grandchildren66 80.4% Not responsible for grandchildrenWhite alone, not Hispanic / Latino 58 26.0% Responsible for grandchildren165 74.0% Not responsible for grandchildren