Races in Redan, Georgia (GA) Detailed Stats
Ancestries, Foreign-born residents, place of birth
Settings
X


Recent posts about races in Redan, Georgia on our local forum with over 2,400,000 registered users:

Latest news about races in Redan, GA collected exclusively by city-data.com from local newspapers, TV, and radio stations
According to 2022 data, the most numerous races in Redan, GA are White alone (937 residents), Black alone (28,686 residents), and Hispanic (446 residents). 90.4% of Redan residents speak English at home. 14.4% of Redan, GA residents are foreign-born (7.0% born in Latin America, 6.3% born in Africa), which is 30.6% greater than the foreign-born rate of 10.0% across the entire state of Georgia.
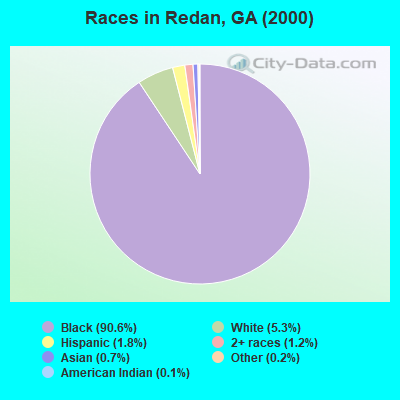
Race distribution in Redan
2000
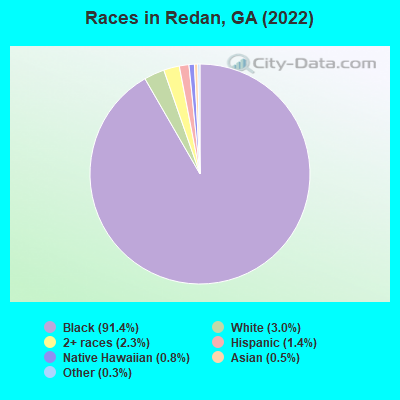
2022

- 30,66890.6%Black alone
- 1,7915.3%White alone
- 6031.8%Hispanic
- 4181.2%Two or more races
- 2370.7%Asian alone
- 750.2%Other race alone
- 400.1%American Indian alone
- 90.03%Native Hawaiian and Other
Pacific Islander alone
-
- 28,68691.4%Black alone
- 9373.0%White alone
- 7342.3%Two or more races
- 4461.4%Hispanic
- 2390.8%Native Hawaiian and Other
Pacific Islander alone - 1510.5%Asian alone
- 940.3%Other race alone
- 80.03%American Indian alone
2000
2022
-
- 5,128,66162.6%White alone
- 2,331,46528.5%Black alone
- 435,2275.3%Hispanic
- 171,5132.1%Asian alone
- 87,3641.1%Two or more races
- 17,6700.2%American Indian alone
- 11,2750.1%Other race alone
- 3,2780.04%Native Hawaiian and Other
Pacific Islander alone

-
- 5,415,65749.6%White alone
- 3,349,24030.7%Black alone
- 1,132,60410.4%Hispanic
- 479,1564.4%Asian alone
- 462,9234.2%Two or more races
- 54,4160.5%Other race alone
- 11,9230.1%American Indian alone
- 6,9570.06%Native Hawaiian and Other
Pacific Islander alone

Income and house value in Redan
- Median household income in 2022
- $41,862White non-Hispanic householders
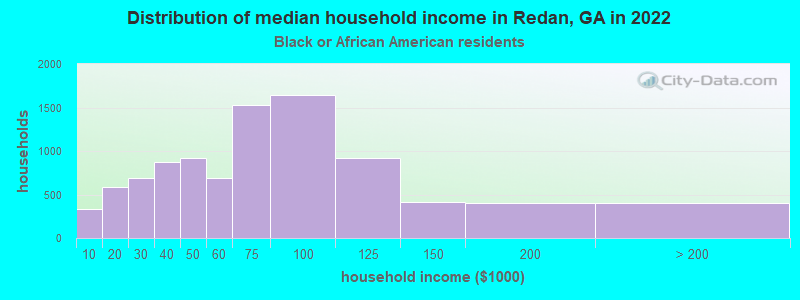
- $66,685Black householders
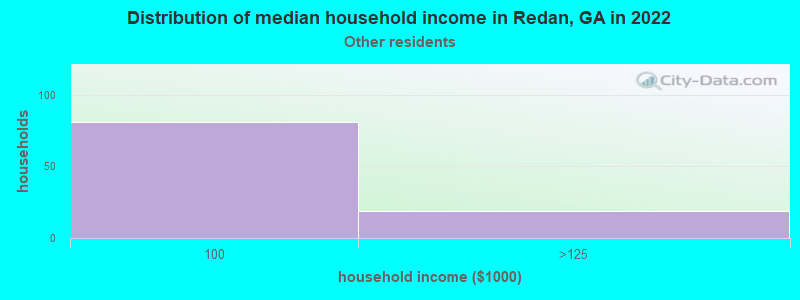
- $76,530Some other race householders
- $53,480Hispanic or Latino race householders
- Median 2022 house value
- $203,971White Non-Hispanic householders
- $199,322Black or African American householders
- $217,918American Indian or Alaska Native householders
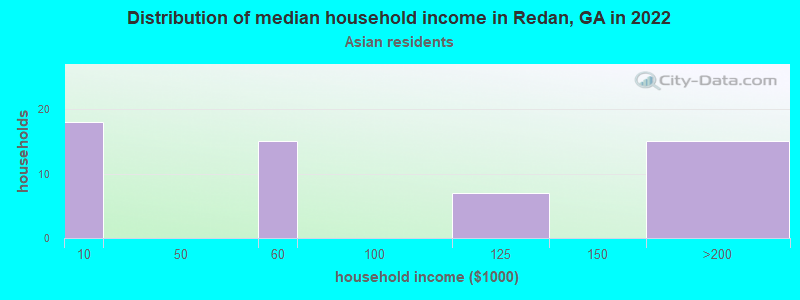
- $172,010Asian householders
- $175,496Some other race householders
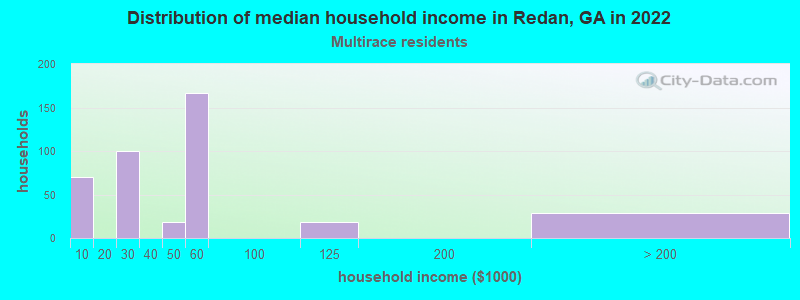
- $193,705Two or more races householders
- $192,349Hispanic or Latino householders
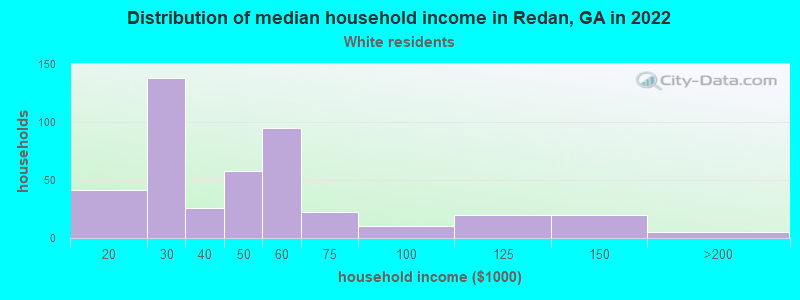
Household income for White non-Hispanic householders
Household income for Black householders
Household income for Asian householders
Household income for Some other race householders
Household income for Two or more races householders
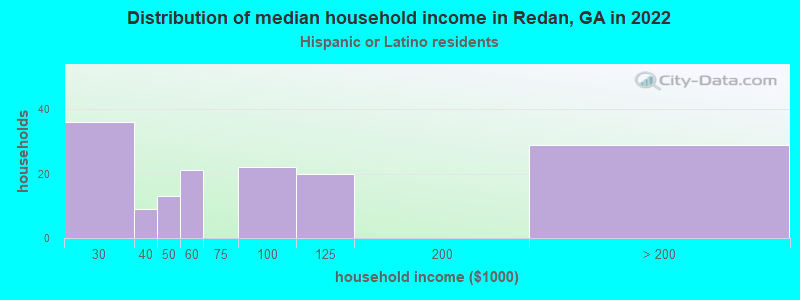
Household income for Hispanic or Latino race householders
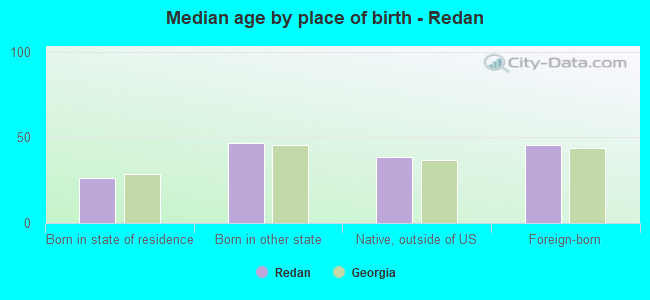
Median age by race in Redan
- 37.3Median age for White residents
- 41.8Males
- 36.0Females
- 37.8Median age for Black or African American residents
- 36.0Males
- 40.4Females
- -631,178,706.6Median age for American Indian / Alaska Native residents
- -658,914,728.0Males
- -565,432,098.2Females
- 32.2Median age for Asian residents
- 30.6Males
- 55.2Females
- 12.4Median age for Native Hawaiian / Pacific Islander residents
- 10.5Males
- 17.0Females
- 20.3Median age for Other race residents
- 20.8Males
- 33.5Females
- 32.4Median age for Two or more races residents
- 22.2Males
- 36.7Females
- 36.8Median age for White alone residents
- 41.5Males
- 35.2Females
- 37.7Median age for Hispanic or Latino residents
- 19.8Males
- 46.9Females
Owner/renter occupied households by race in Redan
- House owners and renters - White residents
- 22552.1%Owner occupied
- 20747.9%Renter occupied
- House owners and renters - Black or African American residents
- 5,75260.8%Owner occupied
- 3,70539.2%Renter occupied
- House owners and renters - American Indian / Alaska Native residents
- 13100.0%Owner occupied
- House owners and renters - Asian residents
- 4380.7%Owner occupied
- 1019.3%Renter occupied
- House owners and renters - Native Hawaiian / Pacific Islander residents
- 40100.0%Renter occupied
- House owners and renters - Other race residents
- 94100.0%Owner occupied
- House owners and renters - Two or more races residents
- 30581.7%Owner occupied
- 6818.3%Renter occupied
- House owners and renters - White alone residents
- 22650.8%Owner occupied
- 21949.2%Renter occupied
- House owners and renters - Hispanic or Latino residents
- 15485.0%Owner occupied
- 2715.0%Renter occupied
Language usage in Redan
- English speakers - Total
- 90.4% of residents of Redan speak English at home.
- 1.2% of residents speak Spanish at home
- 25173.2%Speak English very well
- 9226.8%Speak English less than very well
- 9.4% of residents speak other language at home
- 2,20379.9%Speak English very well
- 55520.1%Speak English less than very well
- English speakers - Born in the United States
- 99.1% of residents of Redan speak English at home.
- 0.1% of residents speak Spanish at home
- 12100.0%Speak English very well
- 0.6% of residents speak other language at home
- 76100.0%Speak English very well
- English speakers - Native, born elsewhere
- 74.3% of residents of Redan speak English at home.
- 7.3% of residents speak Spanish at home
- 36100.0%Speak English very well
- 9.0% of residents speak other language at home
- 44100.0%Speak English very well
- English speakers - Foreign-born
- 43.4% of residents of Redan speak English at home.
- 4.7% of residents speak Spanish at home
- 12663.3%Speak English very well
- 7336.7%Speak English less than very well
- 57.5% of residents speak other language at home
- 1,90978.8%Speak English very well
- 51521.2%Speak English less than very well
White (Caucasian) - Speak only English
| Native: | 100.0% (825) |
| Foreign-born: | 23.5% (8) |
Black or African American - Speak only English
| Native: | 98.5% (22,708) |
| Foreign-born: | 46.3% (1,905) |
Black or African American - Speak another language
| Native: | 1.2% (270) |
| Foreign-born: | 53.9% (2,218) |
Asian - Speak another language
| Native: | 97.1% (25) |
| Foreign-born: | 81.1% (98) |
Other race - Speak another language
| Native: | 54.9% (225) |
| Foreign-born: | 100.0% (203) |
Two or more races - Speak only English
| Native: | 88.9% (311) |
| Foreign-born: | 30.9% (79) |
Two or more races - Speak another language
| Native: | 13.8% (48) |
| Foreign-born: | 69.2% (178) |
White alone - Speak only English
| Native: | 100.0% (835) |
| Foreign-born: | 15.3% (8) |
Hispanic or Latino - Speak only English
| Native: | 49.7% (156) |
| Foreign-born: | 13.1% (19) |
Hispanic or Latino - Speak another language
| Native: | 53.4% (168) |
| Foreign-born: | 88.1% (130) |
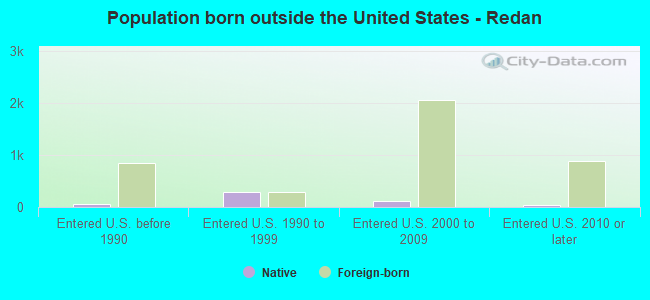
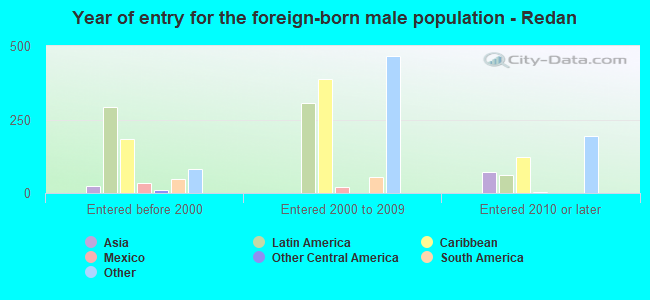
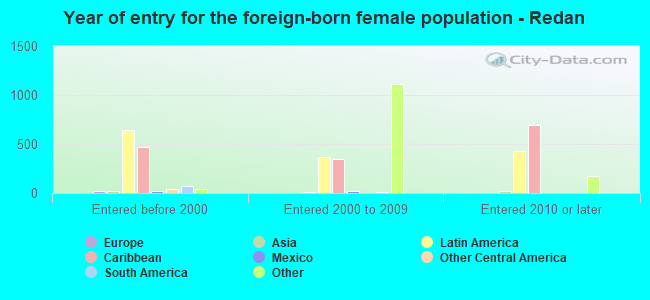
Foreign-born residents in Redan
4,522 residents are foreign born (7.0% Latin America, 6.3% Africa).
| This city: | 14.4% |
| Georgia: | 10.4% |
Marital status for residents in Redan
Marital status - White (Caucasian) population 15 years and over
- Males
- 50.8%Never married
- 39.4%Now married
- 0.0%Separated
- 2.5%Widowed
- 7.3%Divorced
- Females
- 25.4%Never married
- 38.7%Now married
- 4.7%Separated
- 16.7%Widowed
- 14.5%Divorced
Women who did not give birth in the past 12 months
| Now married: | 39.1% (85) |
| Unmarried: | 60.9% (133) |
Marital status - Black or African American population 15 years and over
- Males
- 42.7%Never married
- 36.0%Now married
- 5.9%Separated
- 2.7%Widowed
- 12.7%Divorced
- Females
- 45.9%Never married
- 25.6%Now married
- 2.4%Separated
- 7.9%Widowed
- 18.2%Divorced
Women who gave birth in the past 12 months
| Now married: | 73.6% (191) |
| Unmarried: | 26.4% (69) |
Women who did not give birth in the past 12 months
| Now married: | 23.3% (1,742) |
| Unmarried: | 76.7% (5,740) |
Marital status - Asian population 15 years and over
- Males
- 63.3%Never married
- 36.7%Now married
- 0.0%Separated
- 0.0%Widowed
- 0.0%Divorced
- Females
- 0.0%Never married
- 83.7%Now married
- 0.0%Separated
- 0.0%Widowed
- 16.3%Divorced
Women who did not give birth in the past 12 months
| Now married: | 100.0% (15) |
| Unmarried: | 0.0% (0) |
Marital status - Native Hawaiian / Pacific Islander population 15 years and over
- Males
- 0.0%Never married
- 0.0%Now married
- 0.0%Separated
- 0.0%Widowed
- 100.0%Divorced
- Females
- 100.0%Never married
- 0.0%Now married
- 0.0%Separated
- 0.0%Widowed
- 0.0%Divorced
Women who did not give birth in the past 12 months
| Now married: | 0.0% (0) |
| Unmarried: | 100.0% (43) |
Marital status - Other race population 15 years and over
- Males
- 61.3%Never married
- 38.7%Now married
- 0.0%Separated
- 0.0%Widowed
- 0.0%Divorced
- Females
- 21.3%Never married
- 78.7%Now married
- 0.0%Separated
- 0.0%Widowed
- 0.0%Divorced
Women who did not give birth in the past 12 months
| Now married: | 73.5% (107) |
| Unmarried: | 26.5% (39) |
Marital status - Two or more races population 15 years and over
- Males
- 45.5%Never married
- 54.5%Now married
- 0.0%Separated
- 0.0%Widowed
- 0.0%Divorced
- Females
- 22.4%Never married
- 39.3%Now married
- 0.0%Separated
- 38.3%Widowed
- 0.0%Divorced
Women who did not give birth in the past 12 months
| Now married: | 4.1% (6) |
| Unmarried: | 95.9% (147) |
Marital status - White alone, not Hispanic / Latino population 15 years and over
- Males
- 50.8%Never married
- 39.4%Now married
- 0.0%Separated
- 2.5%Widowed
- 7.3%Divorced
- Females
- 25.4%Never married
- 38.7%Now married
- 4.7%Separated
- 16.7%Widowed
- 14.5%Divorced
Women who did not give birth in the past 12 months
| Now married: | 39.1% (89) |
| Unmarried: | 60.9% (139) |
Marital status - Hispanic or Latino population 15 years and over
- Males
- 40.0%Never married
- 48.5%Now married
- 0.0%Separated
- 0.0%Widowed
- 11.5%Divorced
- Females
- 17.3%Never married
- 49.0%Now married
- 0.0%Separated
- 15.3%Widowed
- 18.3%Divorced
Women who did not give birth in the past 12 months
| Now married: | 49.5% (54) |
| Unmarried: | 50.5% (55) |
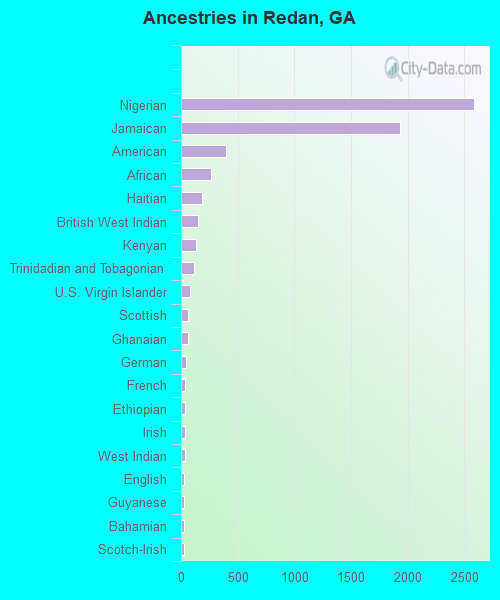
Ancestries in Redan

- 2,59011.0%Nigerian
- 1,9338.2%Jamaican
- 3931.7%American
- 2611.1%African
- 1850.8%Haitian
- 1530.7%British West Indian
- 1310.6%Kenyan
- 1130.5%Trinidadian and Tobagonian
- 770.3%U.S. Virgin Islander
- 620.3%Scottish
- 590.3%Ghanaian
- 410.2%German
- 380.2%French
- 370.2%Ethiopian
- 330.1%Irish
- 310.1%West Indian
- 290.1%English
- 290.1%Guyanese
- 250.1%Bahamian
- 240.1%Scotch-Irish
- 200.09%Zimbabwean
- 180.08%Belizean
- 120.05%Barbadian
- 20.01%Turkish
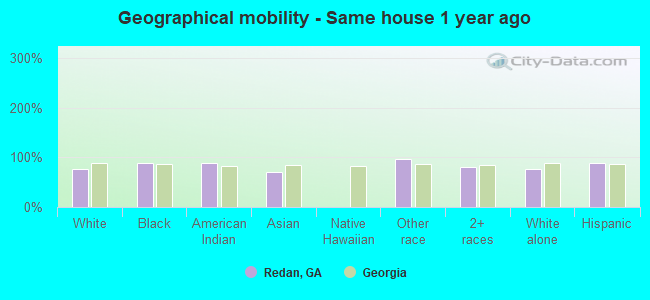
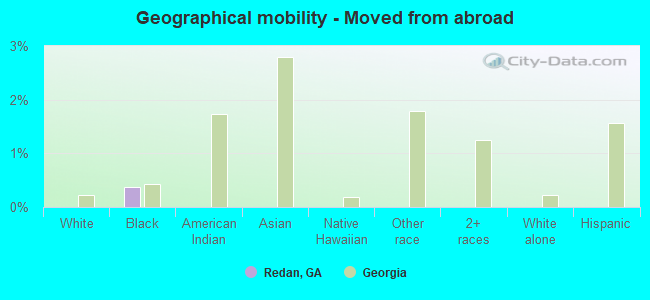
Geographical mobility in Redan

- Same house 1 year ago
- 68276.8%White (Caucasian)
- 25,22588.5%Black or African American
- 687.7%American Indian / Alaska Native
- 10469.7%Asian
- 60596.5%Other race
- 62481.1%Two or more races
- 71876.6%White alone, not Hispanic / Latino
- 39689.2%Hispanic or Latino
-
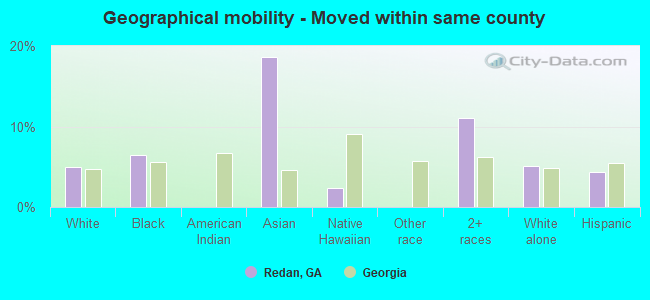
- Moved within same county
- 444.9%White / Caucasian
- 1,8366.4%Black or African American
- 2818.7%Asian
- 52.4%Native Hawaiian / Pacific Islander
- 8511.1%Two or more races
- 485.2%White alone, not Hispanic / Latino
- 194.4%Hispanic or Latino
-
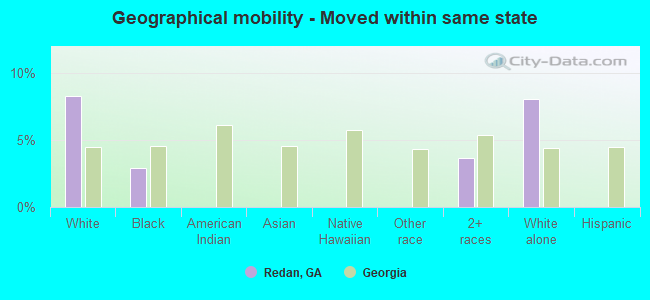
- Moved within same state
- 738.3%White / Caucasian
- 8322.9%Black or African American
- 283.7%Two or more races
- 768.1%White alone, not Hispanic / Latino
-
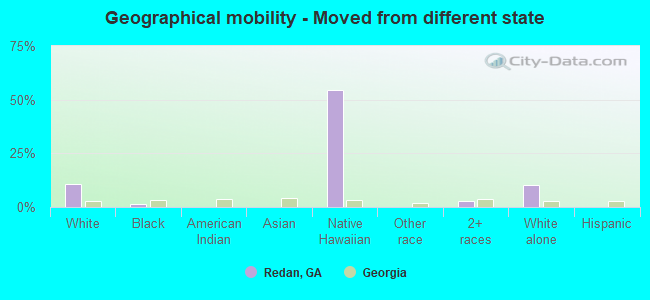
- Moved from different state
- 9510.7%White / Caucasian
- 4461.6%Black or African American
- 11754.7%Native Hawaiian / Pacific Islander
- 232.9%Two or more races
- 9810.5%White alone, not Hispanic / Latino
-
- Moved from abroad
- 1060.4%Black or African American
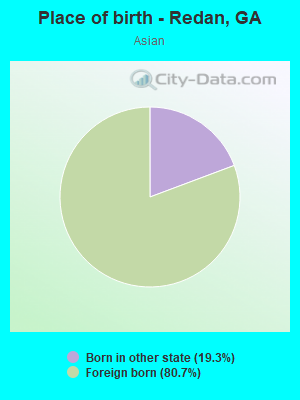
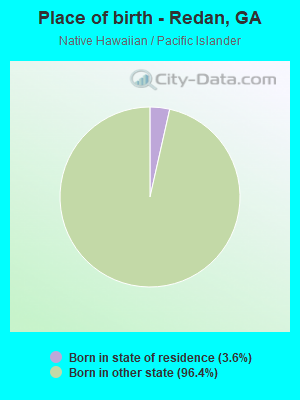
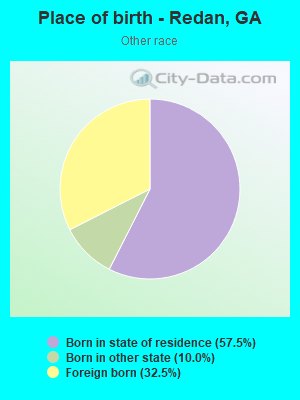
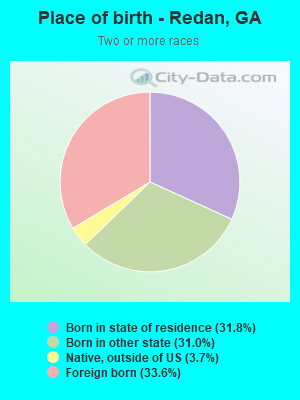
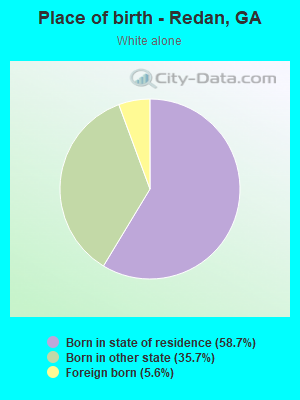
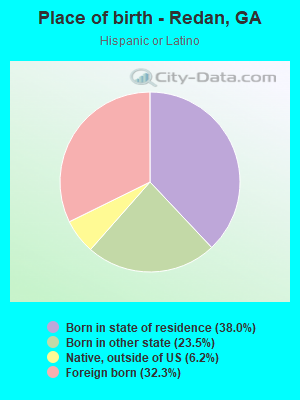
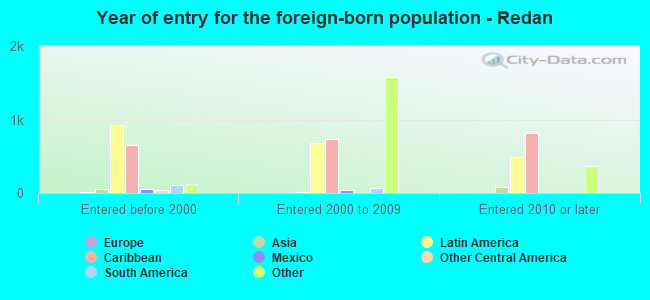
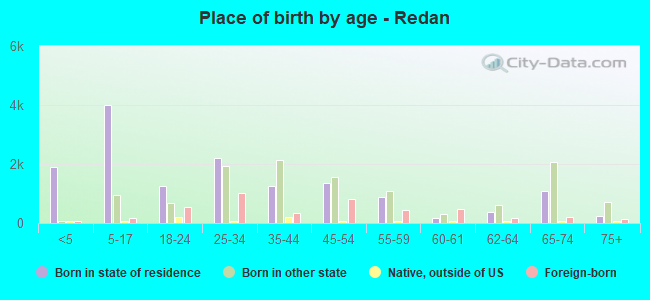
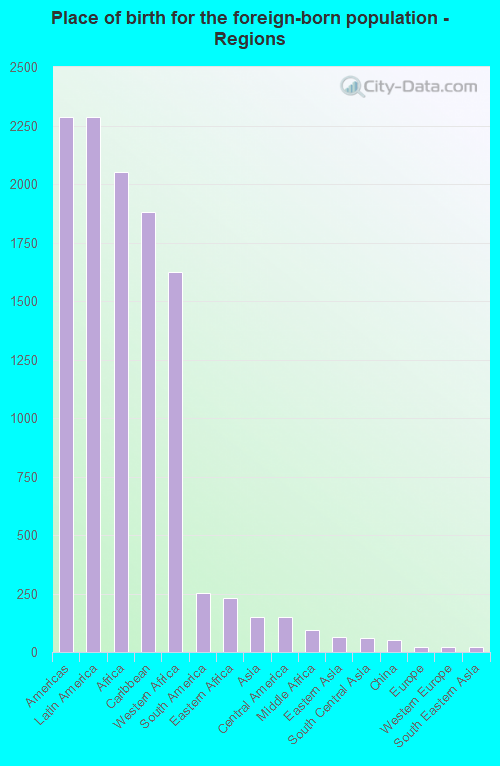
Children Nativity (place of birth) in Redan
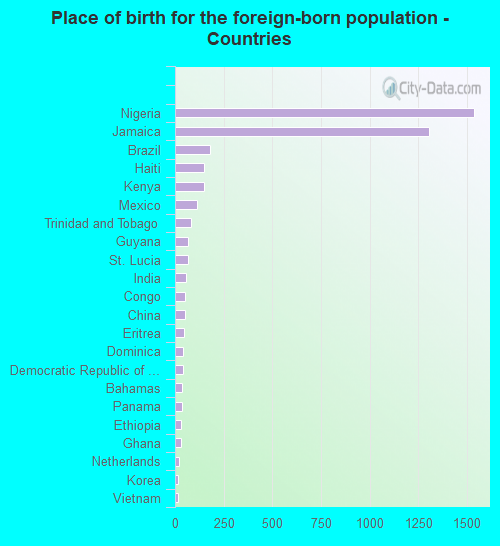
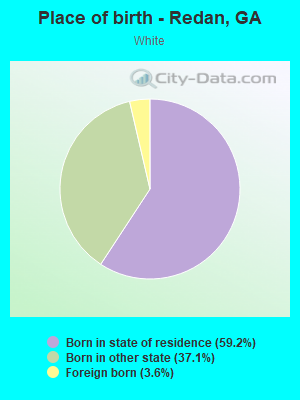
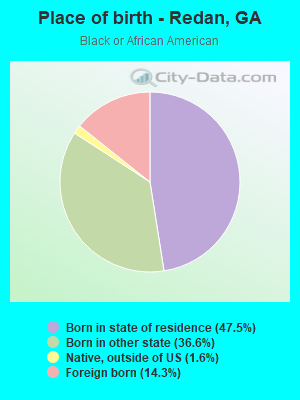
Place of birth for residents in Redan
![Place of birth for the foreign-born population - Regions]()
- 2,285Americas
- 2,285Latin America
- 2,051Africa
- 1,881Caribbean
- 1,623Western Africa
- 254South America
- 230Eastern Africa
- 150Asia
- 149Central America
- 93Middle Africa
- 66Eastern Asia
- 58South Central Asia
- 50China
- 23Europe
- 23Western Europe
- 21South Eastern Asia
- 11Oceania
- 11Australia and New Zealand Subregion
- 3Western Asia
![Place of birth for the foreign-born population - Countries]()
- 1,537Nigeria
- 1,307Jamaica
- 181Brazil
- 151Haiti
- 150Kenya
- 114Mexico
- 80Trinidad and Tobago
- 66Guyana
- 65St. Lucia
- 58India
- 51Congo
- 50China
- 47Eritrea
- 43Dominica
- 42Democratic Republic of Congo (Zaire)
- 38Bahamas
- 34Panama
- 32Ethiopia
- 29Ghana
- 23Netherlands
- 16Korea
- 16Vietnam
- 11Australia
- 11Barbados
- 11St. Vincent and the Grenadines
- 6Argentina
- 5Philippines
- 3Turkey