Races in Redmond, Washington (WA) Detailed Stats
Data:
Races - White alone (%)
Races - White alone (% change since 2000)
Races - Black alone (%)
Races - Black alone (% change since 2000)
Races - American Indian alone (%)
Races - American Indian alone (% change since 2000)
Races - Asian alone (%)
Races - Asian alone (% change since 2000)
Races - Hispanic (%)
Races - Hispanic (% change since 2000)
Races - Native Hawaiian and Other Pacific Islander alone (%)
Races - Native Hawaiian and Other Pacific Islander alone (% change since 2000)
Races - Two or more races(%)
Races - Two or more races(% change since 2000)
Races - Other race alone (%)
Races - Other race alone (% change since 2000)
Racial diversity
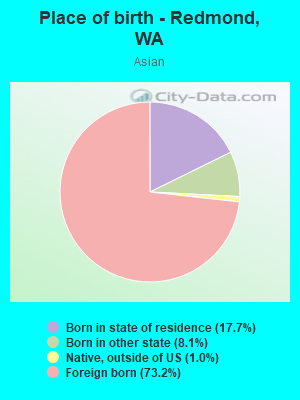
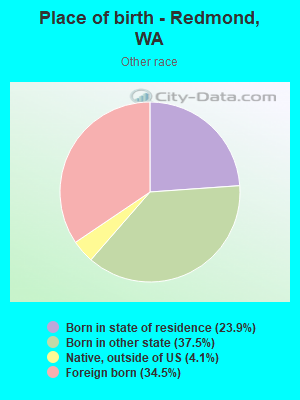
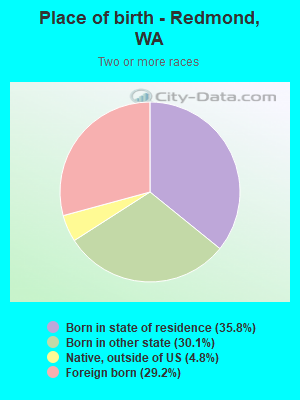
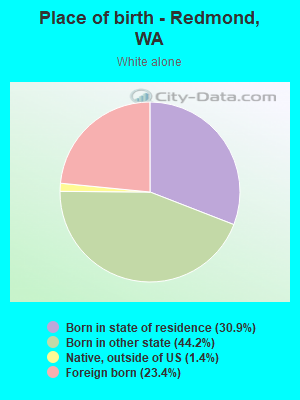
Place of birth - Born in state of residence (%)
Place of birth - Born in state of residence (%) - White
Place of birth - Born in state of residence (%) - Black or African American
Place of birth - Born in state of residence (%) - Asian
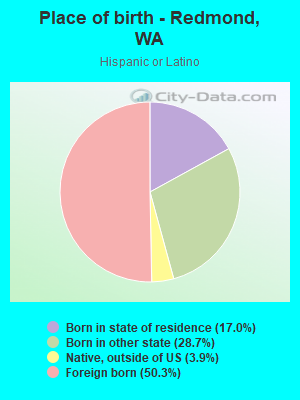
Place of birth - Born in state of residence (%) - Hispanic or Latino
Place of birth - Born in state of residence (%) - American Indian and Alaska Native
Place of birth - Born in state of residence (%) - Multirace
Place of birth - Born in state of residence (%) - Other Race
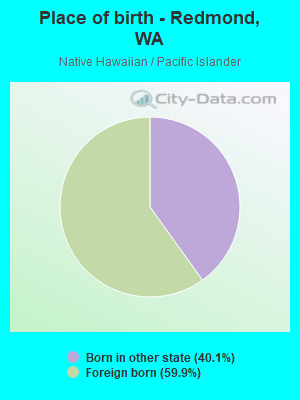
Place of birth - Born in other state (%)
Place of birth - Born in other state (%) - White
Place of birth - Born in other state (%) - Black or African American
Place of birth - Born in other state (%) - Asian
Place of birth - Born in other state (%) - Hispanic or Latino
Place of birth - Born in other state (%) - American Indian and Alaska Native
Place of birth - Born in other state (%) - Multirace
Place of birth - Born in other state (%) - Other Race
Place of birth - Native, outside of US (%)
Place of birth - Native, outside of US (%) - White
Place of birth - Native, outside of US (%) - Black or African American
Place of birth - Native, outside of US (%) - Asian
Place of birth - Native, outside of US (%) - Hispanic or Latino
Place of birth - Native, outside of US (%) - American Indian and Alaska Native
Place of birth - Native, outside of US (%) - Multirace
Place of birth - Native, outside of US (%) - Other Race
Place of birth - Foreign born (%)
Place of birth - Foreign born (%) - White
Place of birth - Foreign born (%) - Black or African American
Place of birth - Foreign born (%) - Asian
Place of birth - Foreign born (%) - Hispanic or Latino
Place of birth - Foreign born (%) - American Indian and Alaska Native
Place of birth - Foreign born (%) - Multirace
Place of birth - Foreign born (%) - Other Race
Residents speaking English at home (%)
Residents speaking English at home - Born in the United States (%)
Residents speaking English at home - Native, born elsewhere (%)
Residents speaking English at home - Foreign born (%)
Residents speaking Spanish at home (%)
Residents speaking Spanish at home - Born in the United States (%)
Residents speaking Spanish at home - Native, born elsewhere (%)
Residents speaking Spanish at home - Foreign born (%)
Residents speaking other language at home (%)
Residents speaking other language at home - Born in the United States (%)
Residents speaking other language at home - Native, born elsewhere (%)
Residents speaking other language at home - Foreign born (%)
Marital status - Never married (%)
Marital status - Now married (%)
Marital status - Separated (%)
Marital status - Widowed (%)
Marital status - Divorced (%)
Ancestries Reported - Arab (%)
Ancestries Reported - Czech (%)
Ancestries Reported - Danish (%)
Ancestries Reported - Dutch (%)
Ancestries Reported - English (%)
Ancestries Reported - French (%)
Ancestries Reported - French Canadian (%)
Ancestries Reported - German (%)
Ancestries Reported - Greek (%)
Ancestries Reported - Hungarian (%)
Ancestries Reported - Irish (%)
Ancestries Reported - Italian (%)
Ancestries Reported - Lithuanian (%)
Ancestries Reported - Norwegian (%)
Ancestries Reported - Polish (%)
Ancestries Reported - Portuguese (%)
Ancestries Reported - Russian (%)
Ancestries Reported - Scotch-Irish (%)
Ancestries Reported - Scottish (%)
Ancestries Reported - Slovak (%)
Ancestries Reported - Subsaharan African (%)
Ancestries Reported - Swedish (%)
Ancestries Reported - Swiss (%)
Ancestries Reported - Ukrainian (%)
Ancestries Reported - United States (%)
Ancestries Reported - Welsh (%)
Ancestries Reported - West Indian (%)
Ancestries Reported - Other (%)
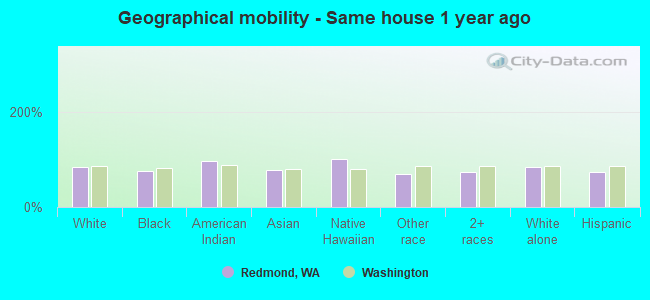
Geographical mobility - Same house 1 year ago (%)
Geographical mobility - Same house 1 year ago (%) - White
Geographical mobility - Same house 1 year ago (%) - Black or African American
Geographical mobility - Same house 1 year ago (%) - Asian
Geographical mobility - Same house 1 year ago (%) - Hispanic or Latino
Geographical mobility - Same house 1 year ago (%) - American Indian and Alaska Native
Geographical mobility - Same house 1 year ago (%) - Multirace
Geographical mobility - Same house 1 year ago (%) - Other Race
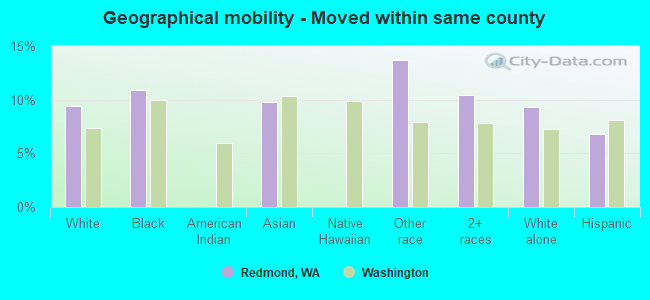
Geographical mobility - Moved within same county (%)
Geographical mobility - Moved within same county (%) - White
Geographical mobility - Moved within same county (%) - Black or African American
Geographical mobility - Moved within same county (%) - Asian
Geographical mobility - Moved within same county (%) - Hispanic or Latino
Geographical mobility - Moved within same county (%) - American Indian and Alaska Native
Geographical mobility - Moved within same county (%) - Multirace
Geographical mobility - Moved within same county (%) - Other Race
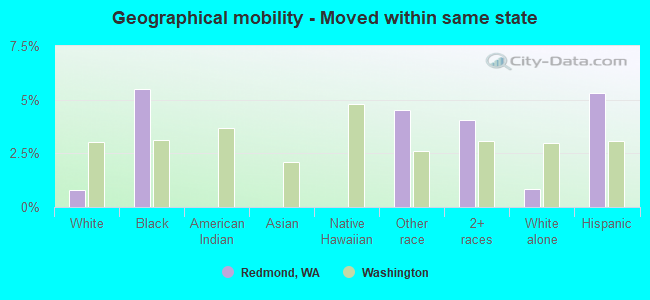
Geographical mobility - Moved from different county within same state (%)
Geographical mobility - Moved from different county within same state (%) - White
Geographical mobility - Moved from different county within same state (%) - Black or African American
Geographical mobility - Moved from different county within same state (%) - Asian
Geographical mobility - Moved from different county within same state (%) - Hispanic or Latino
Geographical mobility - Moved from different county within same state (%) - American Indian and Alaska Native
Geographical mobility - Moved from different county within same state (%) - Multirace
Geographical mobility - Moved from different county within same state (%) - Other Race
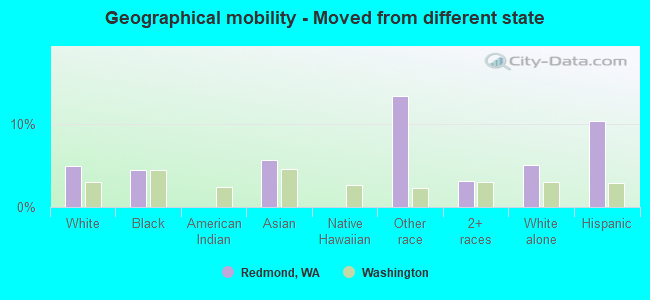
Geographical mobility - Moved from different state (%)
Geographical mobility - Moved from different state (%) - White
Geographical mobility - Moved from different state (%) - Black or African American
Geographical mobility - Moved from different state (%) - Asian
Geographical mobility - Moved from different state (%) - Hispanic or Latino
Geographical mobility - Moved from different state (%) - American Indian and Alaska Native
Geographical mobility - Moved from different state (%) - Multirace
Geographical mobility - Moved from different state (%) - Other Race
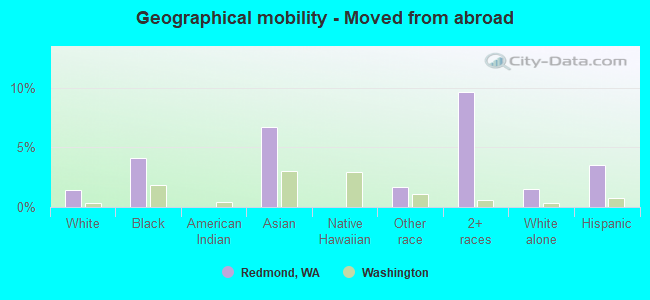
Geographical mobility - Moved from abroad (%)
Geographical mobility - Moved from abroad (%) - White
Geographical mobility - Moved from abroad (%) - Black or African American
Geographical mobility - Moved from abroad (%) - Asian
Geographical mobility - Moved from abroad (%) - Hispanic or Latino
Geographical mobility - Moved from abroad (%) - American Indian and Alaska Native
Geographical mobility - Moved from abroad (%) - Multirace
Geographical mobility - Moved from abroad (%) - Other Race
Place of birth for the foreign-born population - Ireland (%)
Place of birth for the foreign-born population - Denmark (%)
Place of birth for the foreign-born population - Norway (%)
Place of birth for the foreign-born population - Sweden (%)
Place of birth for the foreign-born population - United Kingdom (%)
Place of birth for the foreign-born population - England (%)
Place of birth for the foreign-born population - Scotland (%)
Place of birth for the foreign-born population - Other Northern Europe (%)
Place of birth for the foreign-born population - Austria (%)
Place of birth for the foreign-born population - Belgium (%)
Place of birth for the foreign-born population - France (%)
Place of birth for the foreign-born population - Germany (%)
Place of birth for the foreign-born population - Netherlands (%)
Place of birth for the foreign-born population - Switzerland (%)
Place of birth for the foreign-born population - Other Western Europe (%)
Place of birth for the foreign-born population - Greece (%)
Place of birth for the foreign-born population - Italy (%)
Place of birth for the foreign-born population - Portugal (%)
Place of birth for the foreign-born population - Spain (%)
Place of birth for the foreign-born population - Other Southern Europe (%)
Place of birth for the foreign-born population - Albania (%)
Place of birth for the foreign-born population - Belarus (%)
Place of birth for the foreign-born population - Bosnia and Herzegovina (%)
Place of birth for the foreign-born population - Bulgaria (%)
Place of birth for the foreign-born population - Croatia (%)
Place of birth for the foreign-born population - Czechoslovakia (%)
Place of birth for the foreign-born population - Hungary (%)
Place of birth for the foreign-born population - Latvia (%)
Place of birth for the foreign-born population - Lithuania (%)
Place of birth for the foreign-born population - North Macedonia (Macedonia) (%)
Place of birth for the foreign-born population - Moldova (%)
Place of birth for the foreign-born population - Poland (%)
Place of birth for the foreign-born population - Romania (%)
Place of birth for the foreign-born population - Russia (%)
Place of birth for the foreign-born population - Serbia (%)
Place of birth for the foreign-born population - Ukraine (%)
Place of birth for the foreign-born population - Other Eastern Europe (%)
Place of birth for the foreign-born population - China (%)
Place of birth for the foreign-born population - Hong Kong (%)
Place of birth for the foreign-born population - Taiwan (%)
Place of birth for the foreign-born population - Japan (%)
Place of birth for the foreign-born population - Korea (%)
Place of birth for the foreign-born population - Other Eastern Asia (%)
Place of birth for the foreign-born population - Afghanistan (%)
Place of birth for the foreign-born population - Bangladesh (%)
Place of birth for the foreign-born population - India (%)
Place of birth for the foreign-born population - Iran (%)
Place of birth for the foreign-born population - Kazakhstan (%)
Place of birth for the foreign-born population - Nepal (%)
Place of birth for the foreign-born population - Pakistan (%)
Place of birth for the foreign-born population - Sri Lanka (%)
Place of birth for the foreign-born population - Uzbekistan (%)
Place of birth for the foreign-born population - Other South Central Asia (%)
Place of birth for the foreign-born population - Burma (%)
Place of birth for the foreign-born population - Cambodia (%)
Place of birth for the foreign-born population - Indonesia (%)
Place of birth for the foreign-born population - Laos (%)
Place of birth for the foreign-born population - Malaysia (%)
Place of birth for the foreign-born population - Philippines (%)
Place of birth for the foreign-born population - Singapore (%)
Place of birth for the foreign-born population - Thailand (%)
Place of birth for the foreign-born population - Vietnam (%)
Place of birth for the foreign-born population - Other South Eastern Asia (%)
Place of birth for the foreign-born population - Armenia (%)
Place of birth for the foreign-born population - Iraq (%)
Place of birth for the foreign-born population - Israel (%)
Place of birth for the foreign-born population - Jordan (%)
Place of birth for the foreign-born population - Kuwait (%)
Place of birth for the foreign-born population - Lebanon (%)
Place of birth for the foreign-born population - Saudi Arabia (%)
Place of birth for the foreign-born population - Syria (%)
Place of birth for the foreign-born population - Turkey (%)
Place of birth for the foreign-born population - Yemen (%)
Place of birth for the foreign-born population - Other Western Asia (%)
Place of birth for the foreign-born population - Eritrea (%)
Place of birth for the foreign-born population - Ethiopia (%)
Place of birth for the foreign-born population - Kenya (%)
Place of birth for the foreign-born population - Somalia (%)
Place of birth for the foreign-born population - Uganda (%)
Place of birth for the foreign-born population - Zimbabwe (%)
Place of birth for the foreign-born population - Other Eastern Africa (%)
Place of birth for the foreign-born population - Cameroon (%)
Place of birth for the foreign-born population - Congo (%)
Place of birth for the foreign-born population - Democratic Republic of Congo (Zaire) (%)
Place of birth for the foreign-born population - Other Middle Africa (%)
Place of birth for the foreign-born population - Egypt (%)
Place of birth for the foreign-born population - Morocco (%)
Place of birth for the foreign-born population - Sudan (%)
Place of birth for the foreign-born population - Other Northern Africa (%)
Place of birth for the foreign-born population - South Africa (%)
Place of birth for the foreign-born population - Other Southern Africa (%)
Place of birth for the foreign-born population - Cabo Verde (%)
Place of birth for the foreign-born population - Ghana (%)
Place of birth for the foreign-born population - Liberia (%)
Place of birth for the foreign-born population - Nigeria (%)
Place of birth for the foreign-born population - Senegal (%)
Place of birth for the foreign-born population - Sierra Leone (%)
Place of birth for the foreign-born population - Other Western Africa (%)
Place of birth for the foreign-born population - Australia (%)
Place of birth for the foreign-born population - New Zealand (%)
Place of birth for the foreign-born population - Fiji (%)
Place of birth for the foreign-born population - Micronesia (%)
Place of birth for the foreign-born population - Bahamas (%)
Place of birth for the foreign-born population - Barbados (%)
Place of birth for the foreign-born population - Cuba (%)
Place of birth for the foreign-born population - Dominica (%)
Place of birth for the foreign-born population - Dominican Republic (%)
Place of birth for the foreign-born population - Grenada (%)
Place of birth for the foreign-born population - Haiti (%)
Place of birth for the foreign-born population - Jamaica (%)
Place of birth for the foreign-born population - St. Vincent and the Grenadines (%)
Place of birth for the foreign-born population - Trinidad and Tobago (%)
Place of birth for the foreign-born population - West Indies (%)
Place of birth for the foreign-born population - Other Caribbean (%)
Place of birth for the foreign-born population - Belize (%)
Place of birth for the foreign-born population - Costa Rica (%)
Place of birth for the foreign-born population - El Salvador (%)
Place of birth for the foreign-born population - Guatemala (%)
Place of birth for the foreign-born population - Honduras (%)
Place of birth for the foreign-born population - Mexico (%)
Place of birth for the foreign-born population - Nicaragua (%)
Place of birth for the foreign-born population - Panama (%)
Place of birth for the foreign-born population - Other Central America (%)
Place of birth for the foreign-born population - Argentina (%)
Place of birth for the foreign-born population - Bolivia (%)
Place of birth for the foreign-born population - Brazil (%)
Place of birth for the foreign-born population - Chile (%)
Place of birth for the foreign-born population - Colombia (%)
Place of birth for the foreign-born population - Ecuador (%)
Place of birth for the foreign-born population - Guyana (%)
Place of birth for the foreign-born population - Peru (%)
Place of birth for the foreign-born population - Uruguay (%)
Place of birth for the foreign-born population - Venezuela (%)
Place of birth for the foreign-born population - Other South America (%)
Place of birth for the foreign-born population - Canada (%)
Place of birth for the foreign-born population - Other Northern America (%)
Place of birth for the foreign-born population - Other (%)
Latest news about races in Redmond, WA collected exclusively by city-data.com from local newspapers, TV, and radio stations
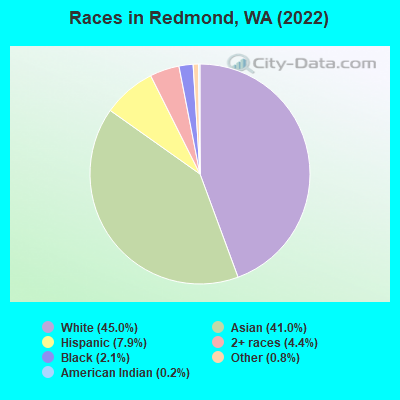
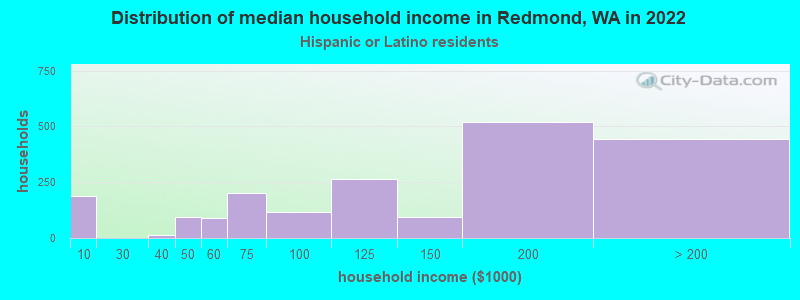
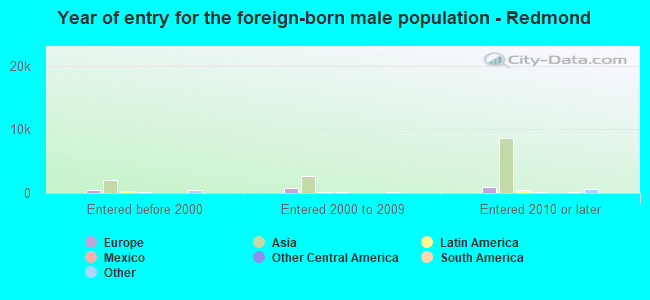
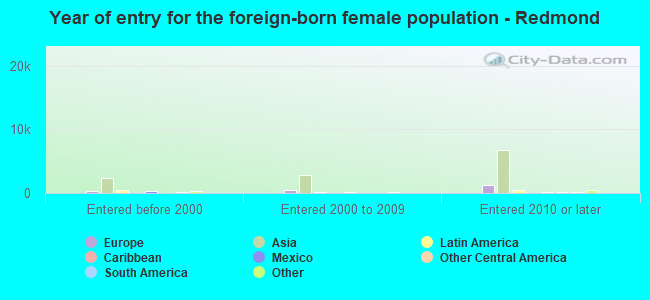
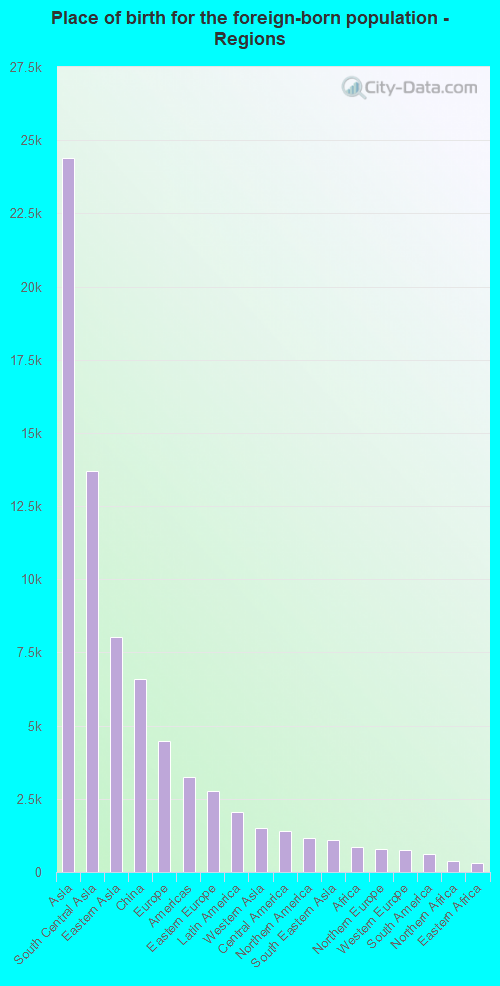
According to 2022 data, the most numerous races in Redmond, WA are White alone (33,350 residents), Hispanic (5,850 residents), and Asian alone (30,385 residents). 50.1% of Redmond residents speak English at home. 44.7% of Redmond, WA residents are foreign-born (31.6% born in Asia, 5.8% born in Europe), which is 66.4% greater than the foreign-born rate of 15.0% across the entire state of Washington.
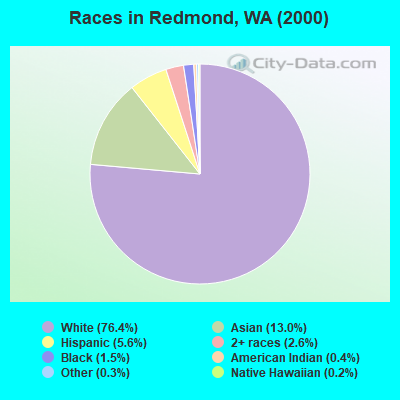
Race distribution in Redmond
2000 2022
4,652,490 78.9% White alone 441,509 7.5% Hispanic 319,401 5.4% Asian alone 184,631 3.1% Black alone 175,926 3.0% Two or more races 85,396 1.4% American Indian alone 22,779 0.4% Native Hawaiian and Other 11,989 0.2% Other race alone
4,941,456 63.5% White alone 1,093,313 14.0% Hispanic 755,832 9.7% Asian alone 523,448 6.7% Two or more races 299,537 3.8% Black alone 69,024 0.9% American Indian alone 52,231 0.7% Native Hawaiian and Other 50,945 0.7% Other race alone
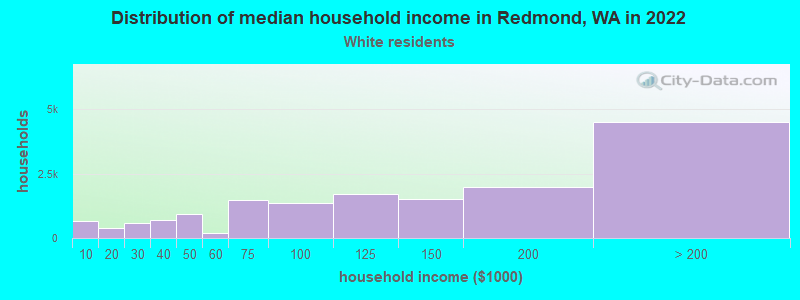
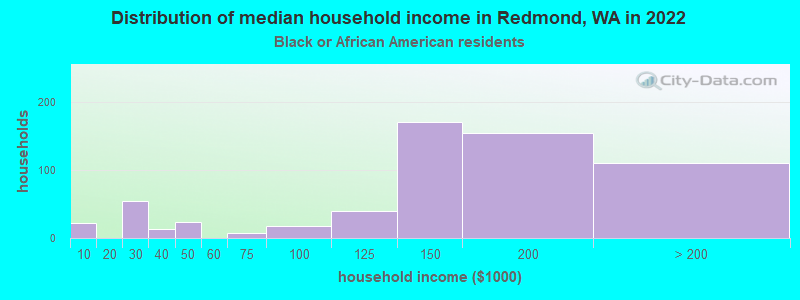
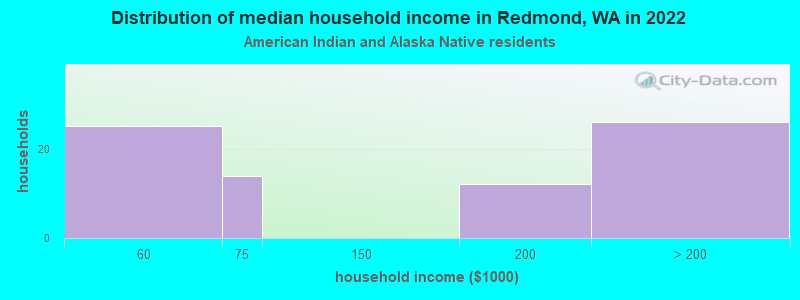
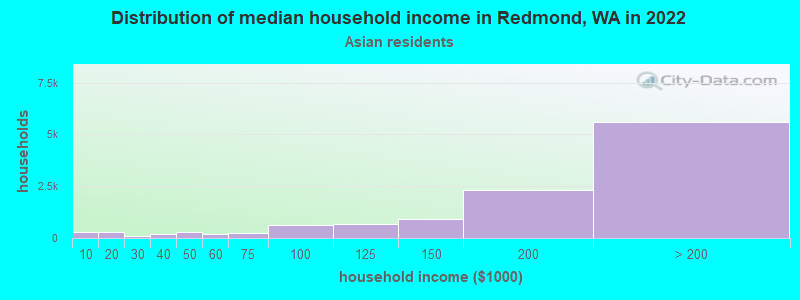
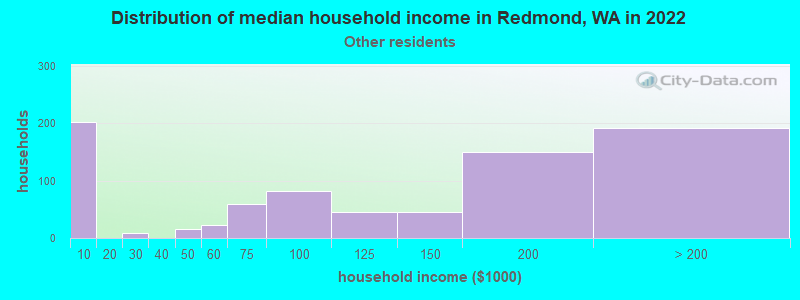
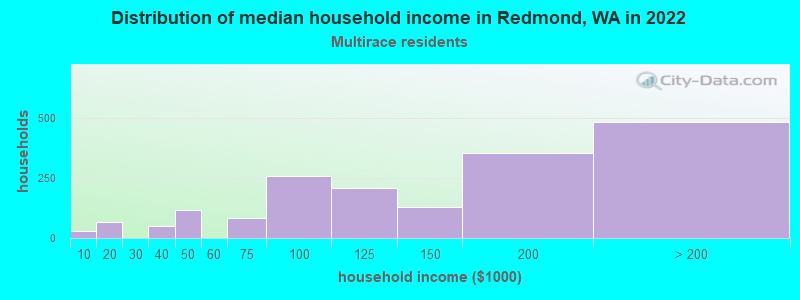
Income and house value in Redmond Median household income in 2022 $123,679 White non-Hispanic householders$175,410 Black householders$188,778 Asian householders$121,977 Some other race householders$154,208 Two or more races householders$152,777 Hispanic or Latino race householdersMedian 2022 house value over $1,000,000 White Non-Hispanic householdersover $1,000,000 Black or African American householdersover $1,000,000 American Indian or Alaska Native householders over $1,000,000 Asian householdersover $1,000,000 Native Hawaiian and other Pacific Islander householdersover $1,000,000 Some other race householdersover $1,000,000 Two or more races householdersover $1,000,000 Hispanic or Latino householders
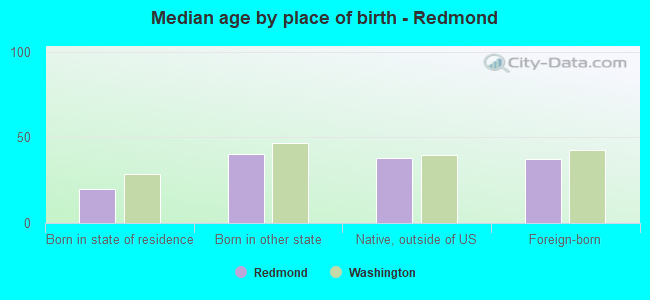
Median age by race in Redmond
39.0 Median age for White residents39.2 38.7 43.2 Median age for Black or African American residents43.3 27.5 50.7 Median age for American Indian / Alaska Native residents50.7 -666,666,666.0 34.0 Median age for Asian residents33.8 34.3 -666,666,666.0 Median age for Native Hawaiian / Pacific Islander residents-666,666,666.0 -666,666,666.0 32.4 Median age for Other race residents22.4 32.7 27.3 Median age for Two or more races residents27.6 24.9 38.7 Median age for White alone residents39.2 38.4 32.5 Median age for Hispanic or Latino residents33.4 32.4
Owner/renter occupied households by race in Redmond
House owners and renters - White residents 7,416 46.5% Owner occupied8,549 53.5% Renter occupiedHouse owners and renters - Black or African American residents 144 25.8% Owner occupied415 74.2% Renter occupiedHouse owners and renters - American Indian / Alaska Native residents 58 100.0% Owner occupiedHouse owners and renters - Asian residents 5,802 45.1% Owner occupied7,050 54.9% Renter occupiedHouse owners and renters - Native Hawaiian / Pacific Islander residents 22 100.0% Renter occupiedHouse owners and renters - Other race residents 196 28.1% Owner occupied500 71.9% Renter occupiedHouse owners and renters - Two or more races residents 765 30.0% Owner occupied1,785 70.0% Renter occupiedHouse owners and renters - White alone residents 7,331 47.0% Owner occupied8,283 53.0% Renter occupiedHouse owners and renters - Hispanic or Latino residents 525 21.1% Owner occupied1,967 78.9% Renter occupied
Language usage in Redmond
English speakers - Total 50.1% of residents of Redmond speak English at home.
5.1% of residents speak Spanish at home 2,795 75.3% Speak English very well917 24.7% Speak English less than very well44.7% of residents speak other language at home 26,465 81.8% Speak English very well5,894 18.2% Speak English less than very well
English speakers - Born in the United States 87.5% of residents of Redmond speak English at home.
2.6% of residents speak Spanish at home 478 87.2% Speak English very well70 12.8% Speak English less than very well9.9% of residents speak other language at home 1,777 84.9% Speak English very well317 15.1% Speak English less than very well
English speakers - Native, born elsewhere 67.3% of residents of Redmond speak English at home.
32.7% of residents speak other language at home 284 64.5% Speak English very well156 35.5% Speak English less than very well
English speakers - Foreign-born 12.1% of residents of Redmond speak English at home.
7.4% of residents speak Spanish at home 1,685 66.5% Speak English very well847 33.5% Speak English less than very well80.5% of residents speak other language at home 22,027 80.5% Speak English very well5,330 19.5% Speak English less than very well
White (Caucasian) - Speak only English Native:
95.8% (23,225)Foreign-born:
19.7% (1,512)
White (Caucasian) - Speak another language Native:
4.2% (1,025)Foreign-born:
80.3% (6,166)
Black or African American - Speak only English Native:
80.4% (970)Foreign-born:
11.4% (39)
Black or African American - Speak another language Native:
19.4% (235)Foreign-born:
87.9% (305)
American Indian / Alaska Native - Speak another language Native:
49.3% (114)Foreign-born:
100.0% (148)
Asian - Speak only English Native:
52.3% (3,373)Foreign-born:
9.4% (2,148)
Asian - Speak another language Native:
47.7% (3,080)Foreign-born:
90.6% (20,808)
Native Hawaiian / Pacific Islander - Speak only English Native:
86.4% (18)Foreign-born:
100.0% (22)
Other race - Speak only English Native:
66.5% (780)Foreign-born:
6.5% (42)
Other race - Speak another language Native:
34.7% (407)Foreign-born:
93.2% (605)
Two or more races - Speak only English Native:
70.6% (2,896)Foreign-born:
10.9% (201)
Two or more races - Speak another language Native:
29.4% (1,207)Foreign-born:
89.1% (1,636)
White alone - Speak only English Native:
95.7% (22,952)Foreign-born:
19.1% (1,431)
White alone - Speak another language Native:
4.3% (1,025)Foreign-born:
80.9% (6,053)
Hispanic or Latino - Speak only English Native:
58.9% (1,563)Foreign-born:
15.0% (434)
Hispanic or Latino - Speak another language Native:
41.1% (1,090)Foreign-born:
85.0% (2,458)
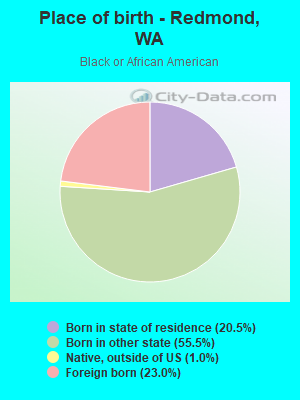
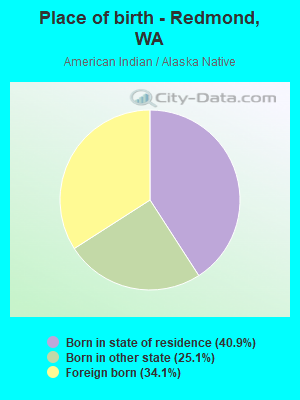
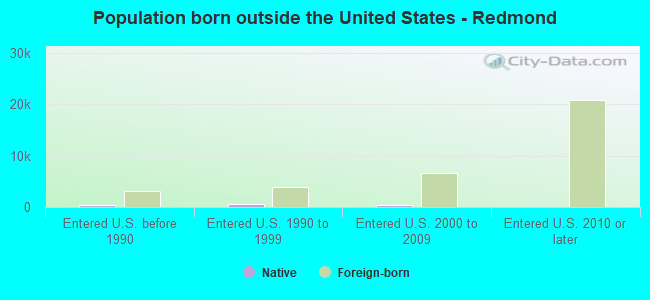
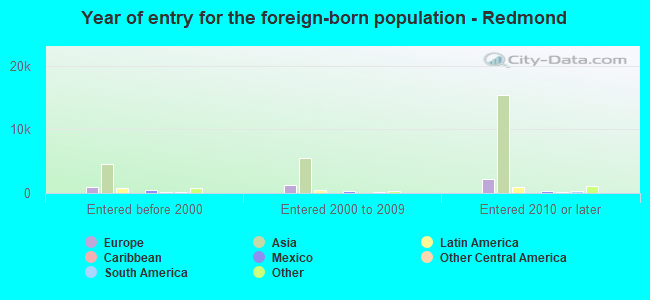
Foreign-born residents in Redmond 33,140 residents are foreign born (31.6% Asia , 5.8% Europe ).
This city:
44.7%Washington:
14.9%
Marital status for residents in Redmond Marital status - White (Caucasian) population 15 years and over
Males 46.7% Never married44.2% Now married0.0% Separated3.5% Widowed5.6% DivorcedFemales 33.3% Never married43.8% Now married0.0% Separated9.2% Widowed13.6% DivorcedWomen who gave birth in the past 12 months Now married:
100.0% (256)Unmarried:
0.0% (0)
Women who did not give birth in the past 12 months Now married:
37.7% (2,963)Unmarried:
62.3% (4,902)
Marital status - Black or African American population 15 years and over
Males 56.9% Never married31.8% Now married0.0% Separated0.0% Widowed11.3% DivorcedFemales 17.2% Never married62.7% Now married0.0% Separated2.7% Widowed17.4% DivorcedWomen who gave birth in the past 12 months Now married:
100.0% (35)Unmarried:
0.0% (0)
Women who did not give birth in the past 12 months Now married:
60.3% (240)Unmarried:
39.7% (158)
Marital status - American Indian / Alaska Native population 15 years and over
Males 36.8% Never married63.2% Now married0.0% Separated0.0% Widowed0.0% DivorcedFemales 14.8% Never married85.2% Now married0.0% Separated0.0% Widowed0.0% DivorcedWomen who did not give birth in the past 12 months Now married:
100.0% (41)Unmarried:
0.0% (0)
Marital status - Asian population 15 years and over
Males 24.3% Never married74.3% Now married0.1% Separated0.2% Widowed1.1% DivorcedFemales 16.9% Never married76.3% Now married0.7% Separated3.4% Widowed2.8% DivorcedWomen who gave birth in the past 12 months Now married:
100.0% (691)Unmarried:
0.0% (0)
Women who did not give birth in the past 12 months Now married:
72.1% (6,886)Unmarried:
27.9% (2,667)
Marital status - Native Hawaiian / Pacific Islander population 15 years and over
Males 0.0% Never married0.0% Now married100.0% Separated0.0% Widowed0.0% DivorcedFemales 0.0% Never married100.0% Now married0.0% Separated0.0% Widowed0.0% DivorcedMarital status - Other race population 15 years and over
Males 57.2% Never married40.9% Now married0.0% Separated0.0% Widowed2.0% DivorcedFemales 30.3% Never married53.5% Now married0.0% Separated9.6% Widowed6.5% DivorcedWomen who gave birth in the past 12 months Now married:
0.0% (0)Unmarried:
100.0% (47)
Women who did not give birth in the past 12 months Now married:
59.8% (246)Unmarried:
40.2% (165)
Marital status - Two or more races population 15 years and over
Males 55.7% Never married44.3% Now married0.0% Separated0.0% Widowed0.0% DivorcedFemales 45.2% Never married38.0% Now married0.1% Separated4.5% Widowed12.2% DivorcedWomen who gave birth in the past 12 months Now married:
100.0% (37)Unmarried:
0.0% (0)
Women who did not give birth in the past 12 months Now married:
36.9% (474)Unmarried:
63.1% (812)
Marital status - White alone, not Hispanic / Latino population 15 years and over
Males 46.1% Never married44.7% Now married0.0% Separated3.5% Widowed5.7% DivorcedFemales 33.3% Never married43.4% Now married0.0% Separated9.4% Widowed13.9% DivorcedWomen who gave birth in the past 12 months Now married:
100.0% (256)Unmarried:
0.0% (0)
Women who did not give birth in the past 12 months Now married:
37.0% (2,873)Unmarried:
63.0% (4,902)
Marital status - Hispanic or Latino population 15 years and over
Males 63.4% Never married36.2% Now married0.0% Separated0.3% Widowed0.0% DivorcedFemales 50.1% Never married28.7% Now married0.0% Separated2.4% Widowed18.9% DivorcedWomen who gave birth in the past 12 months Now married:
72.3% (103)Unmarried:
27.7% (40)
Women who did not give birth in the past 12 months Now married:
52.5% (754)Unmarried:
47.5% (683)
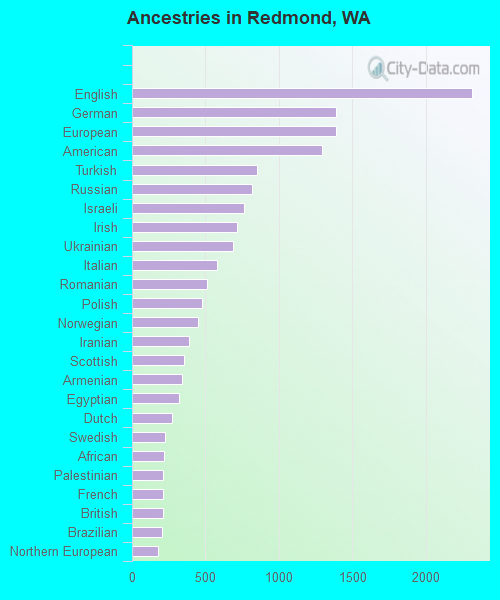
Ancestries in Redmond
2,314 4.9% English1,391 2.9% German1,388 2.9% European1,292 2.7% American851 1.8% Turkish816 1.7% Russian762 1.6% Israeli715 1.5% Irish690 1.4% Ukrainian580 1.2% Italian511 1.1% Romanian474 1.0% Polish446 0.9% Norwegian390 0.8% Iranian351 0.7% Scottish343 0.7% Armenian317 0.7% Egyptian269 0.6% Dutch224 0.5% Swedish215 0.5% African210 0.4% Palestinian209 0.4% French208 0.4% British202 0.4% Brazilian178 0.4% Northern European172 0.4% Iraqi157 0.3% Eastern European151 0.3% Belgian136 0.3% Czech133 0.3% Ethiopian130 0.3% Scotch-Irish123 0.3% Syrian91 0.2% Canadian84 0.2% Scandinavian68 0.1% Slovak67 0.1% Bulgarian63 0.1% Welsh61 0.1% Kenyan61 0.1% Sudanese44 0.09% Lebanese39 0.08% French Canadian32 0.07% Austrian31 0.07% Nigerian29 0.06% Greek28 0.06% Swiss23 0.05% Slavic23 0.05% Slovene19 0.04% Hungarian18 0.04% Moroccan17 0.04% Estonian17 0.04% Portuguese17 0.04% Australian15 0.03% Latvian15 0.03% South African13 0.03% Finnish12 0.03% New Zealander5 0.01% Czechoslovakian5 0.01% Lithuanian
Geographical mobility in Redmond Same house 1 year ago 27,556 83.3% White (Caucasian)1,257 76.1% Black or African American420 96.7% American Indian / Alaska Native24,298 77.8% Asian41 100.0% Native Hawaiian / Pacific Islander1,329 69.8% Other race4,573 72.8% Two or more races27,170 83.3% White alone, not Hispanic / Latino4,197 73.9% Hispanic or LatinoMoved within same county 3,114 9.4% White / Caucasian179 10.9% Black or African American3,063 9.8% Asian261 13.7% Other race653 10.4% Two or more races3,033 9.3% White alone, not Hispanic / Latino385 6.8% Hispanic or LatinoMoved within same state 269 0.8% White / Caucasian91 5.5% Black or African American86 4.5% Other race256 4.1% Two or more races269 0.8% White alone, not Hispanic / Latino302 5.3% Hispanic or LatinoMoved from different state 1,657 5.0% White / Caucasian73 4.4% Black or African American1,766 5.7% Asian257 13.5% Other race199 3.2% Two or more races1,657 5.1% White alone, not Hispanic / Latino593 10.4% Hispanic or LatinoMoved from abroad 480 1.5% White68 4.1% Black or African American2,095 6.7% Asian32 1.7% Other race604 9.6% Two or more races480 1.5% White alone, not Hispanic / Latino199 3.5% Hispanic or Latino
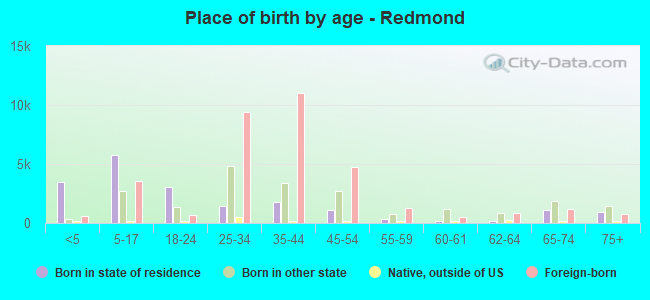
Children Nativity (place of birth) in Redmond
Children under 6 years - Living with two parents Both parents native 515 100.0% NativeBoth parents foreign-born 2,818 81.5% Native638 18.5% Foreign-bornOne native, one foreign-born parent 339 100.0% NativeChildren under 6 years - Living with one parent Native parent 186 100.0% NativeForeign-born parent 381 100.0% NativeChildren 6 to 17 years - Living with two parents Both parents native 1,305 100.0% NativeBoth parents foreign-born 3,972 62.6% Native2,371 37.4% Foreign-bornOne native, one foreign-born parent 995 100.0% NativeChildren 6 to 17 years - Living with one parent Native parent 809 100.0% Foreign-bornForeign-born parent 1,449 81.9% Native320 18.1% Foreign-born
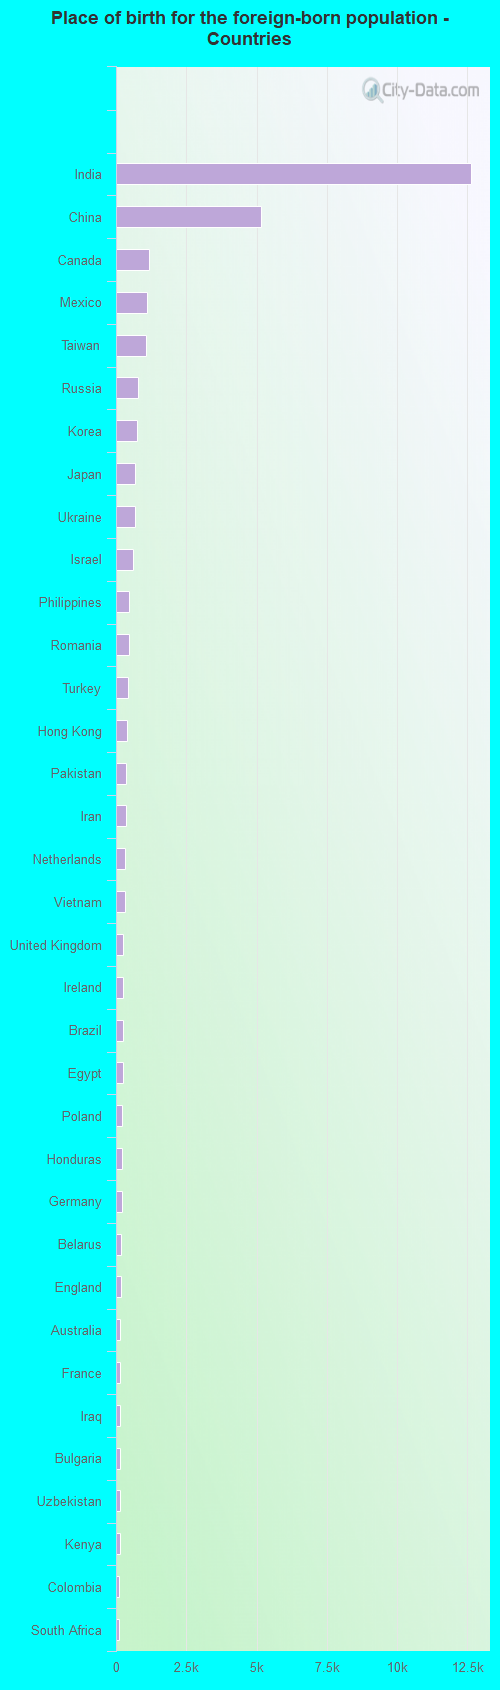
Place of birth for residents in Redmond 24,393 Asia13,686 South Central Asia8,023 Eastern Asia6,577 China4,467 Europe3,229 Americas2,778 Eastern Europe2,055 Latin America1,513 Western Asia1,413 Central America1,174 Northern America1,079 South Eastern Asia865 Africa788 Northern Europe752 Western Europe628 South America380 Northern Africa319 Eastern Africa184 Oceania184 Australia and New Zealand Subregion147 Southern Europe143 Southern Africa20 Western Africa13 Caribbean12,633 India5,143 China1,174 Canada1,089 Mexico1,055 Taiwan788 Russia733 Korea680 Japan659 Ukraine594 Israel454 Philippines448 Romania423 Turkey378 Hong Kong370 Pakistan355 Iran325 Netherlands309 Vietnam249 United Kingdom242 Ireland235 Brazil235 Egypt230 Poland218 Honduras209 Germany183 Belarus174 England147 Australia146 France145 Iraq140 Bulgaria136 Uzbekistan125 Kenya124 Colombia124 South Africa109 Ethiopia107 Singapore105 Malaysia105 Argentina90 El Salvador89 Syria87 Scotland83 Italy78 Lebanon71 Peru63 Kazakhstan58 Spain56 Latvia53 Morocco52 Nepal44 Tanzania42 Czechoslovakia40 Sudan37 United Arab Emirates37 Armenia37 Azerbaijan37 Ecuador36 New Zealand35 Thailand35 Lithuania30 Cambodia30 Chile29 Zimbabwe28 Saudi Arabia24 Sweden24 Moldova23 Belgium22 Venezuela18 Laos18 Austria17 Indonesia16 Sri Lanka15 Guatemala13 Jamaica11 Denmark11 Uganda11 Algeria11 Kuwait7 Switzerland5 Greece
Grandparents responsible for own grandchildren in Redmond
Grandparents (30 to 59 years) White / Caucasian 12 10.4% Responsible for grandchildren100 89.6% Not responsible for grandchildrenAsian 8 100.0% Responsible for grandchildrenWhite alone, not Hispanic / Latino 12 19.3% Responsible for grandchildren48 80.7% Not responsible for grandchildrenHispanic or Latino 47 100.0% Not responsible for grandchildrenGrandparents (60 years and over) White / Caucasian 18 12.1% Responsible for grandchildren131 87.9% Not responsible for grandchildrenAsian 4 1.5% Responsible for grandchildren256 98.5% Not responsible for grandchildrenWhite alone, not Hispanic / Latino 18 12.6% Responsible for grandchildren125 87.4% Not responsible for grandchildrenHispanic or Latino 34 100.0% Not responsible for grandchildren