Races in Renton, Washington (WA) Detailed Stats
Data:
Races - White alone (%)
Races - White alone (% change since 2000)
Races - Black alone (%)
Races - Black alone (% change since 2000)
Races - American Indian alone (%)
Races - American Indian alone (% change since 2000)
Races - Asian alone (%)
Races - Asian alone (% change since 2000)
Races - Hispanic (%)
Races - Hispanic (% change since 2000)
Races - Native Hawaiian and Other Pacific Islander alone (%)
Races - Native Hawaiian and Other Pacific Islander alone (% change since 2000)
Races - Two or more races(%)
Races - Two or more races(% change since 2000)
Races - Other race alone (%)
Races - Other race alone (% change since 2000)
Racial diversity
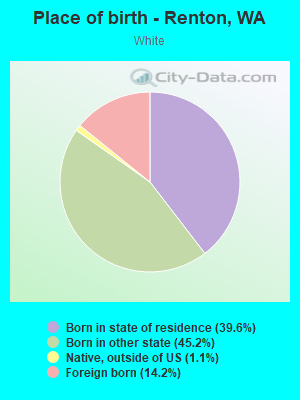
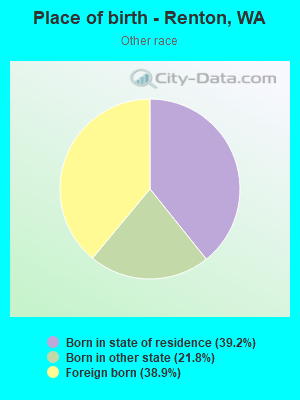
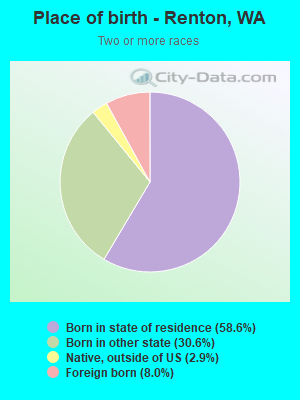
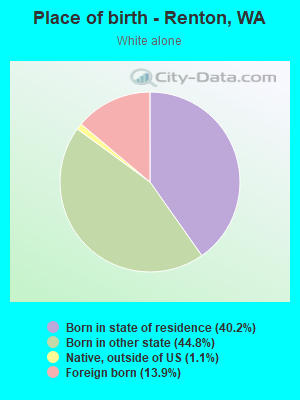
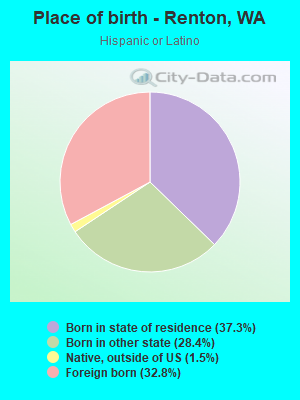
Place of birth - Born in state of residence (%)
Place of birth - Born in state of residence (%) - White
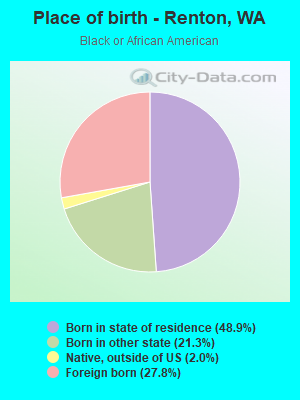
Place of birth - Born in state of residence (%) - Black or African American
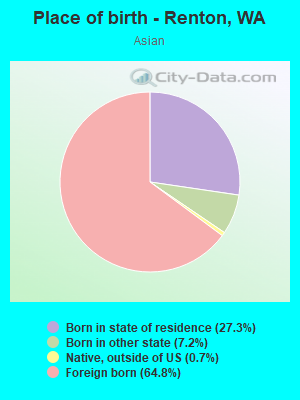
Place of birth - Born in state of residence (%) - Asian
Place of birth - Born in state of residence (%) - Hispanic or Latino
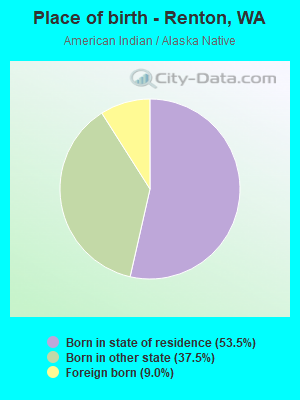
Place of birth - Born in state of residence (%) - American Indian and Alaska Native
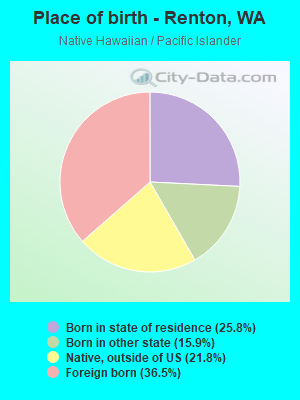
Place of birth - Born in state of residence (%) - Multirace
Place of birth - Born in state of residence (%) - Other Race
Place of birth - Born in other state (%)
Place of birth - Born in other state (%) - White
Place of birth - Born in other state (%) - Black or African American
Place of birth - Born in other state (%) - Asian
Place of birth - Born in other state (%) - Hispanic or Latino
Place of birth - Born in other state (%) - American Indian and Alaska Native
Place of birth - Born in other state (%) - Multirace
Place of birth - Born in other state (%) - Other Race
Place of birth - Native, outside of US (%)
Place of birth - Native, outside of US (%) - White
Place of birth - Native, outside of US (%) - Black or African American
Place of birth - Native, outside of US (%) - Asian
Place of birth - Native, outside of US (%) - Hispanic or Latino
Place of birth - Native, outside of US (%) - American Indian and Alaska Native
Place of birth - Native, outside of US (%) - Multirace
Place of birth - Native, outside of US (%) - Other Race
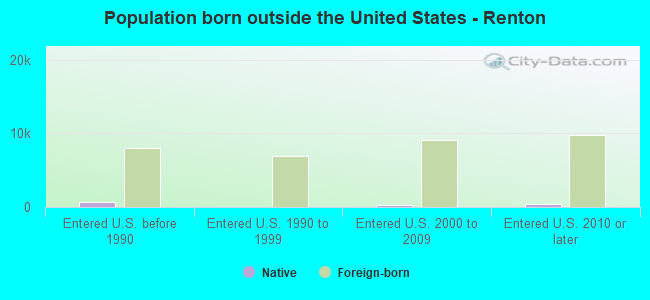
Place of birth - Foreign born (%)
Place of birth - Foreign born (%) - White
Place of birth - Foreign born (%) - Black or African American
Place of birth - Foreign born (%) - Asian
Place of birth - Foreign born (%) - Hispanic or Latino
Place of birth - Foreign born (%) - American Indian and Alaska Native
Place of birth - Foreign born (%) - Multirace
Place of birth - Foreign born (%) - Other Race
Residents speaking English at home (%)
Residents speaking English at home - Born in the United States (%)
Residents speaking English at home - Native, born elsewhere (%)
Residents speaking English at home - Foreign born (%)
Residents speaking Spanish at home (%)
Residents speaking Spanish at home - Born in the United States (%)
Residents speaking Spanish at home - Native, born elsewhere (%)
Residents speaking Spanish at home - Foreign born (%)
Residents speaking other language at home (%)
Residents speaking other language at home - Born in the United States (%)
Residents speaking other language at home - Native, born elsewhere (%)
Residents speaking other language at home - Foreign born (%)
Marital status - Never married (%)
Marital status - Now married (%)
Marital status - Separated (%)
Marital status - Widowed (%)
Marital status - Divorced (%)
Ancestries Reported - Arab (%)
Ancestries Reported - Czech (%)
Ancestries Reported - Danish (%)
Ancestries Reported - Dutch (%)
Ancestries Reported - English (%)
Ancestries Reported - French (%)
Ancestries Reported - French Canadian (%)
Ancestries Reported - German (%)
Ancestries Reported - Greek (%)
Ancestries Reported - Hungarian (%)
Ancestries Reported - Irish (%)
Ancestries Reported - Italian (%)
Ancestries Reported - Lithuanian (%)
Ancestries Reported - Norwegian (%)
Ancestries Reported - Polish (%)
Ancestries Reported - Portuguese (%)
Ancestries Reported - Russian (%)
Ancestries Reported - Scotch-Irish (%)
Ancestries Reported - Scottish (%)
Ancestries Reported - Slovak (%)
Ancestries Reported - Subsaharan African (%)
Ancestries Reported - Swedish (%)
Ancestries Reported - Swiss (%)
Ancestries Reported - Ukrainian (%)
Ancestries Reported - United States (%)
Ancestries Reported - Welsh (%)
Ancestries Reported - West Indian (%)
Ancestries Reported - Other (%)
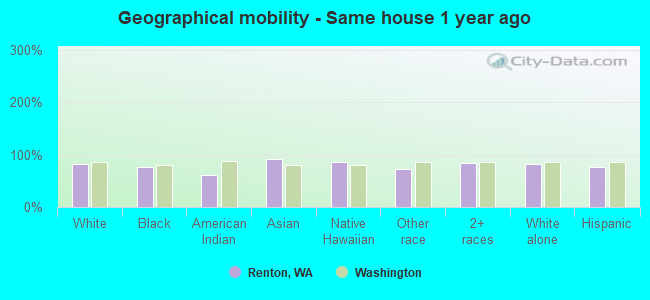
Geographical mobility - Same house 1 year ago (%)
Geographical mobility - Same house 1 year ago (%) - White
Geographical mobility - Same house 1 year ago (%) - Black or African American
Geographical mobility - Same house 1 year ago (%) - Asian
Geographical mobility - Same house 1 year ago (%) - Hispanic or Latino
Geographical mobility - Same house 1 year ago (%) - American Indian and Alaska Native
Geographical mobility - Same house 1 year ago (%) - Multirace
Geographical mobility - Same house 1 year ago (%) - Other Race
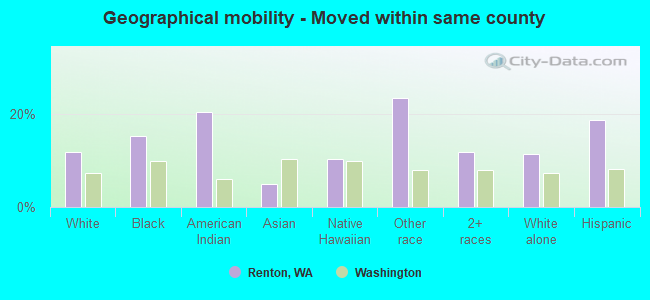
Geographical mobility - Moved within same county (%)
Geographical mobility - Moved within same county (%) - White
Geographical mobility - Moved within same county (%) - Black or African American
Geographical mobility - Moved within same county (%) - Asian
Geographical mobility - Moved within same county (%) - Hispanic or Latino
Geographical mobility - Moved within same county (%) - American Indian and Alaska Native
Geographical mobility - Moved within same county (%) - Multirace
Geographical mobility - Moved within same county (%) - Other Race
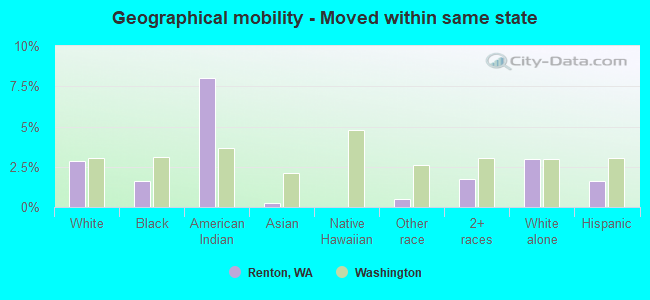
Geographical mobility - Moved from different county within same state (%)
Geographical mobility - Moved from different county within same state (%) - White
Geographical mobility - Moved from different county within same state (%) - Black or African American
Geographical mobility - Moved from different county within same state (%) - Asian
Geographical mobility - Moved from different county within same state (%) - Hispanic or Latino
Geographical mobility - Moved from different county within same state (%) - American Indian and Alaska Native
Geographical mobility - Moved from different county within same state (%) - Multirace
Geographical mobility - Moved from different county within same state (%) - Other Race
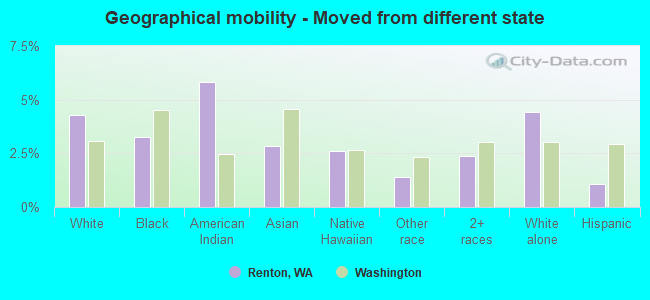
Geographical mobility - Moved from different state (%)
Geographical mobility - Moved from different state (%) - White
Geographical mobility - Moved from different state (%) - Black or African American
Geographical mobility - Moved from different state (%) - Asian
Geographical mobility - Moved from different state (%) - Hispanic or Latino
Geographical mobility - Moved from different state (%) - American Indian and Alaska Native
Geographical mobility - Moved from different state (%) - Multirace
Geographical mobility - Moved from different state (%) - Other Race
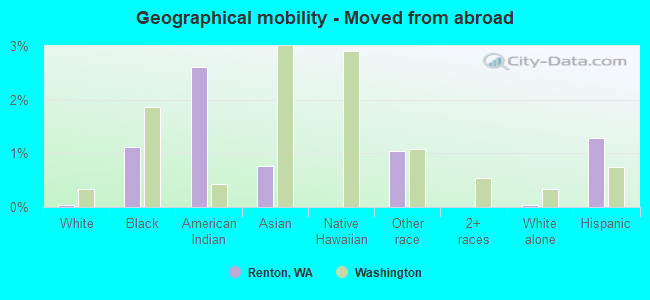
Geographical mobility - Moved from abroad (%)
Geographical mobility - Moved from abroad (%) - White
Geographical mobility - Moved from abroad (%) - Black or African American
Geographical mobility - Moved from abroad (%) - Asian
Geographical mobility - Moved from abroad (%) - Hispanic or Latino
Geographical mobility - Moved from abroad (%) - American Indian and Alaska Native
Geographical mobility - Moved from abroad (%) - Multirace
Geographical mobility - Moved from abroad (%) - Other Race
Place of birth for the foreign-born population - Ireland (%)
Place of birth for the foreign-born population - Denmark (%)
Place of birth for the foreign-born population - Norway (%)
Place of birth for the foreign-born population - Sweden (%)
Place of birth for the foreign-born population - United Kingdom (%)
Place of birth for the foreign-born population - England (%)
Place of birth for the foreign-born population - Scotland (%)
Place of birth for the foreign-born population - Other Northern Europe (%)
Place of birth for the foreign-born population - Austria (%)
Place of birth for the foreign-born population - Belgium (%)
Place of birth for the foreign-born population - France (%)
Place of birth for the foreign-born population - Germany (%)
Place of birth for the foreign-born population - Netherlands (%)
Place of birth for the foreign-born population - Switzerland (%)
Place of birth for the foreign-born population - Other Western Europe (%)
Place of birth for the foreign-born population - Greece (%)
Place of birth for the foreign-born population - Italy (%)
Place of birth for the foreign-born population - Portugal (%)
Place of birth for the foreign-born population - Spain (%)
Place of birth for the foreign-born population - Other Southern Europe (%)
Place of birth for the foreign-born population - Albania (%)
Place of birth for the foreign-born population - Belarus (%)
Place of birth for the foreign-born population - Bosnia and Herzegovina (%)
Place of birth for the foreign-born population - Bulgaria (%)
Place of birth for the foreign-born population - Croatia (%)
Place of birth for the foreign-born population - Czechoslovakia (%)
Place of birth for the foreign-born population - Hungary (%)
Place of birth for the foreign-born population - Latvia (%)
Place of birth for the foreign-born population - Lithuania (%)
Place of birth for the foreign-born population - North Macedonia (Macedonia) (%)
Place of birth for the foreign-born population - Moldova (%)
Place of birth for the foreign-born population - Poland (%)
Place of birth for the foreign-born population - Romania (%)
Place of birth for the foreign-born population - Russia (%)
Place of birth for the foreign-born population - Serbia (%)
Place of birth for the foreign-born population - Ukraine (%)
Place of birth for the foreign-born population - Other Eastern Europe (%)
Place of birth for the foreign-born population - China (%)
Place of birth for the foreign-born population - Hong Kong (%)
Place of birth for the foreign-born population - Taiwan (%)
Place of birth for the foreign-born population - Japan (%)
Place of birth for the foreign-born population - Korea (%)
Place of birth for the foreign-born population - Other Eastern Asia (%)
Place of birth for the foreign-born population - Afghanistan (%)
Place of birth for the foreign-born population - Bangladesh (%)
Place of birth for the foreign-born population - India (%)
Place of birth for the foreign-born population - Iran (%)
Place of birth for the foreign-born population - Kazakhstan (%)
Place of birth for the foreign-born population - Nepal (%)
Place of birth for the foreign-born population - Pakistan (%)
Place of birth for the foreign-born population - Sri Lanka (%)
Place of birth for the foreign-born population - Uzbekistan (%)
Place of birth for the foreign-born population - Other South Central Asia (%)
Place of birth for the foreign-born population - Burma (%)
Place of birth for the foreign-born population - Cambodia (%)
Place of birth for the foreign-born population - Indonesia (%)
Place of birth for the foreign-born population - Laos (%)
Place of birth for the foreign-born population - Malaysia (%)
Place of birth for the foreign-born population - Philippines (%)
Place of birth for the foreign-born population - Singapore (%)
Place of birth for the foreign-born population - Thailand (%)
Place of birth for the foreign-born population - Vietnam (%)
Place of birth for the foreign-born population - Other South Eastern Asia (%)
Place of birth for the foreign-born population - Armenia (%)
Place of birth for the foreign-born population - Iraq (%)
Place of birth for the foreign-born population - Israel (%)
Place of birth for the foreign-born population - Jordan (%)
Place of birth for the foreign-born population - Kuwait (%)
Place of birth for the foreign-born population - Lebanon (%)
Place of birth for the foreign-born population - Saudi Arabia (%)
Place of birth for the foreign-born population - Syria (%)
Place of birth for the foreign-born population - Turkey (%)
Place of birth for the foreign-born population - Yemen (%)
Place of birth for the foreign-born population - Other Western Asia (%)
Place of birth for the foreign-born population - Eritrea (%)
Place of birth for the foreign-born population - Ethiopia (%)
Place of birth for the foreign-born population - Kenya (%)
Place of birth for the foreign-born population - Somalia (%)
Place of birth for the foreign-born population - Uganda (%)
Place of birth for the foreign-born population - Zimbabwe (%)
Place of birth for the foreign-born population - Other Eastern Africa (%)
Place of birth for the foreign-born population - Cameroon (%)
Place of birth for the foreign-born population - Congo (%)
Place of birth for the foreign-born population - Democratic Republic of Congo (Zaire) (%)
Place of birth for the foreign-born population - Other Middle Africa (%)
Place of birth for the foreign-born population - Egypt (%)
Place of birth for the foreign-born population - Morocco (%)
Place of birth for the foreign-born population - Sudan (%)
Place of birth for the foreign-born population - Other Northern Africa (%)
Place of birth for the foreign-born population - South Africa (%)
Place of birth for the foreign-born population - Other Southern Africa (%)
Place of birth for the foreign-born population - Cabo Verde (%)
Place of birth for the foreign-born population - Ghana (%)
Place of birth for the foreign-born population - Liberia (%)
Place of birth for the foreign-born population - Nigeria (%)
Place of birth for the foreign-born population - Senegal (%)
Place of birth for the foreign-born population - Sierra Leone (%)
Place of birth for the foreign-born population - Other Western Africa (%)
Place of birth for the foreign-born population - Australia (%)
Place of birth for the foreign-born population - New Zealand (%)
Place of birth for the foreign-born population - Fiji (%)
Place of birth for the foreign-born population - Micronesia (%)
Place of birth for the foreign-born population - Bahamas (%)
Place of birth for the foreign-born population - Barbados (%)
Place of birth for the foreign-born population - Cuba (%)
Place of birth for the foreign-born population - Dominica (%)
Place of birth for the foreign-born population - Dominican Republic (%)
Place of birth for the foreign-born population - Grenada (%)
Place of birth for the foreign-born population - Haiti (%)
Place of birth for the foreign-born population - Jamaica (%)
Place of birth for the foreign-born population - St. Vincent and the Grenadines (%)
Place of birth for the foreign-born population - Trinidad and Tobago (%)
Place of birth for the foreign-born population - West Indies (%)
Place of birth for the foreign-born population - Other Caribbean (%)
Place of birth for the foreign-born population - Belize (%)
Place of birth for the foreign-born population - Costa Rica (%)
Place of birth for the foreign-born population - El Salvador (%)
Place of birth for the foreign-born population - Guatemala (%)
Place of birth for the foreign-born population - Honduras (%)
Place of birth for the foreign-born population - Mexico (%)
Place of birth for the foreign-born population - Nicaragua (%)
Place of birth for the foreign-born population - Panama (%)
Place of birth for the foreign-born population - Other Central America (%)
Place of birth for the foreign-born population - Argentina (%)
Place of birth for the foreign-born population - Bolivia (%)
Place of birth for the foreign-born population - Brazil (%)
Place of birth for the foreign-born population - Chile (%)
Place of birth for the foreign-born population - Colombia (%)
Place of birth for the foreign-born population - Ecuador (%)
Place of birth for the foreign-born population - Guyana (%)
Place of birth for the foreign-born population - Peru (%)
Place of birth for the foreign-born population - Uruguay (%)
Place of birth for the foreign-born population - Venezuela (%)
Place of birth for the foreign-born population - Other South America (%)
Place of birth for the foreign-born population - Canada (%)
Place of birth for the foreign-born population - Other Northern America (%)
Place of birth for the foreign-born population - Other (%)
Latest news about races in Renton, WA collected exclusively by city-data.com from local newspapers, TV, and radio stations
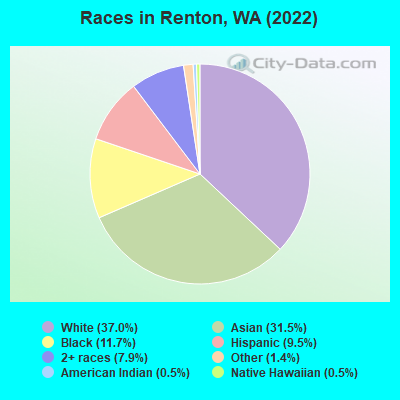
According to 2022 data, the most numerous races in Renton, WA are White alone (38,490 residents), Hispanic (9,928 residents), and Asian alone (32,728 residents). 58.6% of Renton residents speak English at home. 29.6% of Renton, WA residents are foreign-born (17.2% born in Asia, 5.7% born in Latin America), which is 49.3% greater than the foreign-born rate of 15.0% across the entire state of Washington.
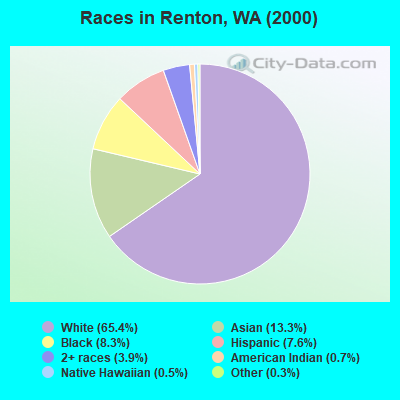
Race distribution in Renton
2000 2022
32,759 65.4% White alone 6,658 13.3% Asian alone 4,142 8.3% Black alone 3,818 7.6% Hispanic 1,949 3.9% Two or more races 335 0.7% American Indian alone 238 0.5% Native Hawaiian and Other 153 0.3% Other race alone
38,490 37.0% White alone 32,728 31.5% Asian alone 12,189 11.7% Black alone 9,928 9.5% Hispanic 8,252 7.9% Two or more races 1,413 1.4% Other race alone 566 0.5% American Indian alone 494 0.5% Native Hawaiian and Other
2000 2022
4,652,490 78.9% White alone 441,509 7.5% Hispanic 319,401 5.4% Asian alone 184,631 3.1% Black alone 175,926 3.0% Two or more races 85,396 1.4% American Indian alone 22,779 0.4% Native Hawaiian and Other 11,989 0.2% Other race alone
4,941,456 63.5% White alone 1,093,313 14.0% Hispanic 755,832 9.7% Asian alone 523,448 6.7% Two or more races 299,537 3.8% Black alone 69,024 0.9% American Indian alone 52,231 0.7% Native Hawaiian and Other 50,945 0.7% Other race alone
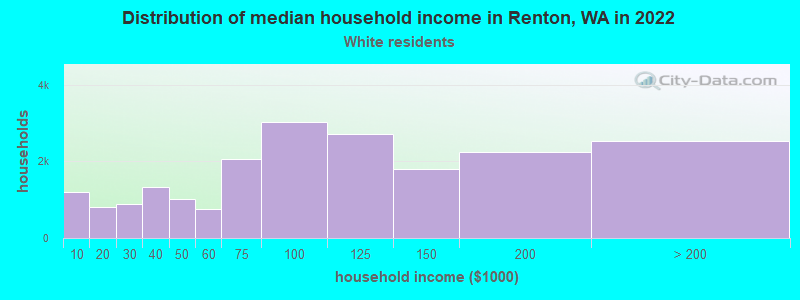
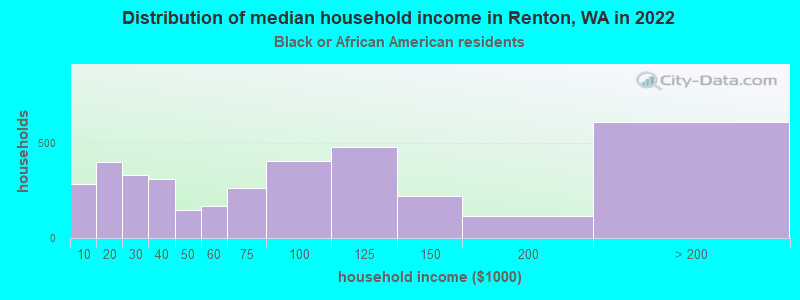
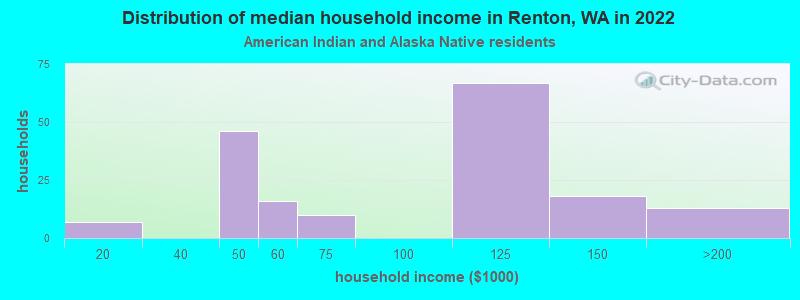
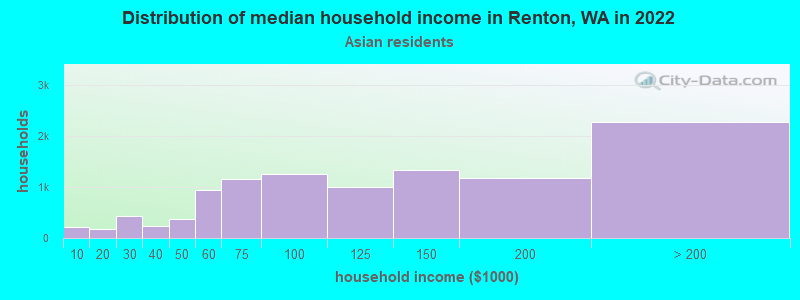
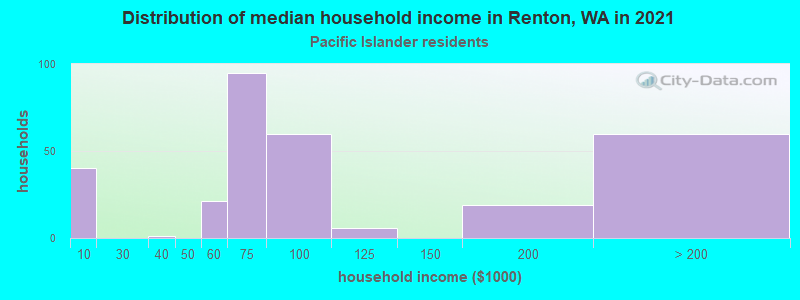
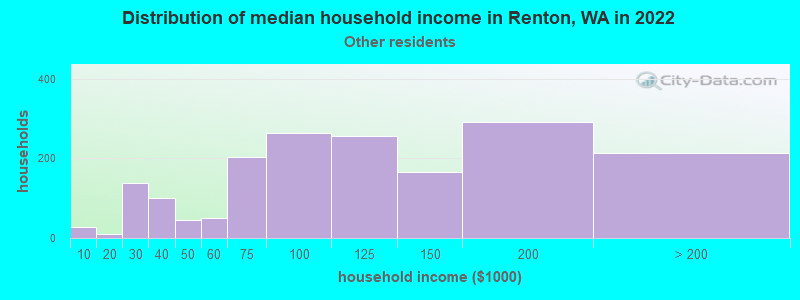
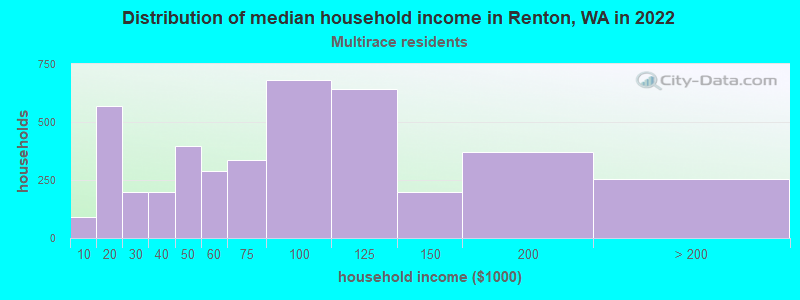
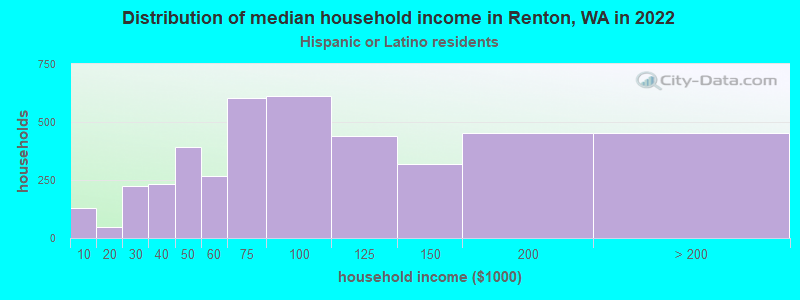
Income and house value in Renton Median household income in 2022 $93,177 White non-Hispanic householders$55,682 Black householders$143,889 American Indian and Alaska Native householders$122,211 Asian householders$152,938 Some other race householders$55,633 Two or more races householders$125,973 Hispanic or Latino race householdersMedian 2022 house value $678,150 White Non-Hispanic householders$690,113 Black or African American householders$420,572 American Indian or Alaska Native householders $732,731 Asian householders$841,145 Native Hawaiian and other Pacific Islander householders$643,756 Some other race householders$740,208 Two or more races householders$625,438 Hispanic or Latino householders
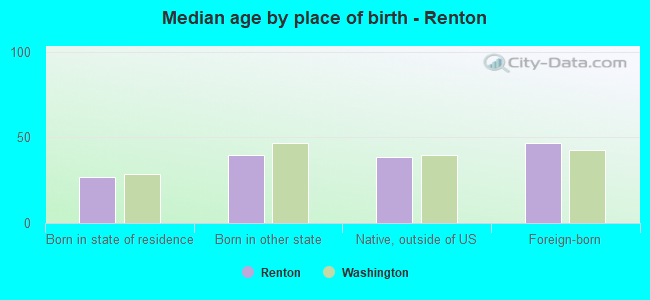
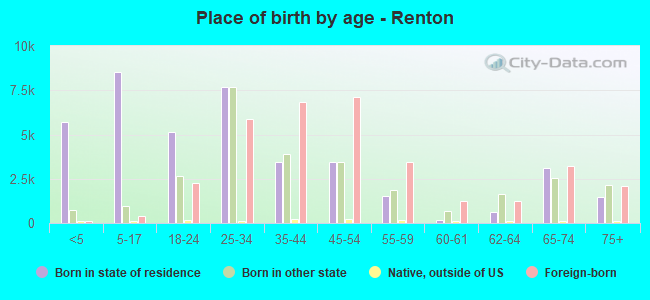
Median age by race in Renton
42.8 Median age for White residents41.4 43.6 33.2 Median age for Black or African American residents36.7 31.5 35.5 Median age for American Indian / Alaska Native residents22.3 38.8 39.3 Median age for Asian residents38.5 40.3 50.1 Median age for Native Hawaiian / Pacific Islander residents-666,666,666.0 -666,666,666.0 29.8 Median age for Other race residents28.9 31.0 28.5 Median age for Two or more races residents28.9 23.9 43.6 Median age for White alone residents42.2 43.9 29.2 Median age for Hispanic or Latino residents29.3 26.6
Owner/renter occupied households by race in Renton
House owners and renters - White residents 11,976 58.9% Owner occupied8,358 41.1% Renter occupiedHouse owners and renters - Black or African American residents 1,213 24.4% Owner occupied3,757 75.6% Renter occupiedHouse owners and renters - American Indian / Alaska Native residents 35 14.4% Owner occupied209 85.6% Renter occupiedHouse owners and renters - Asian residents 8,651 79.2% Owner occupied2,278 20.8% Renter occupiedHouse owners and renters - Native Hawaiian / Pacific Islander residents 94 35.7% Owner occupied169 64.3% Renter occupiedHouse owners and renters - Other race residents 674 46.0% Owner occupied790 54.0% Renter occupiedHouse owners and renters - Two or more races residents 1,904 42.2% Owner occupied2,607 57.8% Renter occupiedHouse owners and renters - White alone residents 11,916 60.5% Owner occupied7,784 39.5% Renter occupiedHouse owners and renters - Hispanic or Latino residents 1,337 46.0% Owner occupied1,568 54.0% Renter occupied
Language usage in Renton
English speakers - Total 58.6% of residents of Renton speak English at home.
6.9% of residents speak Spanish at home 3,989 59.5% Speak English very well2,717 40.5% Speak English less than very well34.5% of residents speak other language at home 17,319 51.4% Speak English very well16,369 48.6% Speak English less than very well
English speakers - Born in the United States 90.9% of residents of Renton speak English at home.
3.9% of residents speak Spanish at home 1,032 95.3% Speak English very well51 4.7% Speak English less than very well5.2% of residents speak other language at home 1,290 90.8% Speak English very well131 9.2% Speak English less than very well
English speakers - Native, born elsewhere 64.3% of residents of Renton speak English at home.
12.5% of residents speak Spanish at home 148 100.0% Speak English very well23.2% of residents speak other language at home 239 86.9% Speak English very well36 13.1% Speak English less than very well
English speakers - Foreign-born 11.4% of residents of Renton speak English at home.
9.2% of residents speak Spanish at home 877 28.1% Speak English very well2,241 71.9% Speak English less than very well79.4% of residents speak other language at home 11,441 42.7% Speak English very well15,343 57.3% Speak English less than very well
White (Caucasian) - Speak only English Native:
93.5% (30,497)Foreign-born:
19.5% (1,100)
White (Caucasian) - Speak another language Native:
6.5% (2,135)Foreign-born:
80.5% (4,531)
Black or African American - Speak only English Native:
95.8% (6,081)Foreign-born:
21.9% (424)
Black or African American - Speak another language Native:
4.5% (286)Foreign-born:
79.1% (1,530)
American Indian / Alaska Native - Speak another language Native:
51.7% (350)Foreign-born:
100.0% (152)
Asian - Speak only English Native:
57.6% (5,863)Foreign-born:
8.5% (1,819)
Asian - Speak another language Native:
42.4% (4,314)Foreign-born:
91.5% (19,464)
Native Hawaiian / Pacific Islander - Speak another language Native:
43.9% (243)Foreign-born:
95.7% (321)
Other race - Speak only English Native:
51.4% (1,676)Foreign-born:
8.8% (210)
Other race - Speak another language Native:
48.6% (1,586)Foreign-born:
91.2% (2,183)
Two or more races - Speak only English Native:
81.5% (7,559)Foreign-born:
8.4% (78)
Two or more races - Speak another language Native:
18.5% (1,718)Foreign-born:
91.6% (855)
White alone - Speak only English Native:
93.6% (29,830)Foreign-born:
19.8% (1,055)
White alone - Speak another language Native:
6.4% (2,034)Foreign-born:
80.2% (4,277)
Hispanic or Latino - Speak only English Native:
47.3% (2,625)Foreign-born:
4.3% (141)
Hispanic or Latino - Speak another language Native:
52.7% (2,926)Foreign-born:
95.7% (3,118)
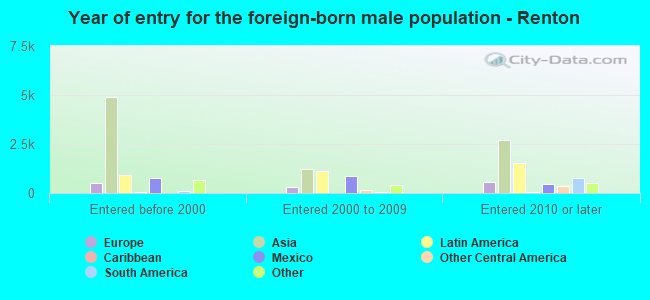
Foreign-born residents in Renton 31,331 residents are foreign born (17.2% Asia , 5.7% Latin America ).
This city:
29.6%Washington:
14.9%
Marital status for residents in Renton Marital status - White (Caucasian) population 15 years and over
Males 41.8% Never married45.7% Now married2.1% Separated1.1% Widowed9.3% DivorcedFemales 32.8% Never married43.5% Now married0.4% Separated8.8% Widowed14.5% DivorcedWomen who gave birth in the past 12 months Now married:
100.0% (49)Unmarried:
0.0% (0)
Women who did not give birth in the past 12 months Now married:
44.8% (4,410)Unmarried:
55.2% (5,433)
Marital status - Black or African American population 15 years and over
Males 44.8% Never married38.2% Now married1.5% Separated2.3% Widowed13.3% DivorcedFemales 50.7% Never married33.1% Now married2.3% Separated2.6% Widowed11.3% DivorcedWomen who gave birth in the past 12 months Now married:
59.3% (275)Unmarried:
40.7% (189)
Women who did not give birth in the past 12 months Now married:
37.0% (1,138)Unmarried:
63.0% (1,937)
Marital status - American Indian / Alaska Native population 15 years and over
Males 29.3% Never married41.3% Now married0.0% Separated0.0% Widowed29.3% DivorcedFemales 19.7% Never married61.9% Now married0.0% Separated0.0% Widowed18.4% DivorcedWomen who gave birth in the past 12 months Now married:
100.0% (31)Unmarried:
0.0% (0)
Women who did not give birth in the past 12 months Now married:
57.9% (220)Unmarried:
42.1% (160)
Marital status - Asian population 15 years and over
Males 35.4% Never married59.3% Now married1.4% Separated0.4% Widowed3.5% DivorcedFemales 31.4% Never married53.3% Now married2.0% Separated5.8% Widowed7.4% DivorcedWomen who gave birth in the past 12 months Now married:
100.0% (267)Unmarried:
0.0% (0)
Women who did not give birth in the past 12 months Now married:
45.2% (4,072)Unmarried:
54.8% (4,933)
Marital status - Native Hawaiian / Pacific Islander population 15 years and over
Males 32.6% Never married50.3% Now married0.0% Separated9.9% Widowed7.3% DivorcedFemales 19.8% Never married58.2% Now married0.0% Separated8.7% Widowed13.2% DivorcedWomen who did not give birth in the past 12 months Now married:
28.2% (67)Unmarried:
71.8% (170)
Marital status - Other race population 15 years and over
Males 50.4% Never married35.7% Now married10.2% Separated0.0% Widowed3.7% DivorcedFemales 49.9% Never married36.0% Now married4.2% Separated2.0% Widowed7.9% DivorcedWomen who gave birth in the past 12 months Now married:
100.0% (135)Unmarried:
0.0% (0)
Women who did not give birth in the past 12 months Now married:
29.1% (664)Unmarried:
70.9% (1,617)
Marital status - Two or more races population 15 years and over
Males 51.0% Never married43.0% Now married0.2% Separated0.2% Widowed5.6% DivorcedFemales 55.6% Never married32.1% Now married3.9% Separated3.6% Widowed4.9% DivorcedWomen who gave birth in the past 12 months Now married:
25.7% (99)Unmarried:
74.3% (285)
Women who did not give birth in the past 12 months Now married:
30.9% (1,121)Unmarried:
69.1% (2,501)
Marital status - White alone, not Hispanic / Latino population 15 years and over
Males 41.1% Never married46.9% Now married2.2% Separated0.7% Widowed9.2% DivorcedFemales 32.9% Never married43.0% Now married0.4% Separated9.0% Widowed14.8% DivorcedWomen who gave birth in the past 12 months Now married:
100.0% (49)Unmarried:
0.0% (0)
Women who did not give birth in the past 12 months Now married:
43.8% (4,166)Unmarried:
56.2% (5,338)
Marital status - Hispanic or Latino population 15 years and over
Males 49.0% Never married39.5% Now married6.1% Separated0.1% Widowed5.3% DivorcedFemales 49.7% Never married37.3% Now married3.3% Separated2.0% Widowed7.6% DivorcedWomen who gave birth in the past 12 months Now married:
100.0% (138)Unmarried:
0.0% (0)
Women who did not give birth in the past 12 months Now married:
39.5% (1,091)Unmarried:
60.5% (1,674)
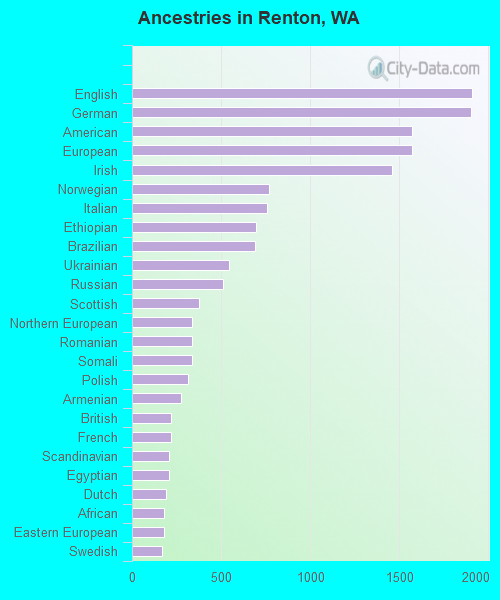
Ancestries in Renton
1,908 3.2% English1,900 3.2% German1,570 2.7% American1,569 2.7% European1,458 2.5% Irish770 1.3% Norwegian755 1.3% Italian694 1.2% Ethiopian692 1.2% Brazilian543 0.9% Ukrainian510 0.9% Russian374 0.6% Scottish338 0.6% Northern European337 0.6% Romanian335 0.6% Somali316 0.5% Polish276 0.5% Armenian220 0.4% British219 0.4% French209 0.4% Scandinavian207 0.4% Egyptian190 0.3% Dutch182 0.3% African181 0.3% Eastern European171 0.3% Swedish162 0.3% Turkish131 0.2% Portuguese121 0.2% Scotch-Irish120 0.2% Czech109 0.2% Palestinian102 0.2% Iranian100 0.2% Moroccan98 0.2% Canadian97 0.2% Ghanaian83 0.1% Iraqi83 0.1% Nigerian70 0.1% Danish66 0.1% Swiss60 0.1% South African58 0.10% Slovak55 0.09% Latvian55 0.09% Jamaican53 0.09% Kenyan53 0.09% French Canadian37 0.06% Greek35 0.06% Hungarian33 0.06% Lithuanian31 0.05% Croatian28 0.05% Haitian27 0.05% Welsh27 0.05% Yugoslavian23 0.04% Macedonian22 0.04% Finnish21 0.04% Austrian20 0.03% Slovene18 0.03% Israeli17 0.03% German Russian16 0.03% Lebanese15 0.03% West Indian14 0.02% Syrian12 0.02% Bulgarian10 0.02% Czechoslovakian4 0.01% New Zealander
Geographical mobility in Renton Same house 1 year ago 32,153 81.1% White (Caucasian)6,768 76.8% Black or African American518 61.3% American Indian / Alaska Native29,826 91.2% Asian801 86.8% Native Hawaiian / Pacific Islander5,267 72.4% Other race12,369 83.6% Two or more races31,234 81.3% White alone, not Hispanic / Latino12,126 76.7% Hispanic or LatinoMoved within same county 4,653 11.7% White / Caucasian1,349 15.3% Black or African American172 20.3% American Indian / Alaska Native1,611 4.9% Asian96 10.4% Native Hawaiian / Pacific Islander1,698 23.4% Other race1,759 11.9% Two or more races4,353 11.3% White alone, not Hispanic / Latino2,930 18.5% Hispanic or LatinoMoved within same state 1,138 2.9% White / Caucasian141 1.6% Black or African American68 8.0% American Indian / Alaska Native76 0.2% Asian36 0.5% Other race257 1.7% Two or more races1,138 3.0% White alone, not Hispanic / Latino255 1.6% Hispanic or LatinoMoved from different state 1,699 4.3% White / Caucasian286 3.2% Black or African American49 5.8% American Indian / Alaska Native926 2.8% Asian24 2.6% Native Hawaiian / Pacific Islander100 1.4% Other race354 2.4% Two or more races1,699 4.4% White alone, not Hispanic / Latino166 1.1% Hispanic or LatinoMoved from abroad 14 0.0% White99 1.1% Black or African American22 2.6% American Indian / Alaska Native250 0.8% Asian76 1.0% Other race14 0.0% White alone, not Hispanic / Latino202 1.3% Hispanic or Latino
Children Nativity (place of birth) in Renton
Children under 6 years - Living with two parents Both parents native 2,285 100.0% NativeBoth parents foreign-born 2,852 100.0% NativeOne native, one foreign-born parent 622 100.0% NativeChildren under 6 years - Living with one parent Native parent 1,311 100.0% NativeForeign-born parent 78 100.0% NativeChildren 6 to 17 years - Living with two parents Both parents native 2,316 100.0% NativeBoth parents foreign-born 3,009 87.8% Native417 12.2% Foreign-bornOne native, one foreign-born parent 1,041 100.0% NativeChildren 6 to 17 years - Living with one parent Native parent 1,194 100.0% NativeForeign-born parent 1,033 50.0% Native1,033 50.0% Foreign-born
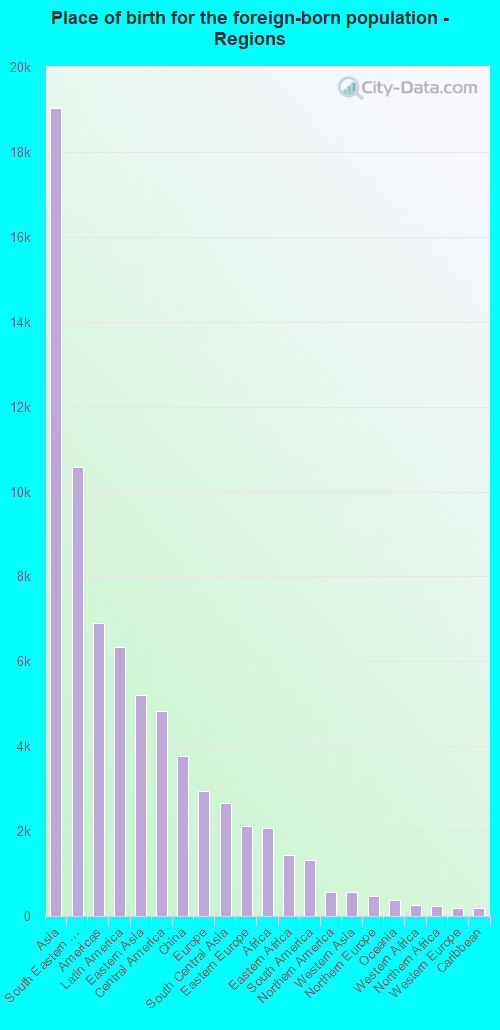
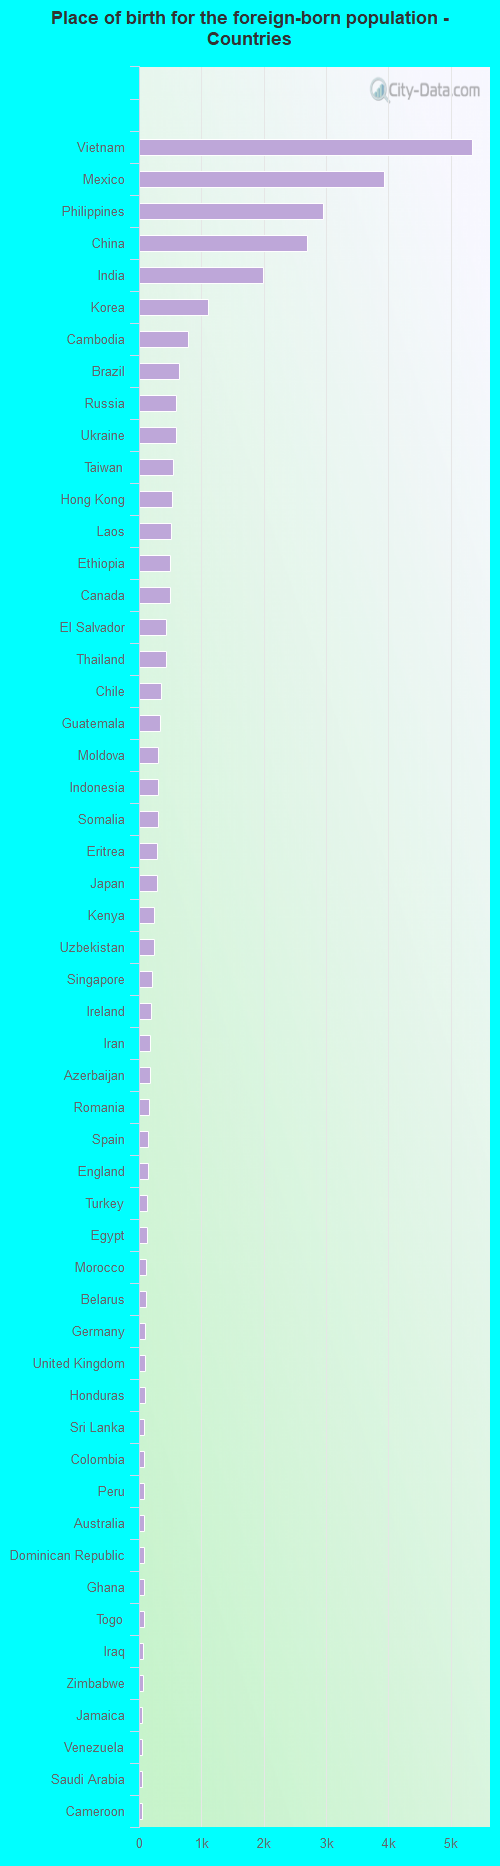
Place of birth for residents in Renton 19,033 Asia10,586 South Eastern Asia6,903 Americas6,328 Latin America5,203 Eastern Asia4,839 Central America3,763 China2,938 Europe2,666 South Central Asia2,131 Eastern Europe2,079 Africa1,437 Eastern Africa1,309 South America574 Northern America570 Western Asia460 Northern Europe377 Oceania270 Western Africa233 Northern Africa199 Western Europe180 Caribbean146 Southern Europe88 Australia and New Zealand Subregion55 Middle Africa23 Southern Africa5,345 Vietnam3,936 Mexico2,950 Philippines2,689 China1,993 India1,114 Korea790 Cambodia641 Brazil594 Russia589 Ukraine547 Taiwan526 Hong Kong506 Laos499 Ethiopia493 Canada437 El Salvador425 Thailand347 Chile331 Guatemala310 Moldova305 Indonesia297 Somalia290 Eritrea281 Japan238 Kenya236 Uzbekistan209 Singapore193 Ireland179 Iran174 Azerbaijan167 Romania146 Spain144 England128 Turkey122 Egypt111 Morocco105 Belarus102 Germany100 United Kingdom92 Honduras88 Sri Lanka88 Colombia83 Peru81 Australia80 Dominican Republic79 Ghana74 Togo70 Iraq60 Zimbabwe56 Jamaica56 Venezuela56 Saudi Arabia55 Cameroon48 North Macedonia (Macedonia)48 Syria46 Kazakhstan42 Pakistan41 France41 Guyana39 Netherlands39 Malaysia33 Armenia32 Czechoslovakia27 Hungary27 Poland26 Bulgaria26 Haiti25 Ecuador24 Bosnia and Herzegovina23 South Africa23 Panama23 Jordan20 Nepal20 Sweden19 Lithuania18 Nicaragua16 Fiji14 Tanzania13 Israel11 Belgium11 United Arab Emirates10 Liberia10 Kuwait9 Serbia8 Grenada8 Cuba6 New Zealand3 Austria
Grandparents responsible for own grandchildren in Renton
Grandparents (30 to 59 years) White / Caucasian 62 18.4% Responsible for grandchildren277 81.6% Not responsible for grandchildrenBlack or African American 101 67.1% Responsible for grandchildren49 32.9% Not responsible for grandchildrenAsian 26 100.0% Not responsible for grandchildrenNative Hawaiian / Pacific Islander 50 63.2% Responsible for grandchildren29 36.8% Not responsible for grandchildrenOther race 43 53.9% Responsible for grandchildren37 46.1% Not responsible for grandchildrenTwo or more races 59 100.0% Responsible for grandchildrenWhite alone, not Hispanic / Latino 20 12.7% Responsible for grandchildren136 87.3% Not responsible for grandchildrenHispanic or Latino 139 45.0% Responsible for grandchildren171 55.0% Not responsible for grandchildrenGrandparents (60 years and over) White / Caucasian 109 26.0% Responsible for grandchildren311 74.0% Not responsible for grandchildrenBlack or African American 42 68.4% Responsible for grandchildren19 31.6% Not responsible for grandchildrenAsian 137 20.2% Responsible for grandchildren544 79.8% Not responsible for grandchildrenTwo or more races 108 67.2% Responsible for grandchildren53 32.8% Not responsible for grandchildrenWhite alone, not Hispanic / Latino 108 26.4% Responsible for grandchildren302 73.6% Not responsible for grandchildrenHispanic or Latino 74 69.3% Responsible for grandchildren33 30.7% Not responsible for grandchildren