Races in Revere, Massachusetts (MA) Detailed Stats
Data:
Races - White alone (%)
Races - White alone (% change since 2000)
Races - Black alone (%)
Races - Black alone (% change since 2000)
Races - American Indian alone (%)
Races - American Indian alone (% change since 2000)
Races - Asian alone (%)
Races - Asian alone (% change since 2000)
Races - Hispanic (%)
Races - Hispanic (% change since 2000)
Races - Native Hawaiian and Other Pacific Islander alone (%)
Races - Native Hawaiian and Other Pacific Islander alone (% change since 2000)
Races - Two or more races(%)
Races - Two or more races(% change since 2000)
Races - Other race alone (%)
Races - Other race alone (% change since 2000)
Racial diversity
Place of birth - Born in state of residence (%)
Place of birth - Born in state of residence (%) - White
Place of birth - Born in state of residence (%) - Black or African American
Place of birth - Born in state of residence (%) - Asian
Place of birth - Born in state of residence (%) - Hispanic or Latino
Place of birth - Born in state of residence (%) - American Indian and Alaska Native
Place of birth - Born in state of residence (%) - Multirace
Place of birth - Born in state of residence (%) - Other Race
Place of birth - Born in other state (%)
Place of birth - Born in other state (%) - White
Place of birth - Born in other state (%) - Black or African American
Place of birth - Born in other state (%) - Asian
Place of birth - Born in other state (%) - Hispanic or Latino
Place of birth - Born in other state (%) - American Indian and Alaska Native
Place of birth - Born in other state (%) - Multirace
Place of birth - Born in other state (%) - Other Race
Place of birth - Native, outside of US (%)
Place of birth - Native, outside of US (%) - White
Place of birth - Native, outside of US (%) - Black or African American
Place of birth - Native, outside of US (%) - Asian
Place of birth - Native, outside of US (%) - Hispanic or Latino
Place of birth - Native, outside of US (%) - American Indian and Alaska Native
Place of birth - Native, outside of US (%) - Multirace
Place of birth - Native, outside of US (%) - Other Race
Place of birth - Foreign born (%)
Place of birth - Foreign born (%) - White
Place of birth - Foreign born (%) - Black or African American
Place of birth - Foreign born (%) - Asian
Place of birth - Foreign born (%) - Hispanic or Latino
Place of birth - Foreign born (%) - American Indian and Alaska Native
Place of birth - Foreign born (%) - Multirace
Place of birth - Foreign born (%) - Other Race
Residents speaking English at home (%)
Residents speaking English at home - Born in the United States (%)
Residents speaking English at home - Native, born elsewhere (%)
Residents speaking English at home - Foreign born (%)
Residents speaking Spanish at home (%)
Residents speaking Spanish at home - Born in the United States (%)
Residents speaking Spanish at home - Native, born elsewhere (%)
Residents speaking Spanish at home - Foreign born (%)
Residents speaking other language at home (%)
Residents speaking other language at home - Born in the United States (%)
Residents speaking other language at home - Native, born elsewhere (%)
Residents speaking other language at home - Foreign born (%)
Marital status - Never married (%)
Marital status - Now married (%)
Marital status - Separated (%)
Marital status - Widowed (%)
Marital status - Divorced (%)
Ancestries Reported - Arab (%)
Ancestries Reported - Czech (%)
Ancestries Reported - Danish (%)
Ancestries Reported - Dutch (%)
Ancestries Reported - English (%)
Ancestries Reported - French (%)
Ancestries Reported - French Canadian (%)
Ancestries Reported - German (%)
Ancestries Reported - Greek (%)
Ancestries Reported - Hungarian (%)
Ancestries Reported - Irish (%)
Ancestries Reported - Italian (%)
Ancestries Reported - Lithuanian (%)
Ancestries Reported - Norwegian (%)
Ancestries Reported - Polish (%)
Ancestries Reported - Portuguese (%)
Ancestries Reported - Russian (%)
Ancestries Reported - Scotch-Irish (%)
Ancestries Reported - Scottish (%)
Ancestries Reported - Slovak (%)
Ancestries Reported - Subsaharan African (%)
Ancestries Reported - Swedish (%)
Ancestries Reported - Swiss (%)
Ancestries Reported - Ukrainian (%)
Ancestries Reported - United States (%)
Ancestries Reported - Welsh (%)
Ancestries Reported - West Indian (%)
Ancestries Reported - Other (%)
Geographical mobility - Same house 1 year ago (%)
Geographical mobility - Same house 1 year ago (%) - White
Geographical mobility - Same house 1 year ago (%) - Black or African American
Geographical mobility - Same house 1 year ago (%) - Asian
Geographical mobility - Same house 1 year ago (%) - Hispanic or Latino
Geographical mobility - Same house 1 year ago (%) - American Indian and Alaska Native
Geographical mobility - Same house 1 year ago (%) - Multirace
Geographical mobility - Same house 1 year ago (%) - Other Race
Geographical mobility - Moved within same county (%)
Geographical mobility - Moved within same county (%) - White
Geographical mobility - Moved within same county (%) - Black or African American
Geographical mobility - Moved within same county (%) - Asian
Geographical mobility - Moved within same county (%) - Hispanic or Latino
Geographical mobility - Moved within same county (%) - American Indian and Alaska Native
Geographical mobility - Moved within same county (%) - Multirace
Geographical mobility - Moved within same county (%) - Other Race
Geographical mobility - Moved from different county within same state (%)
Geographical mobility - Moved from different county within same state (%) - White
Geographical mobility - Moved from different county within same state (%) - Black or African American
Geographical mobility - Moved from different county within same state (%) - Asian
Geographical mobility - Moved from different county within same state (%) - Hispanic or Latino
Geographical mobility - Moved from different county within same state (%) - American Indian and Alaska Native
Geographical mobility - Moved from different county within same state (%) - Multirace
Geographical mobility - Moved from different county within same state (%) - Other Race
Geographical mobility - Moved from different state (%)
Geographical mobility - Moved from different state (%) - White
Geographical mobility - Moved from different state (%) - Black or African American
Geographical mobility - Moved from different state (%) - Asian
Geographical mobility - Moved from different state (%) - Hispanic or Latino
Geographical mobility - Moved from different state (%) - American Indian and Alaska Native
Geographical mobility - Moved from different state (%) - Multirace
Geographical mobility - Moved from different state (%) - Other Race
Geographical mobility - Moved from abroad (%)
Geographical mobility - Moved from abroad (%) - White
Geographical mobility - Moved from abroad (%) - Black or African American
Geographical mobility - Moved from abroad (%) - Asian
Geographical mobility - Moved from abroad (%) - Hispanic or Latino
Geographical mobility - Moved from abroad (%) - American Indian and Alaska Native
Geographical mobility - Moved from abroad (%) - Multirace
Geographical mobility - Moved from abroad (%) - Other Race
Place of birth for the foreign-born population - Ireland (%)
Place of birth for the foreign-born population - Denmark (%)
Place of birth for the foreign-born population - Norway (%)
Place of birth for the foreign-born population - Sweden (%)
Place of birth for the foreign-born population - United Kingdom (%)
Place of birth for the foreign-born population - England (%)
Place of birth for the foreign-born population - Scotland (%)
Place of birth for the foreign-born population - Other Northern Europe (%)
Place of birth for the foreign-born population - Austria (%)
Place of birth for the foreign-born population - Belgium (%)
Place of birth for the foreign-born population - France (%)
Place of birth for the foreign-born population - Germany (%)
Place of birth for the foreign-born population - Netherlands (%)
Place of birth for the foreign-born population - Switzerland (%)
Place of birth for the foreign-born population - Other Western Europe (%)
Place of birth for the foreign-born population - Greece (%)
Place of birth for the foreign-born population - Italy (%)
Place of birth for the foreign-born population - Portugal (%)
Place of birth for the foreign-born population - Spain (%)
Place of birth for the foreign-born population - Other Southern Europe (%)
Place of birth for the foreign-born population - Albania (%)
Place of birth for the foreign-born population - Belarus (%)
Place of birth for the foreign-born population - Bosnia and Herzegovina (%)
Place of birth for the foreign-born population - Bulgaria (%)
Place of birth for the foreign-born population - Croatia (%)
Place of birth for the foreign-born population - Czechoslovakia (%)
Place of birth for the foreign-born population - Hungary (%)
Place of birth for the foreign-born population - Latvia (%)
Place of birth for the foreign-born population - Lithuania (%)
Place of birth for the foreign-born population - North Macedonia (Macedonia) (%)
Place of birth for the foreign-born population - Moldova (%)
Place of birth for the foreign-born population - Poland (%)
Place of birth for the foreign-born population - Romania (%)
Place of birth for the foreign-born population - Russia (%)
Place of birth for the foreign-born population - Serbia (%)
Place of birth for the foreign-born population - Ukraine (%)
Place of birth for the foreign-born population - Other Eastern Europe (%)
Place of birth for the foreign-born population - China (%)
Place of birth for the foreign-born population - Hong Kong (%)
Place of birth for the foreign-born population - Taiwan (%)
Place of birth for the foreign-born population - Japan (%)
Place of birth for the foreign-born population - Korea (%)
Place of birth for the foreign-born population - Other Eastern Asia (%)
Place of birth for the foreign-born population - Afghanistan (%)
Place of birth for the foreign-born population - Bangladesh (%)
Place of birth for the foreign-born population - India (%)
Place of birth for the foreign-born population - Iran (%)
Place of birth for the foreign-born population - Kazakhstan (%)
Place of birth for the foreign-born population - Nepal (%)
Place of birth for the foreign-born population - Pakistan (%)
Place of birth for the foreign-born population - Sri Lanka (%)
Place of birth for the foreign-born population - Uzbekistan (%)
Place of birth for the foreign-born population - Other South Central Asia (%)
Place of birth for the foreign-born population - Burma (%)
Place of birth for the foreign-born population - Cambodia (%)
Place of birth for the foreign-born population - Indonesia (%)
Place of birth for the foreign-born population - Laos (%)
Place of birth for the foreign-born population - Malaysia (%)
Place of birth for the foreign-born population - Philippines (%)
Place of birth for the foreign-born population - Singapore (%)
Place of birth for the foreign-born population - Thailand (%)
Place of birth for the foreign-born population - Vietnam (%)
Place of birth for the foreign-born population - Other South Eastern Asia (%)
Place of birth for the foreign-born population - Armenia (%)
Place of birth for the foreign-born population - Iraq (%)
Place of birth for the foreign-born population - Israel (%)
Place of birth for the foreign-born population - Jordan (%)
Place of birth for the foreign-born population - Kuwait (%)
Place of birth for the foreign-born population - Lebanon (%)
Place of birth for the foreign-born population - Saudi Arabia (%)
Place of birth for the foreign-born population - Syria (%)
Place of birth for the foreign-born population - Turkey (%)
Place of birth for the foreign-born population - Yemen (%)
Place of birth for the foreign-born population - Other Western Asia (%)
Place of birth for the foreign-born population - Eritrea (%)
Place of birth for the foreign-born population - Ethiopia (%)
Place of birth for the foreign-born population - Kenya (%)
Place of birth for the foreign-born population - Somalia (%)
Place of birth for the foreign-born population - Uganda (%)
Place of birth for the foreign-born population - Zimbabwe (%)
Place of birth for the foreign-born population - Other Eastern Africa (%)
Place of birth for the foreign-born population - Cameroon (%)
Place of birth for the foreign-born population - Congo (%)
Place of birth for the foreign-born population - Democratic Republic of Congo (Zaire) (%)
Place of birth for the foreign-born population - Other Middle Africa (%)
Place of birth for the foreign-born population - Egypt (%)
Place of birth for the foreign-born population - Morocco (%)
Place of birth for the foreign-born population - Sudan (%)
Place of birth for the foreign-born population - Other Northern Africa (%)
Place of birth for the foreign-born population - South Africa (%)
Place of birth for the foreign-born population - Other Southern Africa (%)
Place of birth for the foreign-born population - Cabo Verde (%)
Place of birth for the foreign-born population - Ghana (%)
Place of birth for the foreign-born population - Liberia (%)
Place of birth for the foreign-born population - Nigeria (%)
Place of birth for the foreign-born population - Senegal (%)
Place of birth for the foreign-born population - Sierra Leone (%)
Place of birth for the foreign-born population - Other Western Africa (%)
Place of birth for the foreign-born population - Australia (%)
Place of birth for the foreign-born population - New Zealand (%)
Place of birth for the foreign-born population - Fiji (%)
Place of birth for the foreign-born population - Micronesia (%)
Place of birth for the foreign-born population - Bahamas (%)
Place of birth for the foreign-born population - Barbados (%)
Place of birth for the foreign-born population - Cuba (%)
Place of birth for the foreign-born population - Dominica (%)
Place of birth for the foreign-born population - Dominican Republic (%)
Place of birth for the foreign-born population - Grenada (%)
Place of birth for the foreign-born population - Haiti (%)
Place of birth for the foreign-born population - Jamaica (%)
Place of birth for the foreign-born population - St. Vincent and the Grenadines (%)
Place of birth for the foreign-born population - Trinidad and Tobago (%)
Place of birth for the foreign-born population - West Indies (%)
Place of birth for the foreign-born population - Other Caribbean (%)
Place of birth for the foreign-born population - Belize (%)
Place of birth for the foreign-born population - Costa Rica (%)
Place of birth for the foreign-born population - El Salvador (%)
Place of birth for the foreign-born population - Guatemala (%)
Place of birth for the foreign-born population - Honduras (%)
Place of birth for the foreign-born population - Mexico (%)
Place of birth for the foreign-born population - Nicaragua (%)
Place of birth for the foreign-born population - Panama (%)
Place of birth for the foreign-born population - Other Central America (%)
Place of birth for the foreign-born population - Argentina (%)
Place of birth for the foreign-born population - Bolivia (%)
Place of birth for the foreign-born population - Brazil (%)
Place of birth for the foreign-born population - Chile (%)
Place of birth for the foreign-born population - Colombia (%)
Place of birth for the foreign-born population - Ecuador (%)
Place of birth for the foreign-born population - Guyana (%)
Place of birth for the foreign-born population - Peru (%)
Place of birth for the foreign-born population - Uruguay (%)
Place of birth for the foreign-born population - Venezuela (%)
Place of birth for the foreign-born population - Other South America (%)
Place of birth for the foreign-born population - Canada (%)
Place of birth for the foreign-born population - Other Northern America (%)
Place of birth for the foreign-born population - Other (%)
Latest news about races in Revere, MA collected exclusively by city-data.com from local newspapers, TV, and radio stations
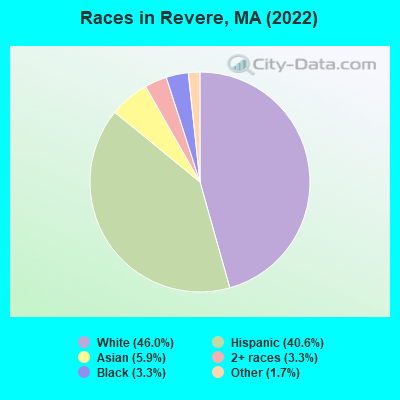
According to 2022 data, the most numerous races in Revere, MA are White alone (27,164 residents), Hispanic (24,005 residents), and Asian alone (3,474 residents). 43.0% of Revere residents speak English at home. 46.2% of Revere, MA residents are foreign-born (30.9% born in Latin America, 5.9% born in Europe), which is 61.0% greater than the foreign-born rate of 18.0% across the entire state of Massachusetts.
Race distribution in Revere
2000 2022
37,530 79.4% White alone 4,465 9.4% Hispanic 2,141 4.5% Asian alone 1,490 3.2% Two or more races 1,248 2.6% Black alone 297 0.6% Other race alone 88 0.2% American Indian alone 24 0.05% Native Hawaiian and Other
27,164 46.0% White alone 24,005 40.6% Hispanic 3,474 5.9% Asian alone 1,925 3.3% Black alone 1,957 3.3% Two or more races 1,020 1.7% Other race alone 14 0.02% American Indian alone
2000 2022
5,198,359 81.9% White alone 428,729 6.8% Hispanic 318,329 5.0% Black alone 236,786 3.7% Asian alone 110,338 1.7% Two or more races 43,586 0.7% Other race alone 11,264 0.2% American Indian alone 1,706 0.03% Native Hawaiian and Other
4,676,627 67.0% White alone 911,038 13.0% Hispanic 501,463 7.2% Asian alone 459,740 6.6% Black alone 341,889 4.9% Two or more races 84,403 1.2% Other race alone 5,838 0.08% American Indian alone 976 0.01% Native Hawaiian and Other
Income and house value in Revere Median household income in 2022 $70,757 White non-Hispanic householders$68,989 Black householders$107,834 Asian householders$84,286 Some other race householders$90,396 Two or more races householders$101,182 Hispanic or Latino race householdersMedian 2022 house value $520,657 White Non-Hispanic householders$269,615 Black or African American householdersover $1,000,000 American Indian or Alaska Native householders $461,224 Asian householders$509,823 Some other race householders$677,907 Two or more races householders$498,060 Hispanic or Latino householders
Median age by race in Revere
45.1 Median age for White residents44.5 45.6 32.8 Median age for Black or African American residents34.0 30.8 71.5 Median age for American Indian / Alaska Native residents30.6 -731,060,605.3 39.6 Median age for Asian residents40.7 39.7 -514,227,641.8 Median age for Native Hawaiian / Pacific Islander residents-513,131,312.6 -508,717,948.2 34.4 Median age for Other race residents34.0 35.0 36.5 Median age for Two or more races residents37.4 34.2 49.6 Median age for White alone residents48.8 51.8 35.0 Median age for Hispanic or Latino residents35.8 32.9
Owner/renter occupied households by race in Revere
House owners and renters - White residents 7,555 53.9% Owner occupied6,456 46.1% Renter occupiedHouse owners and renters - Black or African American residents 380 43.7% Owner occupied490 56.3% Renter occupiedHouse owners and renters - American Indian / Alaska Native residents 30 51.2% Owner occupied29 48.8% Renter occupiedHouse owners and renters - Asian residents 578 49.6% Owner occupied588 50.4% Renter occupiedHouse owners and renters - Other race residents 1,323 59.6% Owner occupied896 40.4% Renter occupiedHouse owners and renters - Two or more races residents 1,872 41.5% Owner occupied2,639 58.5% Renter occupiedHouse owners and renters - White alone residents 6,826 53.2% Owner occupied5,996 46.8% Renter occupiedHouse owners and renters - Hispanic or Latino residents 3,436 51.8% Owner occupied3,201 48.2% Renter occupied
Language usage in Revere
English speakers - Total 43.0% of residents of Revere speak English at home.
37.4% of residents speak Spanish at home 8,267 39.9% Speak English very well12,463 60.1% Speak English less than very well19.3% of residents speak other language at home 5,408 50.5% Speak English very well5,294 49.5% Speak English less than very well
English speakers - Born in the United States 81.8% of residents of Revere speak English at home.
13.7% of residents speak Spanish at home 357 64.8% Speak English very well194 35.2% Speak English less than very well2.4% of residents speak other language at home 75 78.9% Speak English very well20 21.1% Speak English less than very well
English speakers - Native, born elsewhere 25.7% of residents of Revere speak English at home.
56.3% of residents speak Spanish at home 307 56.9% Speak English very well233 43.1% Speak English less than very well17.2% of residents speak other language at home 100 60.6% Speak English very well65 39.4% Speak English less than very well
English speakers - Foreign-born 9.1% of residents of Revere speak English at home.
60.3% of residents speak Spanish at home 3,884 25.3% Speak English very well11,482 74.7% Speak English less than very well31.6% of residents speak other language at home 3,137 38.9% Speak English very well4,923 61.1% Speak English less than very well
White (Caucasian) - Speak only English Native:
84.6% (18,615)Foreign-born:
10.5% (739)
White (Caucasian) - Speak another language Native:
12.5% (2,744)Foreign-born:
87.2% (6,161)
Black or African American - Speak only English Native:
75.0% (863)Foreign-born:
45.3% (388)
Black or African American - Speak another language Native:
23.3% (268)Foreign-born:
54.6% (468)
American Indian / Alaska Native - Speak another language Native:
89.2% (61)Foreign-born:
91.9% (49)
Asian - Speak only English Native:
22.5% (150)Foreign-born:
11.0% (271)
Asian - Speak another language Native:
76.3% (511)Foreign-born:
87.4% (2,148)
Other race - Speak only English Native:
21.9% (360)Foreign-born:
5.6% (377)
Other race - Speak another language Native:
75.2% (1,238)Foreign-born:
94.6% (6,326)
Two or more races - Speak only English Native:
33.6% (1,453)Foreign-born:
4.3% (384)
Two or more races - Speak another language Native:
67.6% (2,920)Foreign-born:
95.9% (8,536)
White alone - Speak only English Native:
88.8% (18,180)Foreign-born:
13.2% (716)
White alone - Speak another language Native:
9.8% (2,009)Foreign-born:
88.8% (4,822)
Hispanic or Latino - Speak only English Native:
23.9% (1,604)Foreign-born:
3.5% (543)
Hispanic or Latino - Speak another language Native:
75.6% (5,064)Foreign-born:
96.8% (15,064)
Foreign-born residents in Revere 27,293 residents are foreign born (30.9% Latin America , 5.9% Europe ).
This city:
46.2%Massachusetts:
17.6%
Marital status for residents in Revere Marital status - White (Caucasian) population 15 years and over
Males 35.5% Never married47.0% Now married2.1% Separated3.8% Widowed11.6% DivorcedFemales 32.2% Never married39.4% Now married2.6% Separated13.1% Widowed12.7% DivorcedWomen who gave birth in the past 12 months Now married:
85.3% (169)Unmarried:
14.7% (29)
Women who did not give birth in the past 12 months Now married:
38.7% (2,653)Unmarried:
61.3% (4,204)
Marital status - Black or African American population 15 years and over
Males 56.6% Never married33.2% Now married2.2% Separated4.6% Widowed3.4% DivorcedFemales 53.1% Never married33.1% Now married0.0% Separated5.6% Widowed8.2% DivorcedWomen who gave birth in the past 12 months Now married:
28.0% (6)Unmarried:
72.0% (16)
Women who did not give birth in the past 12 months Now married:
30.2% (181)Unmarried:
69.8% (419)
Marital status - American Indian / Alaska Native population 15 years and over
Males 58.1% Never married41.9% Now married0.0% Separated0.0% Widowed0.0% DivorcedFemales 0.0% Never married100.0% Now married0.0% Separated0.0% Widowed0.0% DivorcedMarital status - Asian population 15 years and over
Males 32.1% Never married62.6% Now married0.0% Separated0.0% Widowed5.3% DivorcedFemales 25.2% Never married65.1% Now married0.0% Separated6.8% Widowed2.9% DivorcedWomen who gave birth in the past 12 months Now married:
100.0% (52)Unmarried:
0.0% (0)
Women who did not give birth in the past 12 months Now married:
66.4% (631)Unmarried:
33.6% (320)
Marital status - Other race population 15 years and over
Males 50.8% Never married42.0% Now married2.7% Separated0.0% Widowed4.5% DivorcedFemales 40.5% Never married46.2% Now married2.3% Separated2.2% Widowed8.8% DivorcedWomen who gave birth in the past 12 months Now married:
100.0% (68)Unmarried:
0.0% (0)
Women who did not give birth in the past 12 months Now married:
42.0% (873)Unmarried:
58.0% (1,208)
Marital status - Two or more races population 15 years and over
Males 45.7% Never married43.7% Now married2.4% Separated0.0% Widowed8.2% DivorcedFemales 40.3% Never married44.3% Now married5.1% Separated2.7% Widowed7.7% DivorcedWomen who gave birth in the past 12 months Now married:
36.2% (34)Unmarried:
63.8% (60)
Women who did not give birth in the past 12 months Now married:
42.1% (1,399)Unmarried:
57.9% (1,927)
Marital status - White alone, not Hispanic / Latino population 15 years and over
Males 33.4% Never married49.7% Now married1.5% Separated4.1% Widowed11.3% DivorcedFemales 29.0% Never married39.2% Now married3.0% Separated15.0% Widowed13.7% DivorcedWomen who gave birth in the past 12 months Now married:
94.3% (158)Unmarried:
5.7% (10)
Women who did not give birth in the past 12 months Now married:
39.1% (2,007)Unmarried:
60.9% (3,120)
Marital status - Hispanic or Latino population 15 years and over
Males 47.6% Never married39.5% Now married3.5% Separated0.8% Widowed8.6% DivorcedFemales 42.9% Never married43.7% Now married3.2% Separated2.6% Widowed7.5% DivorcedWomen who gave birth in the past 12 months Now married:
73.3% (104)Unmarried:
26.7% (38)
Women who did not give birth in the past 12 months Now married:
41.0% (2,595)Unmarried:
59.0% (3,730)
Ancestries in Revere
5,552 15.0% Italian2,293 6.2% Brazilian2,198 5.9% Moroccan1,727 4.7% Irish877 2.4% American731 2.0% Albanian603 1.6% Yugoslavian588 1.6% Haitian430 1.2% English416 1.1% Trinidadian and Tobagonian345 0.9% European316 0.9% Portuguese218 0.6% Polish179 0.5% French Canadian163 0.4% Russian112 0.3% Scottish109 0.3% German108 0.3% French82 0.2% Turkish79 0.2% Ethiopian76 0.2% Cape Verdean62 0.2% Serbian62 0.2% African56 0.2% Arab54 0.1% Armenian53 0.1% Greek52 0.1% Lebanese51 0.1% Ugandan50 0.1% Eastern European46 0.1% Egyptian40 0.1% Guyanese32 0.09% Croatian31 0.08% Sudanese29 0.08% Swedish26 0.07% Iranian26 0.07% Jamaican23 0.06% Romanian21 0.06% Lithuanian21 0.06% Danish16 0.04% Finnish14 0.04% Norwegian14 0.04% Kenyan14 0.04% Ukrainian14 0.04% British West Indian12 0.03% Scotch-Irish6 0.02% Canadian4 0.01% Northern European3 0.01% British
Geographical mobility in Revere Same house 1 year ago 27,007 85.2% White (Caucasian)1,848 84.8% Black or African American88 72.0% American Indian / Alaska Native3,056 88.0% Asian6,309 76.4% Other race12,472 88.6% Two or more races23,805 88.2% White alone, not Hispanic / Latino19,518 82.0% Hispanic or LatinoMoved within same county 2,529 8.0% White / Caucasian119 5.5% Black or African American94 2.7% Asian985 11.9% Other race1,157 8.2% Two or more races1,283 4.8% White alone, not Hispanic / Latino2,554 10.7% Hispanic or LatinoMoved within same state 808 2.5% White / Caucasian40 33.0% American Indian / Alaska Native109 3.1% Asian532 6.4% Other race308 2.2% Two or more races796 2.9% White alone, not Hispanic / Latino558 2.3% Hispanic or LatinoMoved from different state 373 1.2% White / Caucasian134 6.2% Black or African American166 4.8% Asian103 1.2% Other race29 0.2% Two or more races321 1.2% White alone, not Hispanic / Latino232 1.0% Hispanic or LatinoMoved from abroad 287 0.9% White104 4.8% Black or African American318 3.9% Other race256 0.9% White alone, not Hispanic / Latino271 1.1% Hispanic or Latino
Children Nativity (place of birth) in Revere
Children under 6 years - Living with two parents Both parents native 296 98.3% Native5 1.7% Foreign-bornBoth parents foreign-born 1,597 96.8% Native53 3.2% Foreign-bornOne native, one foreign-born parent 654 98.5% Native10 1.5% Foreign-bornChildren under 6 years - Living with one parent Native parent 487 100.0% NativeForeign-born parent 806 97.5% Native20 2.5% Foreign-bornChildren 6 to 17 years - Living with two parents Both parents native 742 100.0% NativeBoth parents foreign-born 1,534 68.4% Native710 31.6% Foreign-bornOne native, one foreign-born parent 807 88.4% Native106 11.6% Foreign-bornChildren 6 to 17 years - Living with one parent Native parent 827 100.0% NativeForeign-born parent 1,724 53.4% Native1,504 46.6% Foreign-born
Place of birth for residents in Revere 19,328 Americas19,211 Latin America9,781 Central America8,357 South America3,639 Europe2,786 Asia1,828 Eastern Europe1,506 Africa1,403 Southern Europe1,210 Northern Africa1,072 Caribbean1,015 South Eastern Asia919 South Central Asia790 Eastern Asia740 China212 Northern Europe166 Western Europe116 Northern America115 Western Africa103 Eastern Africa52 Middle Africa48 Western Asia32 Oceania32 Australia and New Zealand Subregion17 Southern Africa6,109 El Salvador5,181 Colombia2,448 Brazil2,266 Guatemala1,117 Italy1,077 Honduras1,057 Morocco671 China656 Albania535 Vietnam480 Bosnia and Herzegovina471 Dominican Republic363 Haiti346 India317 Russia316 Pakistan300 Peru226 Nepal187 Cambodia179 Trinidad and Tobago176 Philippines167 Portugal165 Mexico154 Poland135 Venezuela116 Canada109 Cabo Verde96 Ecuador90 Spain83 Ireland82 Burma (Myanmar)82 Chile76 France63 Uruguay58 Switzerland58 Algeria57 Ethiopia55 United Kingdom54 Sudan52 Cameroon52 Croatia49 Japan49 Argentina48 Turkey48 Denmark45 Jamaica42 Costa Rica41 Taiwan40 Egypt35 Uganda33 Thailand32 Serbia32 New Zealand30 Ukraine30 Belarus30 Germany29 Iran28 Greece28 Hong Kong18 Azores Islands17 South Africa14 England12 Romania11 Lithuania10 Kenya6 Nigeria3 Nicaragua1 Cuba
Grandparents responsible for own grandchildren in Revere
Grandparents (30 to 59 years) White / Caucasian 124 32.7% Responsible for grandchildren255 67.3% Not responsible for grandchildrenAsian 36 30.7% Responsible for grandchildren81 69.3% Not responsible for grandchildrenOther race 77 100.0% Not responsible for grandchildrenTwo or more races 197 100.0% Not responsible for grandchildrenWhite alone, not Hispanic / Latino 97 29.2% Responsible for grandchildren235 70.8% Not responsible for grandchildrenHispanic or Latino 13 2.7% Responsible for grandchildren462 97.3% Not responsible for grandchildrenGrandparents (60 years and over) White / Caucasian 137 20.4% Responsible for grandchildren533 79.6% Not responsible for grandchildrenAsian 190 100.0% Not responsible for grandchildrenOther race 32 49.0% Responsible for grandchildren34 51.0% Not responsible for grandchildrenTwo or more races 192 100.0% Not responsible for grandchildrenWhite alone, not Hispanic / Latino 152 41.3% Responsible for grandchildren216 58.7% Not responsible for grandchildrenHispanic or Latino 341 100.0% Not responsible for grandchildren