Races in Richland Hills, Texas (TX) Detailed Stats
Ancestries, Foreign-born residents, place of birth
Settings
X


Recent posts about races in Richland Hills, Texas on our local forum with over 2,400,000 registered users:
 | Fort Worth houses (41 replies) |
| Million Dollar Question - Buy or Wait? 2022 Edition (620 replies) |
| North Richland Hills? Vs Flower Mound (3 replies) |
| Why house hunting in DFW is so difficult (141 replies) |
| Working in North Richland Hills Texas- where should I live (10 replies) |
| Relocating to FW, Renting, Now Worrying about Crime. Overreacting? (20 replies) |
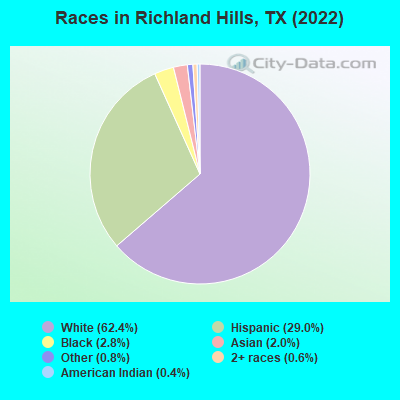
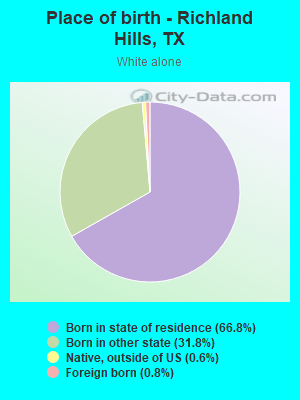
According to 2022 data, the most numerous races in Richland Hills, TX are Hispanic (2,513 residents), White alone (5,418 residents), and Black alone (246 residents). 83.4% of Richland Hills residents speak English at home. 7.9% of Richland Hills, TX residents are foreign-born (5.8% born in Latin America, 1.6% born in Asia), which is 114.7% less than the foreign-born rate of 17.0% across the entire state of Texas.
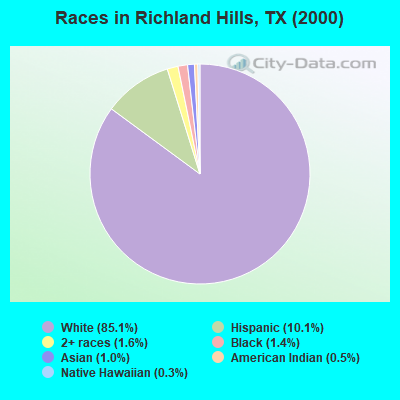
Race distribution in Richland Hills
2000
2022

- 6,92185.1%White alone
- 82510.1%Hispanic
- 1281.6%Two or more races
- 1151.4%Black alone
- 781.0%Asian alone
- 410.5%American Indian alone
- 210.3%Native Hawaiian and Other
Pacific Islander alone - 30.04%Other race alone
-
- 5,41862.4%White alone
- 2,51329.0%Hispanic
- 2462.8%Black alone
- 1732.0%Asian alone
- 720.8%Other race alone
- 500.6%Two or more races
- 340.4%American Indian alone
2000
2022
-
- 10,933,31352.4%White alone
- 6,669,66632.0%Hispanic
- 2,364,25511.3%Black alone
- 554,4452.7%Asian alone
- 230,5671.1%Two or more races
- 68,8590.3%American Indian alone
- 19,9580.10%Other race alone
- 10,7570.05%Native Hawaiian and Other
Pacific Islander alone

-
- 12,070,64240.2%Hispanic
- 11,683,43038.9%White alone
- 3,508,70611.7%Black alone
- 1,608,1735.4%Asian alone
- 956,5603.2%Two or more races
- 125,7630.4%Other race alone
- 47,0230.2%American Indian alone
- 29,2750.10%Native Hawaiian and Other
Pacific Islander alone

Income and house value in Richland Hills
- Median household income in 2022
- $71,706White non-Hispanic householders
- $72,367Black householders
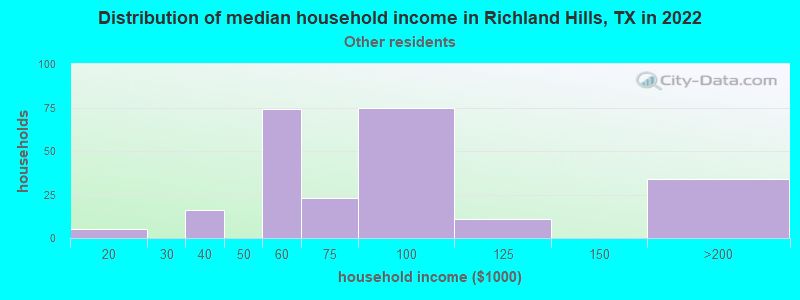
- $59,858Some other race householders
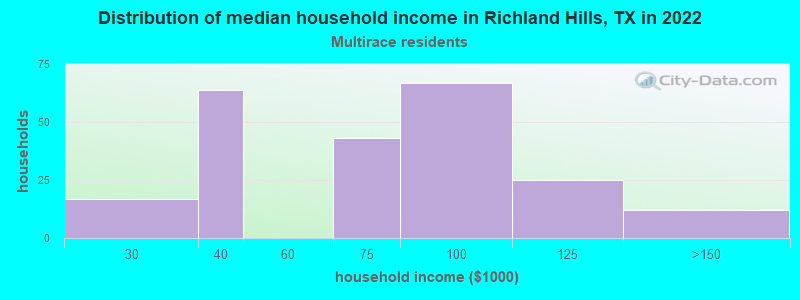
- $74,458Two or more races householders
- $78,168Hispanic or Latino race householders
- Median 2022 house value
- $241,331White Non-Hispanic householders
- $146,360Black or African American householders
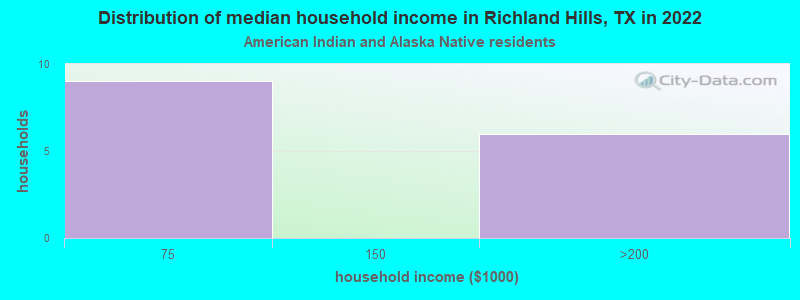
- $160,020American Indian or Alaska Native householders
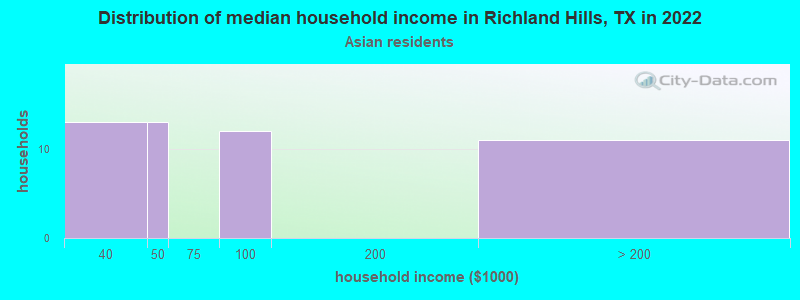
- $317,113Asian householders
- $242,632Some other race householders
- $203,278Two or more races householders
- $227,020Hispanic or Latino householders
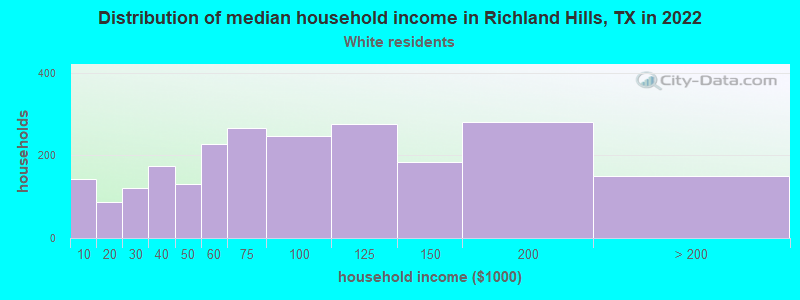
Household income for White non-Hispanic householders
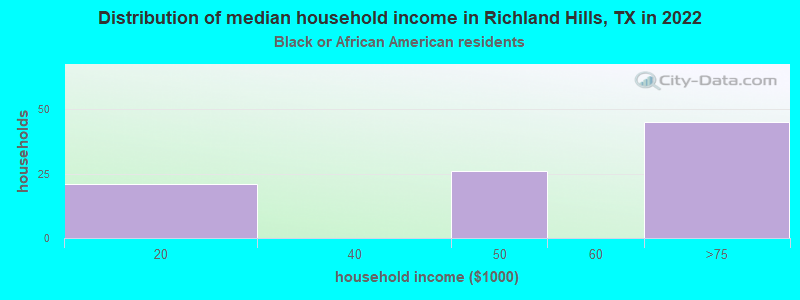
Household income for Black householders
Household income for American Indian and Alaska Native householders
Household income for Asian householders
Household income for Some other race householders
Household income for Two or more races householders
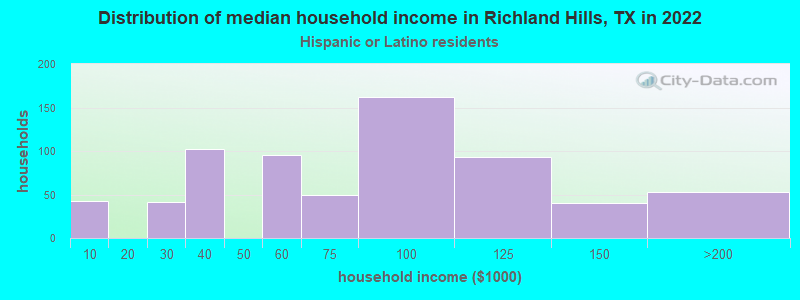
Household income for Hispanic or Latino race householders
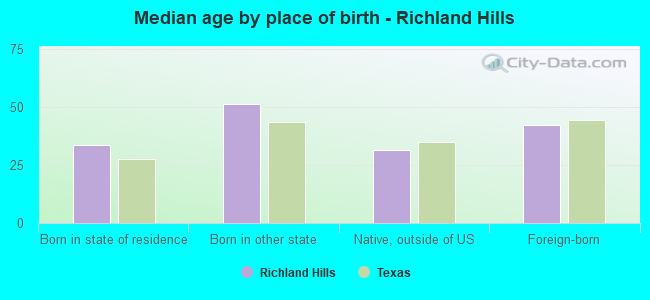
Median age by race in Richland Hills
- 42.5Median age for White residents
- 37.9Males
- 50.7Females
- 32.9Median age for Black or African American residents
- 10.6Males
- 37.9Females
- 57.0Median age for American Indian / Alaska Native residents
- 46.4Males
- 65.8Females
- 49.1Median age for Asian residents
- 50.1Males
- 43.4Females
- -565,040,649.8Median age for Native Hawaiian / Pacific Islander residents
- -550,102,248.9Males
- -551,928,782.8Females
- 37.5Median age for Other race residents
- 19.1Males
- 67.6Females
- 46.1Median age for Two or more races residents
- 34.8Males
- 56.6Females
- 49.1Median age for White alone residents
- 40.7Males
- 52.6Females
- 29.9Median age for Hispanic or Latino residents
- 19.7Males
- 38.5Females
Owner/renter occupied households by race in Richland Hills
- House owners and renters - White residents
- 1,66172.7%Owner occupied
- 62327.3%Renter occupied
- House owners and renters - Black or African American residents
- 83100.0%Renter occupied
- House owners and renters - American Indian / Alaska Native residents
- 16100.0%Owner occupied
- House owners and renters - Asian residents
- 3864.1%Owner occupied
- 2135.9%Renter occupied
- House owners and renters - Other race residents
- 13654.8%Owner occupied
- 11245.2%Renter occupied
- House owners and renters - Two or more races residents
- 19686.4%Owner occupied
- 3113.6%Renter occupied
- House owners and renters - White alone residents
- 1,64074.2%Owner occupied
- 57225.8%Renter occupied
- House owners and renters - Hispanic or Latino residents
- 37756.1%Owner occupied
- 29543.9%Renter occupied
Language usage in Richland Hills
- English speakers - Total
- 83.4% of residents of Richland Hills speak English at home.
- 14.1% of residents speak Spanish at home
- 95281.4%Speak English very well
- 21718.6%Speak English less than very well
- 2.2% of residents speak other language at home
- 13572.6%Speak English very well
- 5127.4%Speak English less than very well
- English speakers - Born in the United States
- 92.8% of residents of Richland Hills speak English at home.
- 5.7% of residents speak Spanish at home
- 153100.0%Speak English very well
- 0.6% of residents speak other language at home
- 17100.0%Speak English very well
- English speakers - Native, born elsewhere
- 37.5% of residents of Richland Hills speak English at home.
- 12.5% of residents speak Spanish at home
- 5100.0%Speak English less than very well
- 60.0% of residents speak other language at home
- 24100.0%Speak English very well
- English speakers - Foreign-born
- 10.7% of residents of Richland Hills speak English at home.
- 67.2% of residents speak Spanish at home
- 28462.7%Speak English very well
- 16937.3%Speak English less than very well
- 21.5% of residents speak other language at home
- 9464.8%Speak English very well
- 5135.2%Speak English less than very well
White (Caucasian) - Speak only English
| Native: | 98.2% (5,495) |
| Foreign-born: | 34.6% (41) |
White (Caucasian) - Speak another language
| Native: | 3.9% (216) |
| Foreign-born: | 69.7% (82) |
Asian - Speak another language
| Native: | 45.0% (22) |
| Foreign-born: | 98.6% (125) |
Other race - Speak only English
| Native: | 75.1% (568) |
| Foreign-born: | 9.6% (18) |
Other race - Speak another language
| Native: | 31.1% (236) |
| Foreign-born: | 90.9% (171) |
Two or more races - Speak only English
| Native: | 81.0% (305) |
| Foreign-born: | 6.6% (11) |
Two or more races - Speak another language
| Native: | 4.9% (18) |
| Foreign-born: | 91.9% (148) |
White alone - Speak only English
| Native: | 99.9% (5,311) |
| Foreign-born: | 63.9% (27) |
White alone - Speak another language
| Native: | 0.5% (25) |
| Foreign-born: | 42.0% (18) |
Hispanic or Latino - Speak only English
| Native: | 59.7% (1,049) |
| Foreign-born: | 8.2% (42) |
Hispanic or Latino - Speak another language
| Native: | 38.9% (683) |
| Foreign-born: | 91.6% (462) |
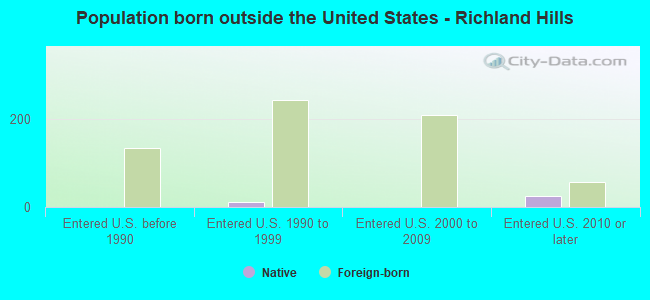
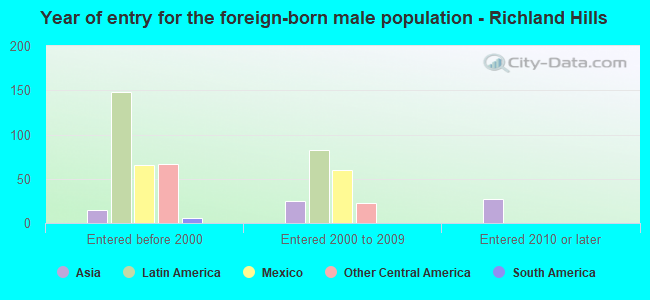
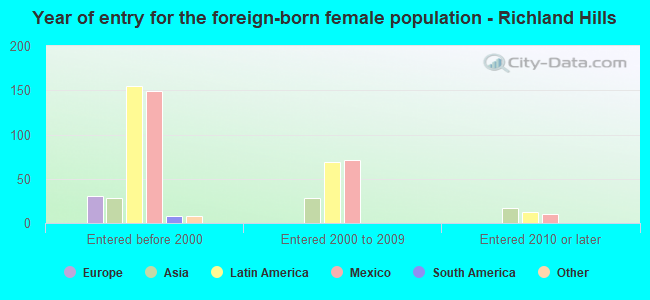
Foreign-born residents in Richland Hills
687 residents are foreign born (5.8% Latin America, 1.6% Asia).
| This city: | 7.9% |
| Texas: | 17.1% |
Marital status for residents in Richland Hills
Marital status - White (Caucasian) population 15 years and over
- Males
- 34.3%Never married
- 49.5%Now married
- 1.5%Separated
- 2.7%Widowed
- 12.0%Divorced
- Females
- 17.3%Never married
- 46.8%Now married
- 2.1%Separated
- 9.0%Widowed
- 24.8%Divorced
Women who gave birth in the past 12 months
| Now married: | 36.8% (6) |
| Unmarried: | 63.2% (10) |
Women who did not give birth in the past 12 months
| Now married: | 55.5% (644) |
| Unmarried: | 44.5% (517) |
Marital status - Black or African American population 15 years and over
- Males
- 58.3%Never married
- 41.7%Now married
- 0.0%Separated
- 0.0%Widowed
- 0.0%Divorced
- Females
- 50.3%Never married
- 6.7%Now married
- 14.1%Separated
- 12.1%Widowed
- 16.8%Divorced
Women who did not give birth in the past 12 months
| Now married: | 21.9% (22) |
| Unmarried: | 78.1% (79) |
Marital status - American Indian / Alaska Native population 15 years and over
- Males
- 50.0%Never married
- 0.0%Now married
- 0.0%Separated
- 0.0%Widowed
- 50.0%Divorced
- Females
- 0.0%Never married
- 38.9%Now married
- 0.0%Separated
- 27.8%Widowed
- 33.3%Divorced
Marital status - Asian population 15 years and over
- Males
- 42.9%Never married
- 57.1%Now married
- 0.0%Separated
- 0.0%Widowed
- 0.0%Divorced
- Females
- 34.8%Never married
- 65.2%Now married
- 0.0%Separated
- 0.0%Widowed
- 0.0%Divorced
Women who did not give birth in the past 12 months
| Now married: | 37.8% (15) |
| Unmarried: | 62.2% (25) |
Marital status - Other race population 15 years and over
- Males
- 51.7%Never married
- 48.3%Now married
- 0.0%Separated
- 0.0%Widowed
- 0.0%Divorced
- Females
- 24.6%Never married
- 10.4%Now married
- 4.4%Separated
- 51.6%Widowed
- 8.9%Divorced
Women who did not give birth in the past 12 months
| Now married: | 25.9% (74) |
| Unmarried: | 74.1% (211) |
Marital status - Two or more races population 15 years and over
- Males
- 11.6%Never married
- 78.9%Now married
- 0.0%Separated
- 0.0%Widowed
- 9.5%Divorced
- Females
- 38.9%Never married
- 41.9%Now married
- 14.8%Separated
- 0.0%Widowed
- 4.4%Divorced
Women who gave birth in the past 12 months
| Now married: | 100.0% (10) |
| Unmarried: | 0.0% (0) |
Women who did not give birth in the past 12 months
| Now married: | 75.7% (97) |
| Unmarried: | 24.3% (31) |
Marital status - White alone, not Hispanic / Latino population 15 years and over
- Males
- 33.9%Never married
- 49.0%Now married
- 1.7%Separated
- 3.0%Widowed
- 12.4%Divorced
- Females
- 13.8%Never married
- 47.5%Now married
- 2.4%Separated
- 9.9%Widowed
- 26.4%Divorced
Women who gave birth in the past 12 months
| Now married: | 36.8% (7) |
| Unmarried: | 63.2% (12) |
Women who did not give birth in the past 12 months
| Now married: | 58.5% (596) |
| Unmarried: | 41.5% (423) |
Marital status - Hispanic or Latino population 15 years and over
- Males
- 36.6%Never married
- 57.4%Now married
- 0.0%Separated
- 0.0%Widowed
- 6.0%Divorced
- Females
- 30.4%Never married
- 25.5%Now married
- 3.3%Separated
- 30.4%Widowed
- 10.4%Divorced
Women who did not give birth in the past 12 months
| Now married: | 39.1% (261) |
| Unmarried: | 60.9% (406) |
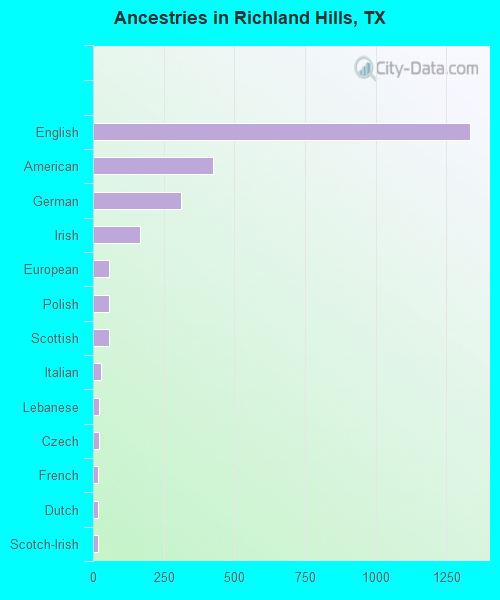
Ancestries in Richland Hills

- 1,33526.7%English
- 4248.5%American
- 3136.2%German
- 1663.3%Irish
- 571.1%European
- 571.1%Polish
- 571.1%Scottish
- 280.6%Italian
- 230.5%Lebanese
- 220.4%Czech
- 170.3%French
- 160.3%Dutch
- 160.3%Scotch-Irish
- 120.2%British
- 120.2%Northern European
- 80.2%Swedish
- 50.10%Danish
- 40.08%Hungarian
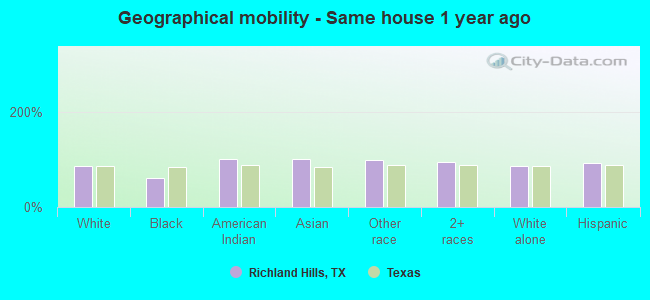
Geographical mobility in Richland Hills

- Same house 1 year ago
- 4,93585.2%White (Caucasian)
- 15060.4%Black or African American
- 50100.0%American Indian / Alaska Native
- 17399.6%Asian
- 95097.6%Other race
- 57494.5%Two or more races
- 4,62585.2%White alone, not Hispanic / Latino
- 2,30391.9%Hispanic or Latino
-
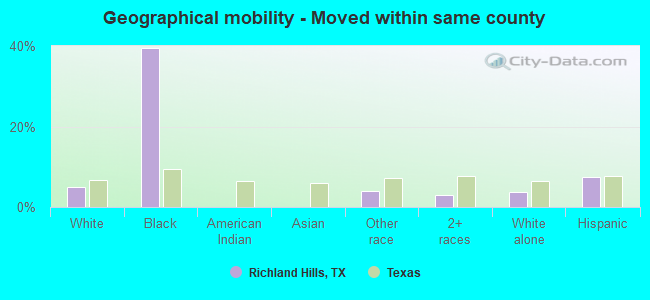
- Moved within same county
- 2935.1%White / Caucasian
- 9839.4%Black or African American
- 394.0%Other race
- 183.0%Two or more races
- 2023.7%White alone, not Hispanic / Latino
- 1887.5%Hispanic or Latino
-
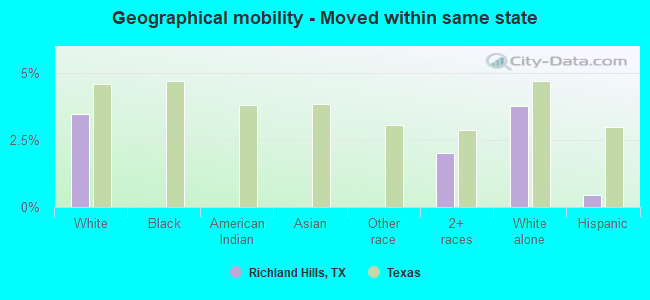
- Moved within same state
- 2003.5%White / Caucasian
- 122.0%Two or more races
- 2043.8%White alone, not Hispanic / Latino
- 110.5%Hispanic or Latino
-
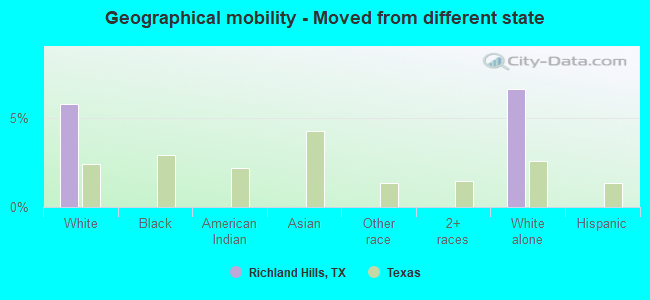
- Moved from different state
- 3325.7%White / Caucasian
- 3586.6%White alone, not Hispanic / Latino
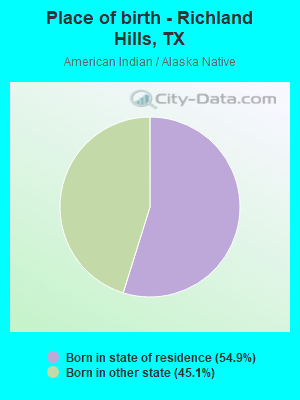
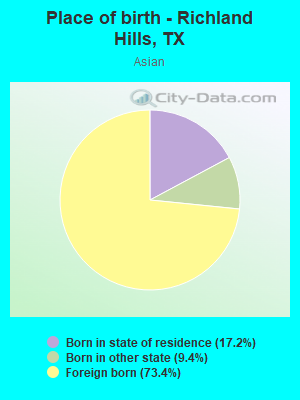
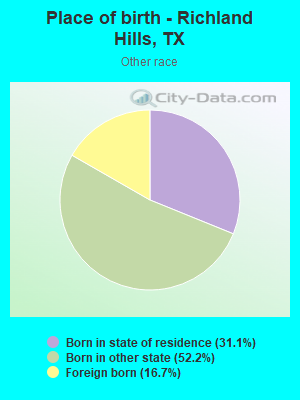
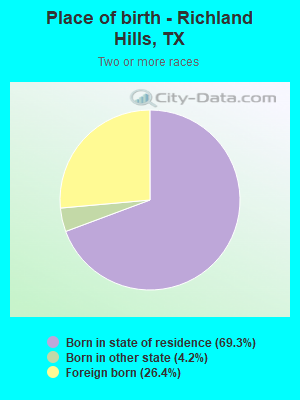
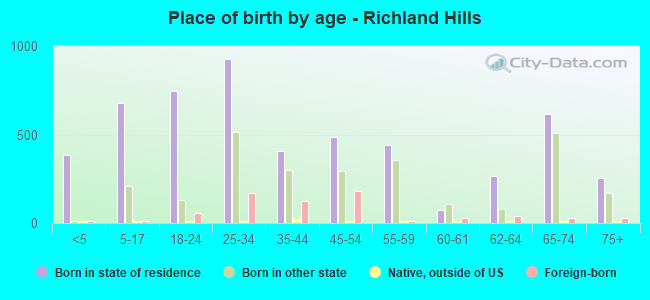
Children Nativity (place of birth) in Richland Hills
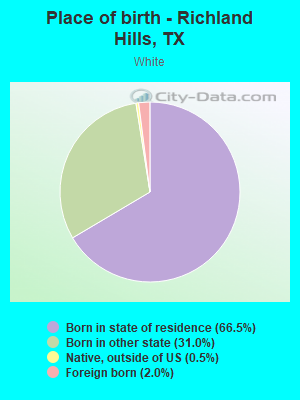
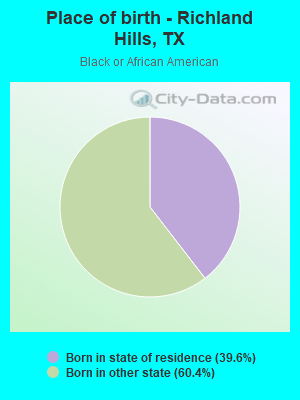
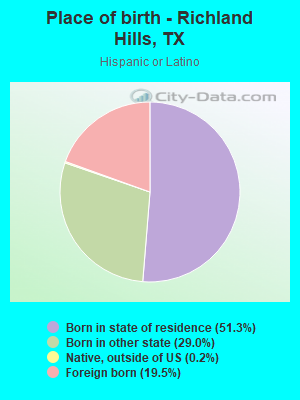
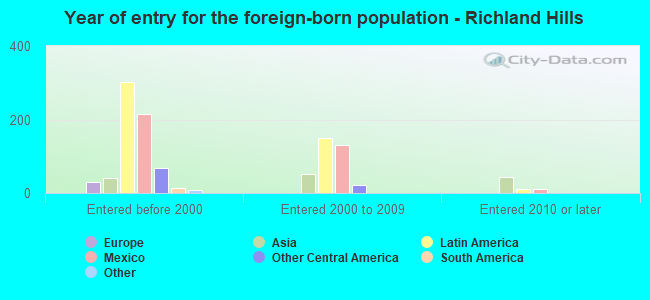
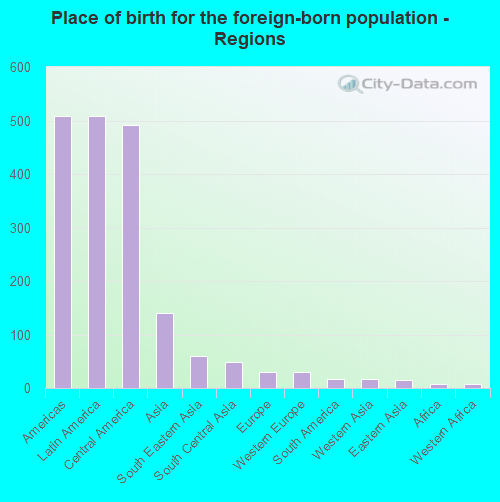
Place of birth for residents in Richland Hills
![Place of birth for the foreign-born population - Regions]()
- 508Americas
- 508Latin America
- 491Central America
- 140Asia
- 59South Eastern Asia
- 49South Central Asia
- 29Europe
- 29Western Europe
- 17South America
- 16Western Asia
- 15Eastern Asia
- 8Africa
- 8Western Africa
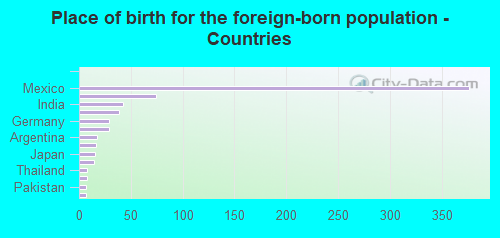
![Place of birth for the foreign-born population - Countries]()
- 377Mexico
- 74El Salvador
- 42India
- 39Guatemala
- 29Germany
- 29Vietnam
- 17Argentina
- 16Lebanon
- 15Japan
- 14Philippines
- 8Thailand
- 8Senegal
- 7Pakistan
- 7Laos
Grandparents responsible for own grandchildren in Richland Hills
Zip codes: 76118.