Races in Richland, Washington (WA) Detailed Stats
Data:
Races - White alone (%)
Races - White alone (% change since 2000)
Races - Black alone (%)
Races - Black alone (% change since 2000)
Races - American Indian alone (%)
Races - American Indian alone (% change since 2000)
Races - Asian alone (%)
Races - Asian alone (% change since 2000)
Races - Hispanic (%)
Races - Hispanic (% change since 2000)
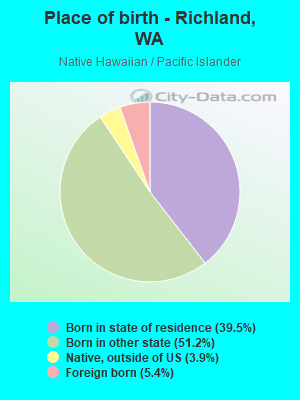
Races - Native Hawaiian and Other Pacific Islander alone (%)
Races - Native Hawaiian and Other Pacific Islander alone (% change since 2000)
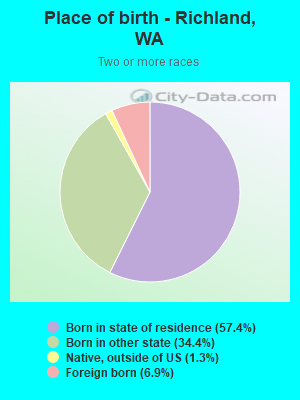
Races - Two or more races(%)
Races - Two or more races(% change since 2000)
Races - Other race alone (%)
Races - Other race alone (% change since 2000)
Racial diversity
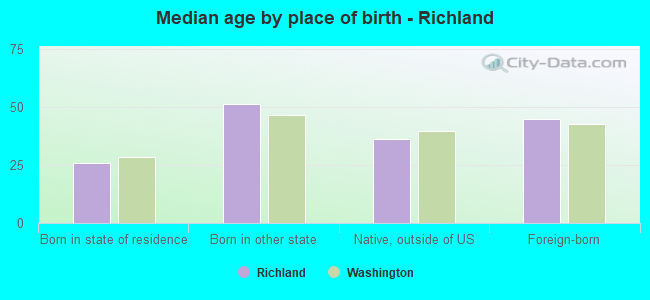
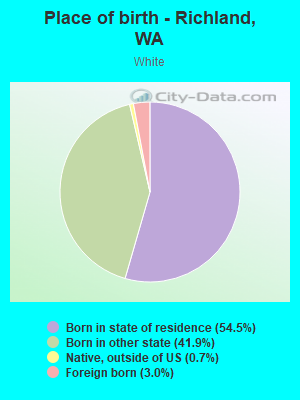
Place of birth - Born in state of residence (%)
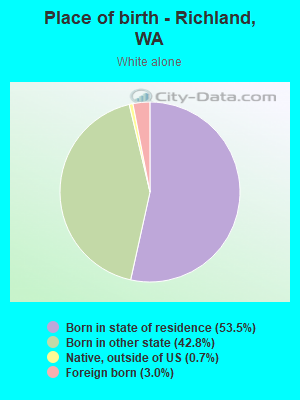
Place of birth - Born in state of residence (%) - White
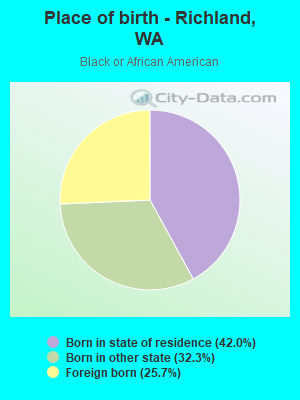
Place of birth - Born in state of residence (%) - Black or African American
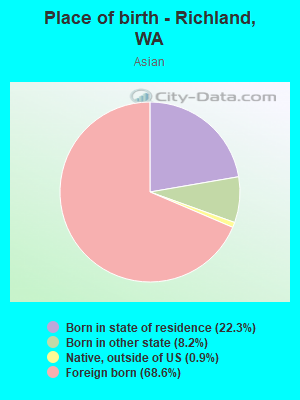
Place of birth - Born in state of residence (%) - Asian
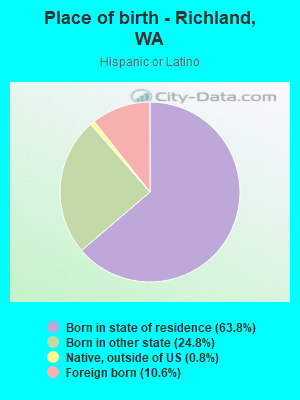
Place of birth - Born in state of residence (%) - Hispanic or Latino
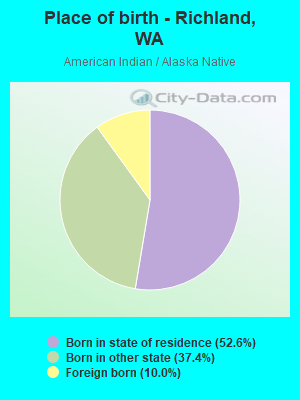
Place of birth - Born in state of residence (%) - American Indian and Alaska Native
Place of birth - Born in state of residence (%) - Multirace
Place of birth - Born in state of residence (%) - Other Race
Place of birth - Born in other state (%)
Place of birth - Born in other state (%) - White
Place of birth - Born in other state (%) - Black or African American
Place of birth - Born in other state (%) - Asian
Place of birth - Born in other state (%) - Hispanic or Latino
Place of birth - Born in other state (%) - American Indian and Alaska Native
Place of birth - Born in other state (%) - Multirace
Place of birth - Born in other state (%) - Other Race
Place of birth - Native, outside of US (%)
Place of birth - Native, outside of US (%) - White
Place of birth - Native, outside of US (%) - Black or African American
Place of birth - Native, outside of US (%) - Asian
Place of birth - Native, outside of US (%) - Hispanic or Latino
Place of birth - Native, outside of US (%) - American Indian and Alaska Native
Place of birth - Native, outside of US (%) - Multirace
Place of birth - Native, outside of US (%) - Other Race
Place of birth - Foreign born (%)
Place of birth - Foreign born (%) - White
Place of birth - Foreign born (%) - Black or African American
Place of birth - Foreign born (%) - Asian
Place of birth - Foreign born (%) - Hispanic or Latino
Place of birth - Foreign born (%) - American Indian and Alaska Native
Place of birth - Foreign born (%) - Multirace
Place of birth - Foreign born (%) - Other Race
Residents speaking English at home (%)
Residents speaking English at home - Born in the United States (%)
Residents speaking English at home - Native, born elsewhere (%)
Residents speaking English at home - Foreign born (%)
Residents speaking Spanish at home (%)
Residents speaking Spanish at home - Born in the United States (%)
Residents speaking Spanish at home - Native, born elsewhere (%)
Residents speaking Spanish at home - Foreign born (%)
Residents speaking other language at home (%)
Residents speaking other language at home - Born in the United States (%)
Residents speaking other language at home - Native, born elsewhere (%)
Residents speaking other language at home - Foreign born (%)
Marital status - Never married (%)
Marital status - Now married (%)
Marital status - Separated (%)
Marital status - Widowed (%)
Marital status - Divorced (%)
Ancestries Reported - Arab (%)
Ancestries Reported - Czech (%)
Ancestries Reported - Danish (%)
Ancestries Reported - Dutch (%)
Ancestries Reported - English (%)
Ancestries Reported - French (%)
Ancestries Reported - French Canadian (%)
Ancestries Reported - German (%)
Ancestries Reported - Greek (%)
Ancestries Reported - Hungarian (%)
Ancestries Reported - Irish (%)
Ancestries Reported - Italian (%)
Ancestries Reported - Lithuanian (%)
Ancestries Reported - Norwegian (%)
Ancestries Reported - Polish (%)
Ancestries Reported - Portuguese (%)
Ancestries Reported - Russian (%)
Ancestries Reported - Scotch-Irish (%)
Ancestries Reported - Scottish (%)
Ancestries Reported - Slovak (%)
Ancestries Reported - Subsaharan African (%)
Ancestries Reported - Swedish (%)
Ancestries Reported - Swiss (%)
Ancestries Reported - Ukrainian (%)
Ancestries Reported - United States (%)
Ancestries Reported - Welsh (%)
Ancestries Reported - West Indian (%)
Ancestries Reported - Other (%)
Geographical mobility - Same house 1 year ago (%)
Geographical mobility - Same house 1 year ago (%) - White
Geographical mobility - Same house 1 year ago (%) - Black or African American
Geographical mobility - Same house 1 year ago (%) - Asian
Geographical mobility - Same house 1 year ago (%) - Hispanic or Latino
Geographical mobility - Same house 1 year ago (%) - American Indian and Alaska Native
Geographical mobility - Same house 1 year ago (%) - Multirace
Geographical mobility - Same house 1 year ago (%) - Other Race
Geographical mobility - Moved within same county (%)
Geographical mobility - Moved within same county (%) - White
Geographical mobility - Moved within same county (%) - Black or African American
Geographical mobility - Moved within same county (%) - Asian
Geographical mobility - Moved within same county (%) - Hispanic or Latino
Geographical mobility - Moved within same county (%) - American Indian and Alaska Native
Geographical mobility - Moved within same county (%) - Multirace
Geographical mobility - Moved within same county (%) - Other Race
Geographical mobility - Moved from different county within same state (%)
Geographical mobility - Moved from different county within same state (%) - White
Geographical mobility - Moved from different county within same state (%) - Black or African American
Geographical mobility - Moved from different county within same state (%) - Asian
Geographical mobility - Moved from different county within same state (%) - Hispanic or Latino
Geographical mobility - Moved from different county within same state (%) - American Indian and Alaska Native
Geographical mobility - Moved from different county within same state (%) - Multirace
Geographical mobility - Moved from different county within same state (%) - Other Race
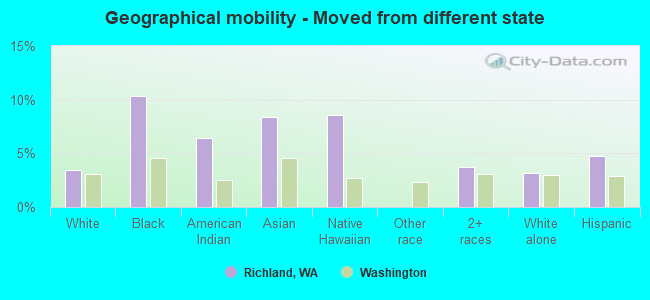
Geographical mobility - Moved from different state (%)
Geographical mobility - Moved from different state (%) - White
Geographical mobility - Moved from different state (%) - Black or African American
Geographical mobility - Moved from different state (%) - Asian
Geographical mobility - Moved from different state (%) - Hispanic or Latino
Geographical mobility - Moved from different state (%) - American Indian and Alaska Native
Geographical mobility - Moved from different state (%) - Multirace
Geographical mobility - Moved from different state (%) - Other Race
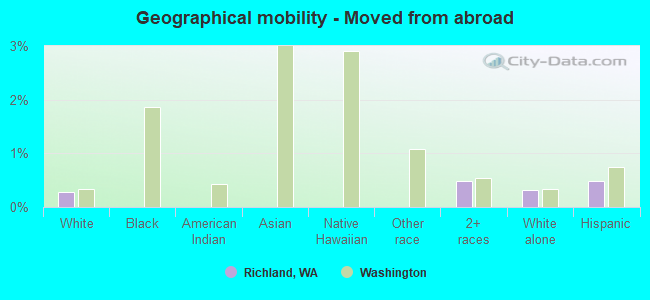
Geographical mobility - Moved from abroad (%)
Geographical mobility - Moved from abroad (%) - White
Geographical mobility - Moved from abroad (%) - Black or African American
Geographical mobility - Moved from abroad (%) - Asian
Geographical mobility - Moved from abroad (%) - Hispanic or Latino
Geographical mobility - Moved from abroad (%) - American Indian and Alaska Native
Geographical mobility - Moved from abroad (%) - Multirace
Geographical mobility - Moved from abroad (%) - Other Race
Place of birth for the foreign-born population - Ireland (%)
Place of birth for the foreign-born population - Denmark (%)
Place of birth for the foreign-born population - Norway (%)
Place of birth for the foreign-born population - Sweden (%)
Place of birth for the foreign-born population - United Kingdom (%)
Place of birth for the foreign-born population - England (%)
Place of birth for the foreign-born population - Scotland (%)
Place of birth for the foreign-born population - Other Northern Europe (%)
Place of birth for the foreign-born population - Austria (%)
Place of birth for the foreign-born population - Belgium (%)
Place of birth for the foreign-born population - France (%)
Place of birth for the foreign-born population - Germany (%)
Place of birth for the foreign-born population - Netherlands (%)
Place of birth for the foreign-born population - Switzerland (%)
Place of birth for the foreign-born population - Other Western Europe (%)
Place of birth for the foreign-born population - Greece (%)
Place of birth for the foreign-born population - Italy (%)
Place of birth for the foreign-born population - Portugal (%)
Place of birth for the foreign-born population - Spain (%)
Place of birth for the foreign-born population - Other Southern Europe (%)
Place of birth for the foreign-born population - Albania (%)
Place of birth for the foreign-born population - Belarus (%)
Place of birth for the foreign-born population - Bosnia and Herzegovina (%)
Place of birth for the foreign-born population - Bulgaria (%)
Place of birth for the foreign-born population - Croatia (%)
Place of birth for the foreign-born population - Czechoslovakia (%)
Place of birth for the foreign-born population - Hungary (%)
Place of birth for the foreign-born population - Latvia (%)
Place of birth for the foreign-born population - Lithuania (%)
Place of birth for the foreign-born population - North Macedonia (Macedonia) (%)
Place of birth for the foreign-born population - Moldova (%)
Place of birth for the foreign-born population - Poland (%)
Place of birth for the foreign-born population - Romania (%)
Place of birth for the foreign-born population - Russia (%)
Place of birth for the foreign-born population - Serbia (%)
Place of birth for the foreign-born population - Ukraine (%)
Place of birth for the foreign-born population - Other Eastern Europe (%)
Place of birth for the foreign-born population - China (%)
Place of birth for the foreign-born population - Hong Kong (%)
Place of birth for the foreign-born population - Taiwan (%)
Place of birth for the foreign-born population - Japan (%)
Place of birth for the foreign-born population - Korea (%)
Place of birth for the foreign-born population - Other Eastern Asia (%)
Place of birth for the foreign-born population - Afghanistan (%)
Place of birth for the foreign-born population - Bangladesh (%)
Place of birth for the foreign-born population - India (%)
Place of birth for the foreign-born population - Iran (%)
Place of birth for the foreign-born population - Kazakhstan (%)
Place of birth for the foreign-born population - Nepal (%)
Place of birth for the foreign-born population - Pakistan (%)
Place of birth for the foreign-born population - Sri Lanka (%)
Place of birth for the foreign-born population - Uzbekistan (%)
Place of birth for the foreign-born population - Other South Central Asia (%)
Place of birth for the foreign-born population - Burma (%)
Place of birth for the foreign-born population - Cambodia (%)
Place of birth for the foreign-born population - Indonesia (%)
Place of birth for the foreign-born population - Laos (%)
Place of birth for the foreign-born population - Malaysia (%)
Place of birth for the foreign-born population - Philippines (%)
Place of birth for the foreign-born population - Singapore (%)
Place of birth for the foreign-born population - Thailand (%)
Place of birth for the foreign-born population - Vietnam (%)
Place of birth for the foreign-born population - Other South Eastern Asia (%)
Place of birth for the foreign-born population - Armenia (%)
Place of birth for the foreign-born population - Iraq (%)
Place of birth for the foreign-born population - Israel (%)
Place of birth for the foreign-born population - Jordan (%)
Place of birth for the foreign-born population - Kuwait (%)
Place of birth for the foreign-born population - Lebanon (%)
Place of birth for the foreign-born population - Saudi Arabia (%)
Place of birth for the foreign-born population - Syria (%)
Place of birth for the foreign-born population - Turkey (%)
Place of birth for the foreign-born population - Yemen (%)
Place of birth for the foreign-born population - Other Western Asia (%)
Place of birth for the foreign-born population - Eritrea (%)
Place of birth for the foreign-born population - Ethiopia (%)
Place of birth for the foreign-born population - Kenya (%)
Place of birth for the foreign-born population - Somalia (%)
Place of birth for the foreign-born population - Uganda (%)
Place of birth for the foreign-born population - Zimbabwe (%)
Place of birth for the foreign-born population - Other Eastern Africa (%)
Place of birth for the foreign-born population - Cameroon (%)
Place of birth for the foreign-born population - Congo (%)
Place of birth for the foreign-born population - Democratic Republic of Congo (Zaire) (%)
Place of birth for the foreign-born population - Other Middle Africa (%)
Place of birth for the foreign-born population - Egypt (%)
Place of birth for the foreign-born population - Morocco (%)
Place of birth for the foreign-born population - Sudan (%)
Place of birth for the foreign-born population - Other Northern Africa (%)
Place of birth for the foreign-born population - South Africa (%)
Place of birth for the foreign-born population - Other Southern Africa (%)
Place of birth for the foreign-born population - Cabo Verde (%)
Place of birth for the foreign-born population - Ghana (%)
Place of birth for the foreign-born population - Liberia (%)
Place of birth for the foreign-born population - Nigeria (%)
Place of birth for the foreign-born population - Senegal (%)
Place of birth for the foreign-born population - Sierra Leone (%)
Place of birth for the foreign-born population - Other Western Africa (%)
Place of birth for the foreign-born population - Australia (%)
Place of birth for the foreign-born population - New Zealand (%)
Place of birth for the foreign-born population - Fiji (%)
Place of birth for the foreign-born population - Micronesia (%)
Place of birth for the foreign-born population - Bahamas (%)
Place of birth for the foreign-born population - Barbados (%)
Place of birth for the foreign-born population - Cuba (%)
Place of birth for the foreign-born population - Dominica (%)
Place of birth for the foreign-born population - Dominican Republic (%)
Place of birth for the foreign-born population - Grenada (%)
Place of birth for the foreign-born population - Haiti (%)
Place of birth for the foreign-born population - Jamaica (%)
Place of birth for the foreign-born population - St. Vincent and the Grenadines (%)
Place of birth for the foreign-born population - Trinidad and Tobago (%)
Place of birth for the foreign-born population - West Indies (%)
Place of birth for the foreign-born population - Other Caribbean (%)
Place of birth for the foreign-born population - Belize (%)
Place of birth for the foreign-born population - Costa Rica (%)
Place of birth for the foreign-born population - El Salvador (%)
Place of birth for the foreign-born population - Guatemala (%)
Place of birth for the foreign-born population - Honduras (%)
Place of birth for the foreign-born population - Mexico (%)
Place of birth for the foreign-born population - Nicaragua (%)
Place of birth for the foreign-born population - Panama (%)
Place of birth for the foreign-born population - Other Central America (%)
Place of birth for the foreign-born population - Argentina (%)
Place of birth for the foreign-born population - Bolivia (%)
Place of birth for the foreign-born population - Brazil (%)
Place of birth for the foreign-born population - Chile (%)
Place of birth for the foreign-born population - Colombia (%)
Place of birth for the foreign-born population - Ecuador (%)
Place of birth for the foreign-born population - Guyana (%)
Place of birth for the foreign-born population - Peru (%)
Place of birth for the foreign-born population - Uruguay (%)
Place of birth for the foreign-born population - Venezuela (%)
Place of birth for the foreign-born population - Other South America (%)
Place of birth for the foreign-born population - Canada (%)
Place of birth for the foreign-born population - Other Northern America (%)
Place of birth for the foreign-born population - Other (%)
Latest news about races in Richland, WA collected exclusively by city-data.com from local newspapers, TV, and radio stations
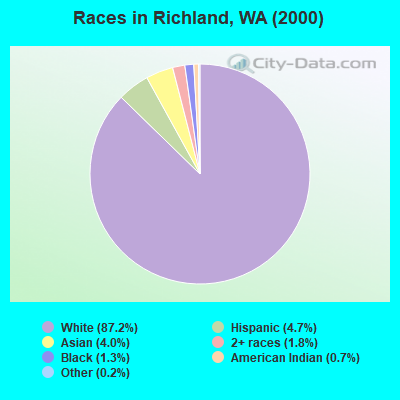
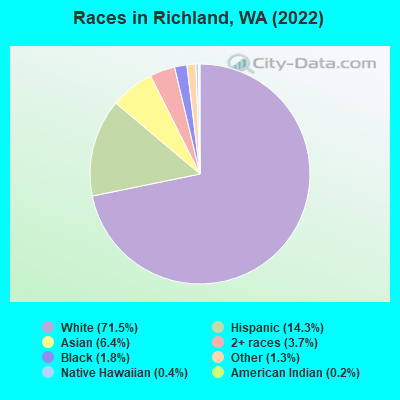
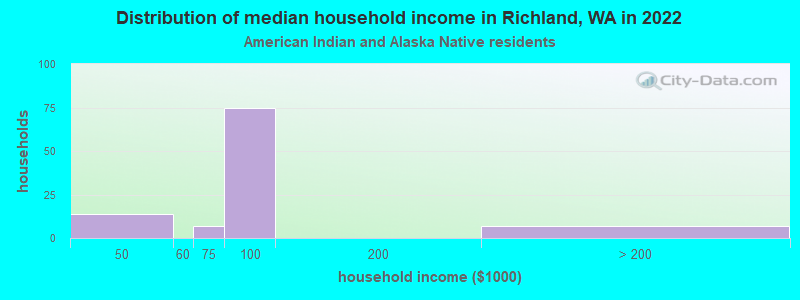
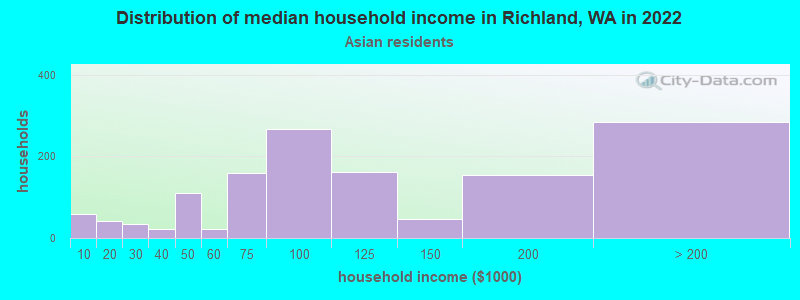
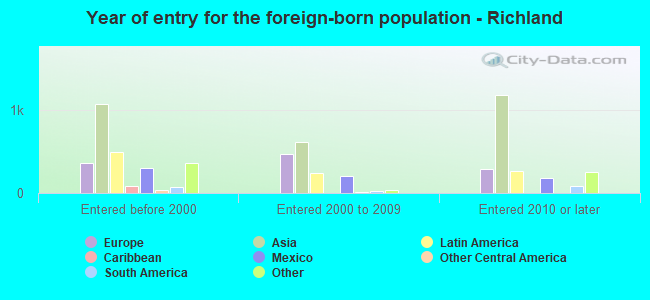
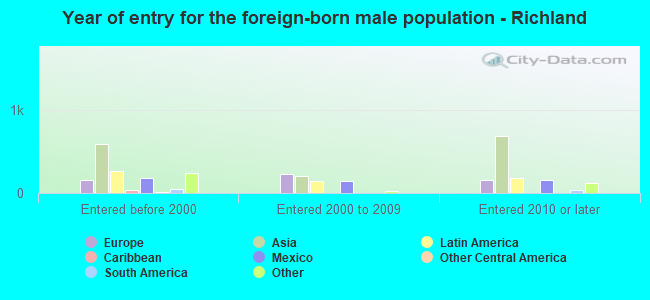
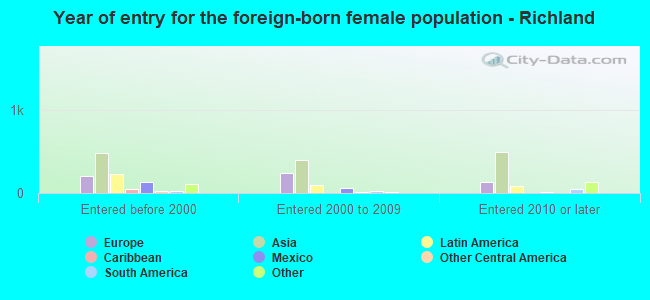
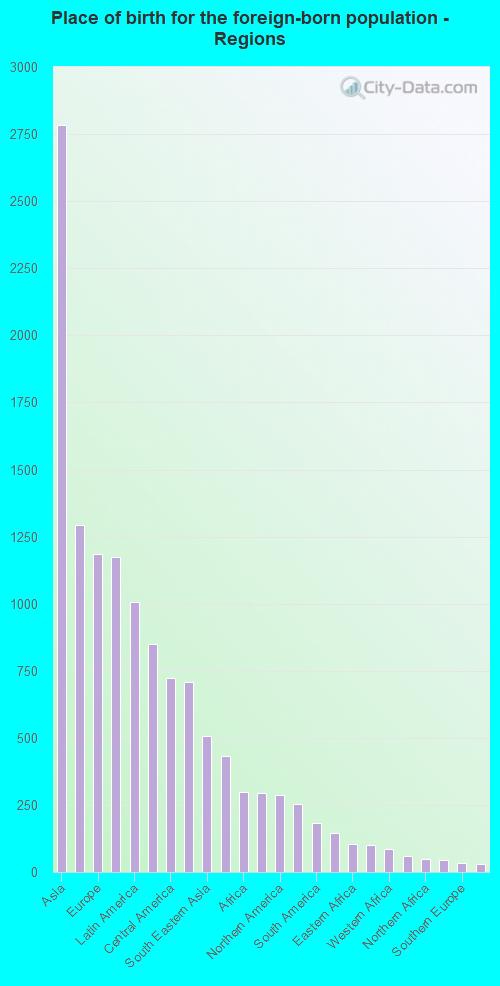
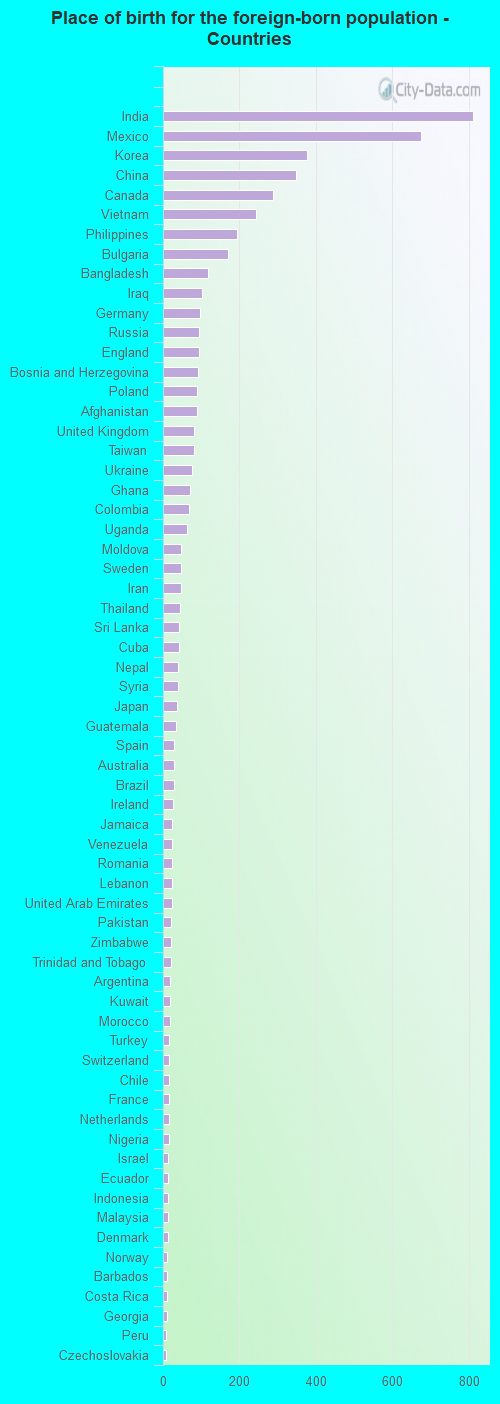
According to 2022 data, the most numerous races in Richland, WA are White alone (44,600 residents), Hispanic (8,920 residents), and Asian alone (3,974 residents). 88.6% of Richland residents speak English at home. 9.0% of Richland, WA residents are foreign-born (4.4% born in Asia, 1.9% born in Europe, 1.6% born in Latin America), which is 66.9% less than the foreign-born rate of 15.0% across the entire state of Washington.
Race distribution in Richland
2000 2022
4,652,490 78.9% White alone 441,509 7.5% Hispanic 319,401 5.4% Asian alone 184,631 3.1% Black alone 175,926 3.0% Two or more races 85,396 1.4% American Indian alone 22,779 0.4% Native Hawaiian and Other 11,989 0.2% Other race alone
4,941,456 63.5% White alone 1,093,313 14.0% Hispanic 755,832 9.7% Asian alone 523,448 6.7% Two or more races 299,537 3.8% Black alone 69,024 0.9% American Indian alone 52,231 0.7% Native Hawaiian and Other 50,945 0.7% Other race alone
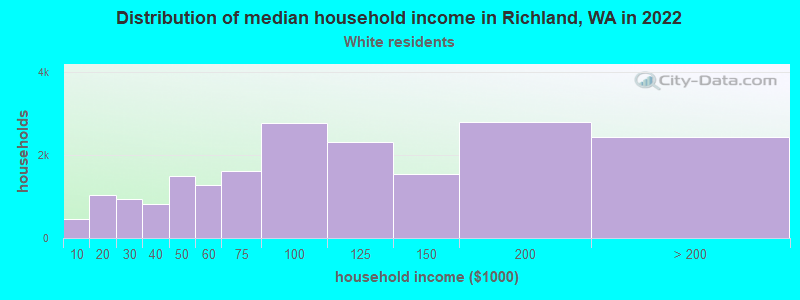
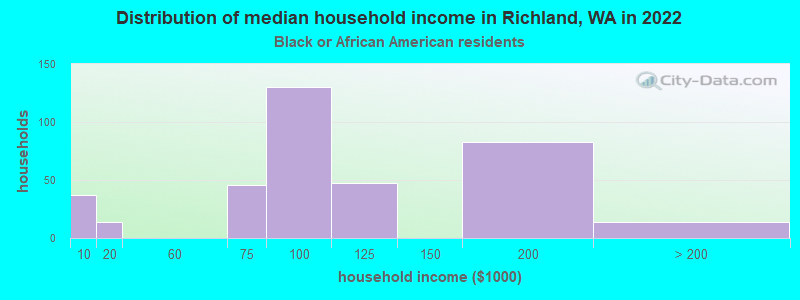
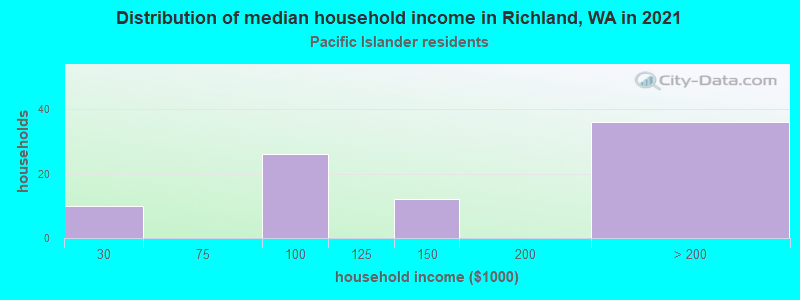
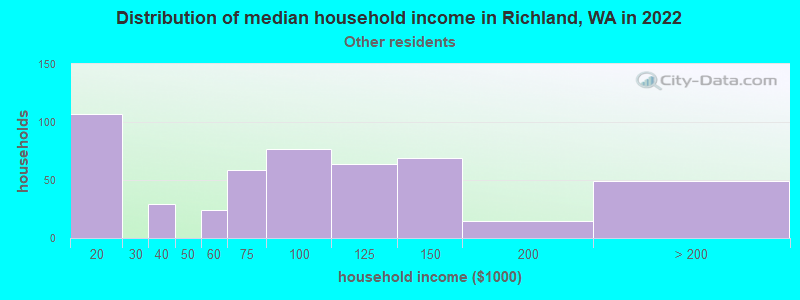
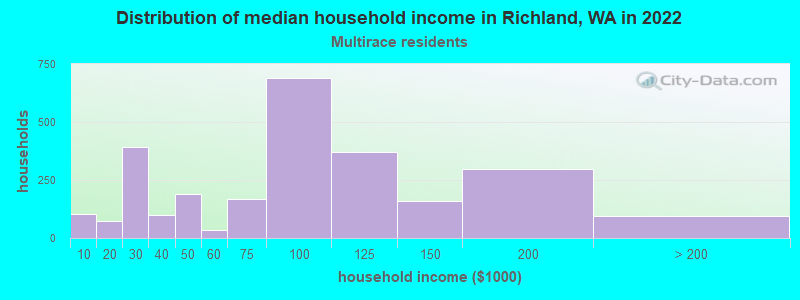
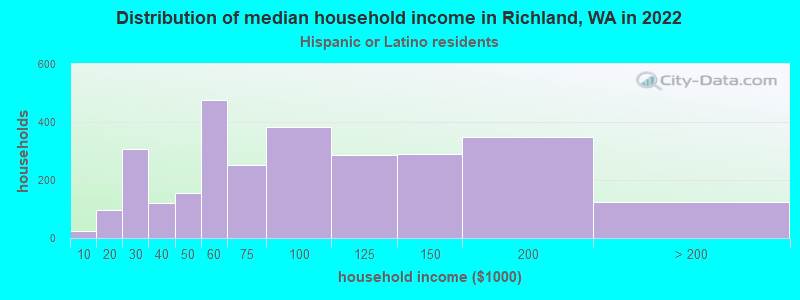
Income and house value in Richland Median household income in 2022 $93,463 White non-Hispanic householders$103,695 Black householders$100,111 American Indian and Alaska Native householders$115,474 Asian householders$76,199 Some other race householders$85,040 Two or more races householders$71,735 Hispanic or Latino race householdersMedian 2022 house value $442,354 White Non-Hispanic householders$705,760 Black or African American householders$537,886 American Indian or Alaska Native householders $563,846 Asian householders$475,929 Native Hawaiian and other Pacific Islander householders$328,824 Some other race householders$338,169 Two or more races householders$367,936 Hispanic or Latino householders
Median age by race in Richland
41.2 Median age for White residents39.2 43.1 25.2 Median age for Black or African American residents29.8 47.9 26.5 Median age for American Indian / Alaska Native residents16.0 30.0 35.7 Median age for Asian residents35.9 38.8 25.6 Median age for Native Hawaiian / Pacific Islander residents27.6 16.4 26.7 Median age for Other race residents28.6 30.9 22.8 Median age for Two or more races residents20.9 24.3 42.0 Median age for White alone residents40.0 42.8 22.8 Median age for Hispanic or Latino residents19.6 26.1
Owner/renter occupied households by race in Richland
House owners and renters - White residents 13,743 69.9% Owner occupied5,931 30.1% Renter occupiedHouse owners and renters - Black or African American residents 110 33.6% Owner occupied218 66.4% Renter occupiedHouse owners and renters - American Indian / Alaska Native residents 31 29.8% Owner occupied72 70.2% Renter occupiedHouse owners and renters - Asian residents 603 52.4% Owner occupied547 47.6% Renter occupiedHouse owners and renters - Native Hawaiian / Pacific Islander residents 34 45.8% Owner occupied41 54.2% Renter occupiedHouse owners and renters - Other race residents 147 26.6% Owner occupied406 73.4% Renter occupiedHouse owners and renters - Two or more races residents 1,531 60.7% Owner occupied993 39.3% Renter occupiedHouse owners and renters - White alone residents 13,284 68.7% Owner occupied6,047 31.3% Renter occupiedHouse owners and renters - Hispanic or Latino residents 1,485 58.0% Owner occupied1,074 42.0% Renter occupied
Language usage in Richland
English speakers - Total 88.6% of residents of Richland speak English at home.
5.2% of residents speak Spanish at home 2,341 76.1% Speak English very well735 23.9% Speak English less than very well6.7% of residents speak other language at home 2,582 66.0% Speak English very well1,331 34.0% Speak English less than very well
English speakers - Born in the United States 96.5% of residents of Richland speak English at home.
4.0% of residents speak Spanish at home 659 70.9% Speak English very well271 29.1% Speak English less than very well1.2% of residents speak other language at home 266 94.3% Speak English very well16 5.7% Speak English less than very well
English speakers - Native, born elsewhere 99.3% of residents of Richland speak English at home.
15.1% of residents speak Spanish at home 9 13.2% Speak English very well59 86.8% Speak English less than very well7.1% of residents speak other language at home 32 100.0% Speak English very well
English speakers - Foreign-born 17.9% of residents of Richland speak English at home.
17.6% of residents speak Spanish at home 619 63.9% Speak English very well350 36.1% Speak English less than very well59.3% of residents speak other language at home 1,887 57.9% Speak English very well1,370 42.1% Speak English less than very well
White (Caucasian) - Speak only English Native:
98.8% (42,857)Foreign-born:
35.8% (479)
White (Caucasian) - Speak another language Native:
2.0% (879)Foreign-born:
64.7% (866)
Black or African American - Speak only English Native:
100.0% (705)Foreign-born:
100.0% (271)
Black or African American - Speak another language Native:
0.7% (5)Foreign-born:
10.0% (27)
American Indian / Alaska Native - Speak another language Native:
11.9% (32)Foreign-born:
100.0% (22)
Asian - Speak only English Native:
49.4% (401)Foreign-born:
7.0% (183)
Asian - Speak another language Native:
49.0% (397)Foreign-born:
93.9% (2,454)
Native Hawaiian / Pacific Islander - Speak another language Native:
53.8% (126)Foreign-born:
96.0% (15)
Other race - Speak another language Native:
35.0% (368)Foreign-born:
100.0% (341)
Two or more races - Speak only English Native:
84.7% (5,444)Foreign-born:
7.9% (43)
Two or more races - Speak another language Native:
15.5% (995)Foreign-born:
90.6% (496)
White alone - Speak only English Native:
98.8% (40,999)Foreign-born:
40.0% (523)
White alone - Speak another language Native:
1.2% (518)Foreign-born:
60.0% (785)
Hispanic or Latino - Speak only English Native:
88.0% (6,097)Foreign-born:
2.1% (20)
Hispanic or Latino - Speak another language Native:
24.0% (1,663)Foreign-born:
97.4% (916)
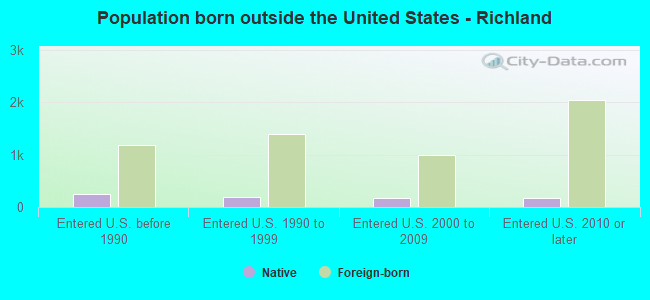
Foreign-born residents in Richland 5,609 residents are foreign born (4.4% Asia , 1.9% Europe , 1.6% Latin America ).
This city:
9.0%Washington:
14.9%
Marital status for residents in Richland Marital status - White (Caucasian) population 15 years and over
Males 33.2% Never married52.4% Now married1.6% Separated2.7% Widowed10.2% DivorcedFemales 26.6% Never married48.7% Now married2.0% Separated6.8% Widowed16.0% DivorcedWomen who gave birth in the past 12 months Now married:
63.1% (273)Unmarried:
36.9% (160)
Women who did not give birth in the past 12 months Now married:
44.4% (4,349)Unmarried:
55.6% (5,452)
Marital status - Black or African American population 15 years and over
Males 62.4% Never married25.1% Now married0.0% Separated8.8% Widowed3.7% DivorcedFemales 30.5% Never married61.5% Now married0.0% Separated0.0% Widowed8.0% DivorcedWomen who did not give birth in the past 12 months Now married:
66.2% (172)Unmarried:
33.8% (88)
Marital status - American Indian / Alaska Native population 15 years and over
Males 71.0% Never married10.8% Now married18.3% Separated0.0% Widowed0.0% DivorcedFemales 65.2% Never married24.8% Now married0.0% Separated0.0% Widowed9.9% DivorcedWomen who did not give birth in the past 12 months Now married:
13.2% (19)Unmarried:
86.8% (124)
Marital status - Asian population 15 years and over
Males 34.1% Never married60.9% Now married0.0% Separated4.5% Widowed0.5% DivorcedFemales 27.7% Never married60.1% Now married0.0% Separated3.6% Widowed8.6% DivorcedWomen who gave birth in the past 12 months Now married:
100.0% (30)Unmarried:
0.0% (0)
Women who did not give birth in the past 12 months Now married:
61.1% (575)Unmarried:
38.9% (366)
Marital status - Native Hawaiian / Pacific Islander population 15 years and over
Males 85.8% Never married0.0% Now married0.0% Separated0.0% Widowed14.2% DivorcedFemales 37.2% Never married19.1% Now married0.0% Separated0.0% Widowed43.6% DivorcedWomen who did not give birth in the past 12 months Now married:
9.5% (9)Unmarried:
90.5% (82)
Marital status - Other race population 15 years and over
Males 49.3% Never married42.9% Now married1.5% Separated0.0% Widowed6.2% DivorcedFemales 41.3% Never married40.9% Now married1.0% Separated7.8% Widowed9.0% DivorcedWomen who gave birth in the past 12 months Now married:
100.0% (7)Unmarried:
0.0% (0)
Women who did not give birth in the past 12 months Now married:
25.3% (109)Unmarried:
74.7% (322)
Marital status - Two or more races population 15 years and over
Males 53.1% Never married35.3% Now married0.0% Separated1.1% Widowed10.5% DivorcedFemales 42.7% Never married34.0% Now married0.0% Separated7.3% Widowed15.9% DivorcedWomen who gave birth in the past 12 months Now married:
92.9% (124)Unmarried:
7.1% (9)
Women who did not give birth in the past 12 months Now married:
22.0% (324)Unmarried:
78.0% (1,150)
Marital status - White alone, not Hispanic / Latino population 15 years and over
Males 31.0% Never married53.8% Now married1.6% Separated2.8% Widowed10.8% DivorcedFemales 24.7% Never married49.7% Now married2.0% Separated7.2% Widowed16.4% DivorcedWomen who gave birth in the past 12 months Now married:
61.2% (257)Unmarried:
38.8% (163)
Women who did not give birth in the past 12 months Now married:
45.8% (4,144)Unmarried:
54.2% (4,912)
Marital status - Hispanic or Latino population 15 years and over
Males 65.1% Never married29.8% Now married0.8% Separated0.4% Widowed3.9% DivorcedFemales 52.8% Never married27.0% Now married1.0% Separated5.0% Widowed14.1% DivorcedWomen who gave birth in the past 12 months Now married:
100.0% (64)Unmarried:
0.0% (0)
Women who did not give birth in the past 12 months Now married:
25.6% (512)Unmarried:
74.4% (1,486)
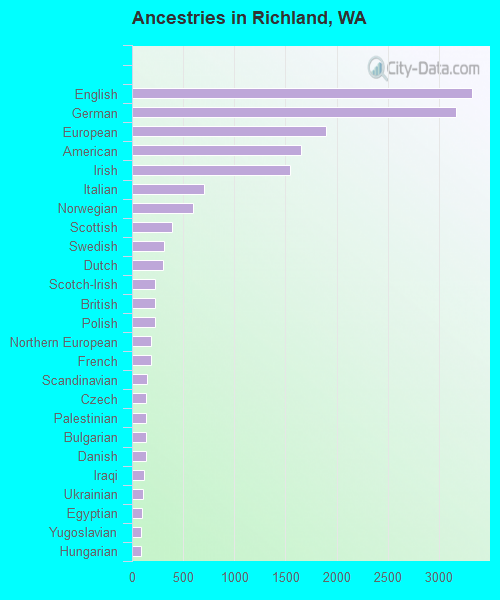
Ancestries in Richland
3,324 12.2% English3,167 11.6% German1,896 7.0% European1,651 6.1% American1,544 5.7% Irish702 2.6% Italian594 2.2% Norwegian388 1.4% Scottish311 1.1% Swedish300 1.1% Dutch224 0.8% Scotch-Irish223 0.8% British220 0.8% Polish190 0.7% Northern European186 0.7% French150 0.6% Scandinavian136 0.5% Czech132 0.5% Palestinian132 0.5% Bulgarian132 0.5% Danish116 0.4% Iraqi109 0.4% Ukrainian99 0.4% Egyptian88 0.3% Yugoslavian87 0.3% Hungarian82 0.3% French Canadian78 0.3% Russian73 0.3% Ugandan72 0.3% Croatian72 0.3% Slovak70 0.3% Albanian69 0.3% Moroccan66 0.2% Finnish62 0.2% Nigerian60 0.2% Austrian56 0.2% Afghan50 0.2% Welsh29 0.1% Serbian21 0.08% Canadian20 0.07% Eastern European19 0.07% Romanian18 0.07% Lebanese16 0.06% Syrian15 0.06% Latvian15 0.06% Swiss14 0.05% Portuguese13 0.05% Trinidadian and Tobagonian11 0.04% Turkish9 0.03% Barbadian6 0.02% Ghanaian
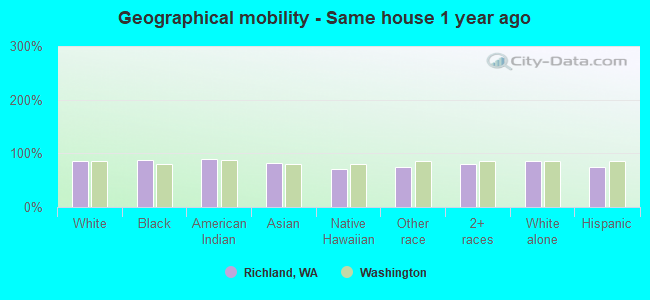
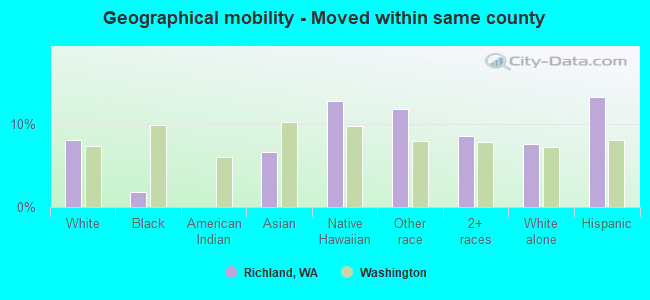
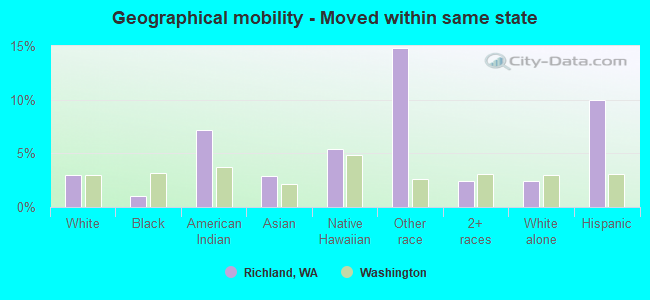
Geographical mobility in Richland Same house 1 year ago 39,271 85.3% White (Caucasian)860 88.6% Black or African American273 89.9% American Indian / Alaska Native3,162 81.7% Asian212 71.0% Native Hawaiian / Pacific Islander1,159 74.1% Other race6,270 81.1% Two or more races38,466 86.6% White alone, not Hispanic / Latino6,527 75.4% Hispanic or LatinoMoved within same county 3,720 8.1% White / Caucasian17 1.8% Black or African American260 6.7% Asian38 12.9% Native Hawaiian / Pacific Islander185 11.8% Other race661 8.6% Two or more races3,370 7.6% White alone, not Hispanic / Latino1,158 13.4% Hispanic or LatinoMoved within same state 1,391 3.0% White / Caucasian10 1.1% Black or African American22 7.2% American Indian / Alaska Native111 2.9% Asian16 5.4% Native Hawaiian / Pacific Islander232 14.8% Other race184 2.4% Two or more races1,056 2.4% White alone, not Hispanic / Latino860 9.9% Hispanic or LatinoMoved from different state 1,607 3.5% White / Caucasian100 10.3% Black or African American20 6.4% American Indian / Alaska Native325 8.4% Asian26 8.6% Native Hawaiian / Pacific Islander285 3.7% Two or more races1,422 3.2% White alone, not Hispanic / Latino408 4.7% Hispanic or LatinoMoved from abroad 131 0.3% White37 0.5% Two or more races143 0.3% White alone, not Hispanic / Latino42 0.5% Hispanic or Latino
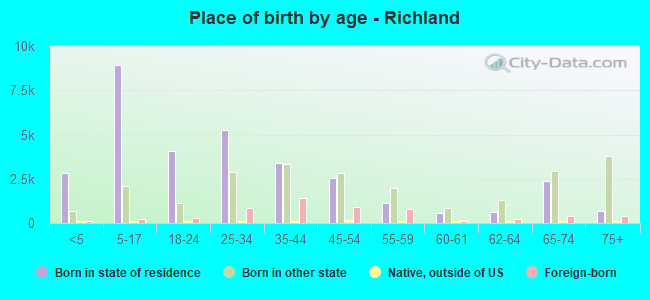
Children Nativity (place of birth) in Richland
Children under 6 years - Living with two parents Both parents native 2,132 100.0% NativeBoth parents foreign-born 461 91.3% Native44 8.7% Foreign-bornOne native, one foreign-born parent 194 100.0% NativeChildren under 6 years - Living with one parent Native parent 1,305 100.0% NativeForeign-born parent 90 100.0% NativeChildren 6 to 17 years - Living with two parents Both parents native 5,664 100.0% NativeBoth parents foreign-born 833 88.6% Native107 11.4% Foreign-bornOne native, one foreign-born parent 358 100.0% NativeChildren 6 to 17 years - Living with one parent Native parent 2,579 100.0% NativeForeign-born parent 467 56.2% Native363 43.8% Foreign-born
Grandparents responsible for own grandchildren in Richland
Grandparents (30 to 59 years) White / Caucasian 34 16.9% Responsible for grandchildren166 83.1% Not responsible for grandchildrenWhite alone, not Hispanic / Latino 52 23.8% Responsible for grandchildren167 76.2% Not responsible for grandchildrenHispanic or Latino 14 100.0% Not responsible for grandchildrenGrandparents (60 years and over) White / Caucasian 48 11.4% Responsible for grandchildren377 88.6% Not responsible for grandchildrenWhite alone, not Hispanic / Latino 49 11.0% Responsible for grandchildren399 89.0% Not responsible for grandchildrenHispanic or Latino 5 21.7% Responsible for grandchildren20 78.3% Not responsible for grandchildren