Races in Richmond, Indiana (IN) Detailed Stats
Data:
Races - White alone (%)
Races - White alone (% change since 2000)
Races - Black alone (%)
Races - Black alone (% change since 2000)
Races - American Indian alone (%)
Races - American Indian alone (% change since 2000)
Races - Asian alone (%)
Races - Asian alone (% change since 2000)
Races - Hispanic (%)
Races - Hispanic (% change since 2000)
Races - Native Hawaiian and Other Pacific Islander alone (%)
Races - Native Hawaiian and Other Pacific Islander alone (% change since 2000)
Races - Two or more races(%)
Races - Two or more races(% change since 2000)
Races - Other race alone (%)
Races - Other race alone (% change since 2000)
Racial diversity
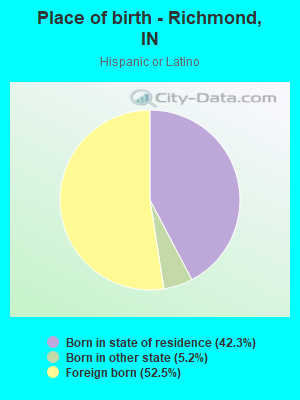
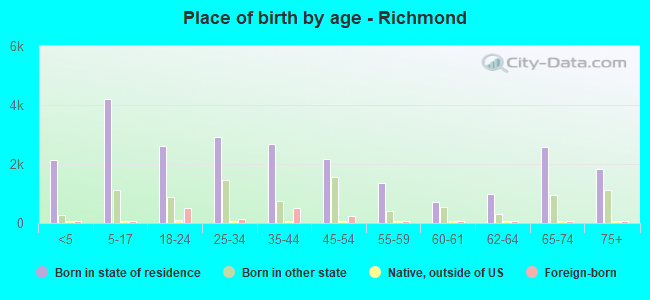
Place of birth - Born in state of residence (%)
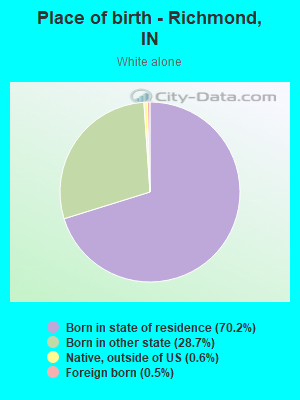
Place of birth - Born in state of residence (%) - White
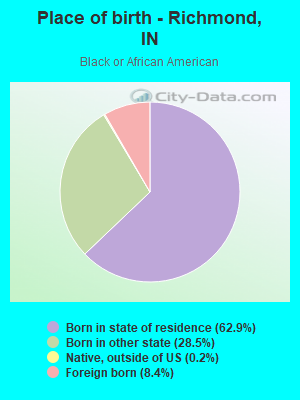
Place of birth - Born in state of residence (%) - Black or African American
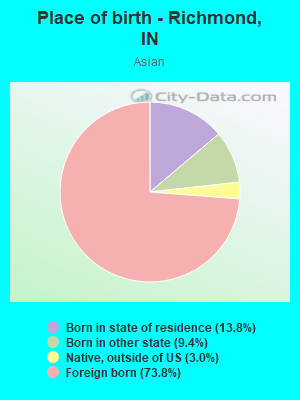
Place of birth - Born in state of residence (%) - Asian
Place of birth - Born in state of residence (%) - Hispanic or Latino
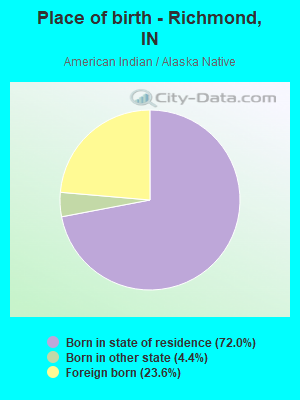
Place of birth - Born in state of residence (%) - American Indian and Alaska Native
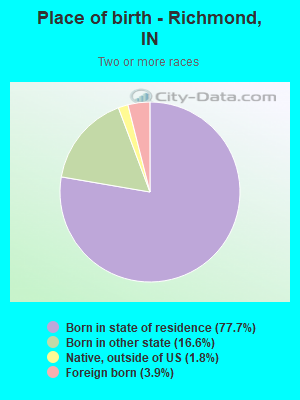
Place of birth - Born in state of residence (%) - Multirace
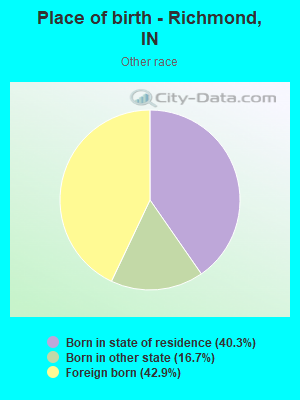
Place of birth - Born in state of residence (%) - Other Race
Place of birth - Born in other state (%)
Place of birth - Born in other state (%) - White
Place of birth - Born in other state (%) - Black or African American
Place of birth - Born in other state (%) - Asian
Place of birth - Born in other state (%) - Hispanic or Latino
Place of birth - Born in other state (%) - American Indian and Alaska Native
Place of birth - Born in other state (%) - Multirace
Place of birth - Born in other state (%) - Other Race
Place of birth - Native, outside of US (%)
Place of birth - Native, outside of US (%) - White
Place of birth - Native, outside of US (%) - Black or African American
Place of birth - Native, outside of US (%) - Asian
Place of birth - Native, outside of US (%) - Hispanic or Latino
Place of birth - Native, outside of US (%) - American Indian and Alaska Native
Place of birth - Native, outside of US (%) - Multirace
Place of birth - Native, outside of US (%) - Other Race
Place of birth - Foreign born (%)
Place of birth - Foreign born (%) - White
Place of birth - Foreign born (%) - Black or African American
Place of birth - Foreign born (%) - Asian
Place of birth - Foreign born (%) - Hispanic or Latino
Place of birth - Foreign born (%) - American Indian and Alaska Native
Place of birth - Foreign born (%) - Multirace
Place of birth - Foreign born (%) - Other Race
Residents speaking English at home (%)
Residents speaking English at home - Born in the United States (%)
Residents speaking English at home - Native, born elsewhere (%)
Residents speaking English at home - Foreign born (%)
Residents speaking Spanish at home (%)
Residents speaking Spanish at home - Born in the United States (%)
Residents speaking Spanish at home - Native, born elsewhere (%)
Residents speaking Spanish at home - Foreign born (%)
Residents speaking other language at home (%)
Residents speaking other language at home - Born in the United States (%)
Residents speaking other language at home - Native, born elsewhere (%)
Residents speaking other language at home - Foreign born (%)
Marital status - Never married (%)
Marital status - Now married (%)
Marital status - Separated (%)
Marital status - Widowed (%)
Marital status - Divorced (%)
Ancestries Reported - Arab (%)
Ancestries Reported - Czech (%)
Ancestries Reported - Danish (%)
Ancestries Reported - Dutch (%)
Ancestries Reported - English (%)
Ancestries Reported - French (%)
Ancestries Reported - French Canadian (%)
Ancestries Reported - German (%)
Ancestries Reported - Greek (%)
Ancestries Reported - Hungarian (%)
Ancestries Reported - Irish (%)
Ancestries Reported - Italian (%)
Ancestries Reported - Lithuanian (%)
Ancestries Reported - Norwegian (%)
Ancestries Reported - Polish (%)
Ancestries Reported - Portuguese (%)
Ancestries Reported - Russian (%)
Ancestries Reported - Scotch-Irish (%)
Ancestries Reported - Scottish (%)
Ancestries Reported - Slovak (%)
Ancestries Reported - Subsaharan African (%)
Ancestries Reported - Swedish (%)
Ancestries Reported - Swiss (%)
Ancestries Reported - Ukrainian (%)
Ancestries Reported - United States (%)
Ancestries Reported - Welsh (%)
Ancestries Reported - West Indian (%)
Ancestries Reported - Other (%)
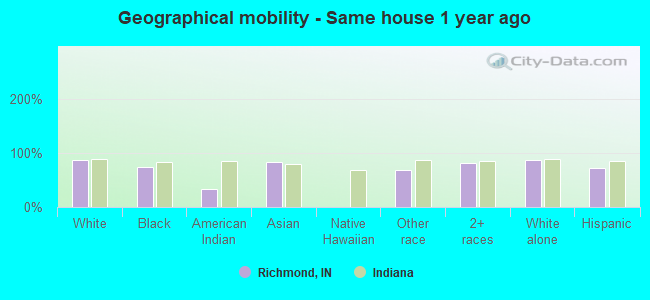
Geographical mobility - Same house 1 year ago (%)
Geographical mobility - Same house 1 year ago (%) - White
Geographical mobility - Same house 1 year ago (%) - Black or African American
Geographical mobility - Same house 1 year ago (%) - Asian
Geographical mobility - Same house 1 year ago (%) - Hispanic or Latino
Geographical mobility - Same house 1 year ago (%) - American Indian and Alaska Native
Geographical mobility - Same house 1 year ago (%) - Multirace
Geographical mobility - Same house 1 year ago (%) - Other Race
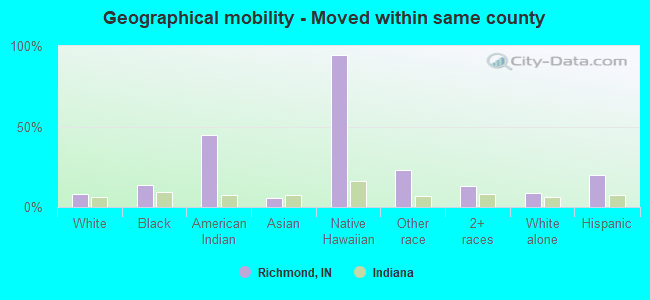
Geographical mobility - Moved within same county (%)
Geographical mobility - Moved within same county (%) - White
Geographical mobility - Moved within same county (%) - Black or African American
Geographical mobility - Moved within same county (%) - Asian
Geographical mobility - Moved within same county (%) - Hispanic or Latino
Geographical mobility - Moved within same county (%) - American Indian and Alaska Native
Geographical mobility - Moved within same county (%) - Multirace
Geographical mobility - Moved within same county (%) - Other Race
Geographical mobility - Moved from different county within same state (%)
Geographical mobility - Moved from different county within same state (%) - White
Geographical mobility - Moved from different county within same state (%) - Black or African American
Geographical mobility - Moved from different county within same state (%) - Asian
Geographical mobility - Moved from different county within same state (%) - Hispanic or Latino
Geographical mobility - Moved from different county within same state (%) - American Indian and Alaska Native
Geographical mobility - Moved from different county within same state (%) - Multirace
Geographical mobility - Moved from different county within same state (%) - Other Race
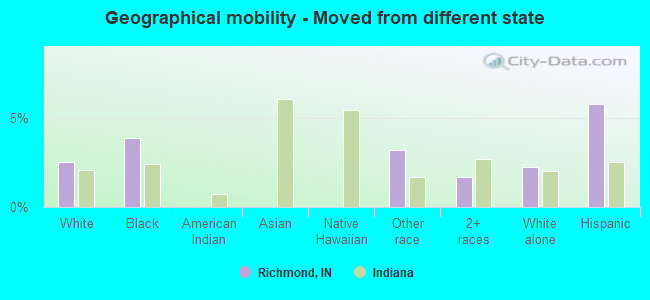
Geographical mobility - Moved from different state (%)
Geographical mobility - Moved from different state (%) - White
Geographical mobility - Moved from different state (%) - Black or African American
Geographical mobility - Moved from different state (%) - Asian
Geographical mobility - Moved from different state (%) - Hispanic or Latino
Geographical mobility - Moved from different state (%) - American Indian and Alaska Native
Geographical mobility - Moved from different state (%) - Multirace
Geographical mobility - Moved from different state (%) - Other Race
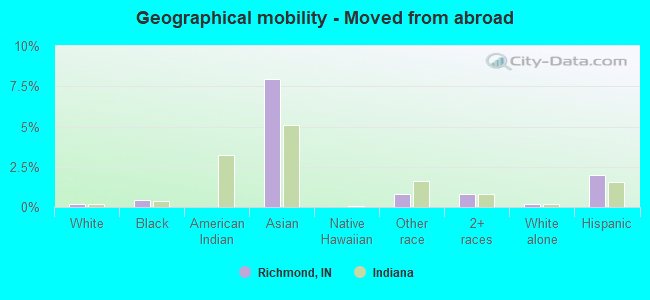
Geographical mobility - Moved from abroad (%)
Geographical mobility - Moved from abroad (%) - White
Geographical mobility - Moved from abroad (%) - Black or African American
Geographical mobility - Moved from abroad (%) - Asian
Geographical mobility - Moved from abroad (%) - Hispanic or Latino
Geographical mobility - Moved from abroad (%) - American Indian and Alaska Native
Geographical mobility - Moved from abroad (%) - Multirace
Geographical mobility - Moved from abroad (%) - Other Race
Place of birth for the foreign-born population - Ireland (%)
Place of birth for the foreign-born population - Denmark (%)
Place of birth for the foreign-born population - Norway (%)
Place of birth for the foreign-born population - Sweden (%)
Place of birth for the foreign-born population - United Kingdom (%)
Place of birth for the foreign-born population - England (%)
Place of birth for the foreign-born population - Scotland (%)
Place of birth for the foreign-born population - Other Northern Europe (%)
Place of birth for the foreign-born population - Austria (%)
Place of birth for the foreign-born population - Belgium (%)
Place of birth for the foreign-born population - France (%)
Place of birth for the foreign-born population - Germany (%)
Place of birth for the foreign-born population - Netherlands (%)
Place of birth for the foreign-born population - Switzerland (%)
Place of birth for the foreign-born population - Other Western Europe (%)
Place of birth for the foreign-born population - Greece (%)
Place of birth for the foreign-born population - Italy (%)
Place of birth for the foreign-born population - Portugal (%)
Place of birth for the foreign-born population - Spain (%)
Place of birth for the foreign-born population - Other Southern Europe (%)
Place of birth for the foreign-born population - Albania (%)
Place of birth for the foreign-born population - Belarus (%)
Place of birth for the foreign-born population - Bosnia and Herzegovina (%)
Place of birth for the foreign-born population - Bulgaria (%)
Place of birth for the foreign-born population - Croatia (%)
Place of birth for the foreign-born population - Czechoslovakia (%)
Place of birth for the foreign-born population - Hungary (%)
Place of birth for the foreign-born population - Latvia (%)
Place of birth for the foreign-born population - Lithuania (%)
Place of birth for the foreign-born population - North Macedonia (Macedonia) (%)
Place of birth for the foreign-born population - Moldova (%)
Place of birth for the foreign-born population - Poland (%)
Place of birth for the foreign-born population - Romania (%)
Place of birth for the foreign-born population - Russia (%)
Place of birth for the foreign-born population - Serbia (%)
Place of birth for the foreign-born population - Ukraine (%)
Place of birth for the foreign-born population - Other Eastern Europe (%)
Place of birth for the foreign-born population - China (%)
Place of birth for the foreign-born population - Hong Kong (%)
Place of birth for the foreign-born population - Taiwan (%)
Place of birth for the foreign-born population - Japan (%)
Place of birth for the foreign-born population - Korea (%)
Place of birth for the foreign-born population - Other Eastern Asia (%)
Place of birth for the foreign-born population - Afghanistan (%)
Place of birth for the foreign-born population - Bangladesh (%)
Place of birth for the foreign-born population - India (%)
Place of birth for the foreign-born population - Iran (%)
Place of birth for the foreign-born population - Kazakhstan (%)
Place of birth for the foreign-born population - Nepal (%)
Place of birth for the foreign-born population - Pakistan (%)
Place of birth for the foreign-born population - Sri Lanka (%)
Place of birth for the foreign-born population - Uzbekistan (%)
Place of birth for the foreign-born population - Other South Central Asia (%)
Place of birth for the foreign-born population - Burma (%)
Place of birth for the foreign-born population - Cambodia (%)
Place of birth for the foreign-born population - Indonesia (%)
Place of birth for the foreign-born population - Laos (%)
Place of birth for the foreign-born population - Malaysia (%)
Place of birth for the foreign-born population - Philippines (%)
Place of birth for the foreign-born population - Singapore (%)
Place of birth for the foreign-born population - Thailand (%)
Place of birth for the foreign-born population - Vietnam (%)
Place of birth for the foreign-born population - Other South Eastern Asia (%)
Place of birth for the foreign-born population - Armenia (%)
Place of birth for the foreign-born population - Iraq (%)
Place of birth for the foreign-born population - Israel (%)
Place of birth for the foreign-born population - Jordan (%)
Place of birth for the foreign-born population - Kuwait (%)
Place of birth for the foreign-born population - Lebanon (%)
Place of birth for the foreign-born population - Saudi Arabia (%)
Place of birth for the foreign-born population - Syria (%)
Place of birth for the foreign-born population - Turkey (%)
Place of birth for the foreign-born population - Yemen (%)
Place of birth for the foreign-born population - Other Western Asia (%)
Place of birth for the foreign-born population - Eritrea (%)
Place of birth for the foreign-born population - Ethiopia (%)
Place of birth for the foreign-born population - Kenya (%)
Place of birth for the foreign-born population - Somalia (%)
Place of birth for the foreign-born population - Uganda (%)
Place of birth for the foreign-born population - Zimbabwe (%)
Place of birth for the foreign-born population - Other Eastern Africa (%)
Place of birth for the foreign-born population - Cameroon (%)
Place of birth for the foreign-born population - Congo (%)
Place of birth for the foreign-born population - Democratic Republic of Congo (Zaire) (%)
Place of birth for the foreign-born population - Other Middle Africa (%)
Place of birth for the foreign-born population - Egypt (%)
Place of birth for the foreign-born population - Morocco (%)
Place of birth for the foreign-born population - Sudan (%)
Place of birth for the foreign-born population - Other Northern Africa (%)
Place of birth for the foreign-born population - South Africa (%)
Place of birth for the foreign-born population - Other Southern Africa (%)
Place of birth for the foreign-born population - Cabo Verde (%)
Place of birth for the foreign-born population - Ghana (%)
Place of birth for the foreign-born population - Liberia (%)
Place of birth for the foreign-born population - Nigeria (%)
Place of birth for the foreign-born population - Senegal (%)
Place of birth for the foreign-born population - Sierra Leone (%)
Place of birth for the foreign-born population - Other Western Africa (%)
Place of birth for the foreign-born population - Australia (%)
Place of birth for the foreign-born population - New Zealand (%)
Place of birth for the foreign-born population - Fiji (%)
Place of birth for the foreign-born population - Micronesia (%)
Place of birth for the foreign-born population - Bahamas (%)
Place of birth for the foreign-born population - Barbados (%)
Place of birth for the foreign-born population - Cuba (%)
Place of birth for the foreign-born population - Dominica (%)
Place of birth for the foreign-born population - Dominican Republic (%)
Place of birth for the foreign-born population - Grenada (%)
Place of birth for the foreign-born population - Haiti (%)
Place of birth for the foreign-born population - Jamaica (%)
Place of birth for the foreign-born population - St. Vincent and the Grenadines (%)
Place of birth for the foreign-born population - Trinidad and Tobago (%)
Place of birth for the foreign-born population - West Indies (%)
Place of birth for the foreign-born population - Other Caribbean (%)
Place of birth for the foreign-born population - Belize (%)
Place of birth for the foreign-born population - Costa Rica (%)
Place of birth for the foreign-born population - El Salvador (%)
Place of birth for the foreign-born population - Guatemala (%)
Place of birth for the foreign-born population - Honduras (%)
Place of birth for the foreign-born population - Mexico (%)
Place of birth for the foreign-born population - Nicaragua (%)
Place of birth for the foreign-born population - Panama (%)
Place of birth for the foreign-born population - Other Central America (%)
Place of birth for the foreign-born population - Argentina (%)
Place of birth for the foreign-born population - Bolivia (%)
Place of birth for the foreign-born population - Brazil (%)
Place of birth for the foreign-born population - Chile (%)
Place of birth for the foreign-born population - Colombia (%)
Place of birth for the foreign-born population - Ecuador (%)
Place of birth for the foreign-born population - Guyana (%)
Place of birth for the foreign-born population - Peru (%)
Place of birth for the foreign-born population - Uruguay (%)
Place of birth for the foreign-born population - Venezuela (%)
Place of birth for the foreign-born population - Other South America (%)
Place of birth for the foreign-born population - Canada (%)
Place of birth for the foreign-born population - Other Northern America (%)
Place of birth for the foreign-born population - Other (%)
Latest news about races in Richmond, IN collected exclusively by city-data.com from local newspapers, TV, and radio stations
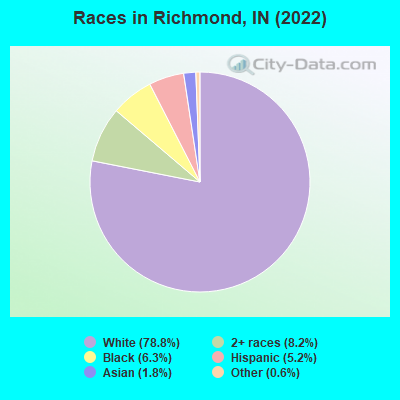
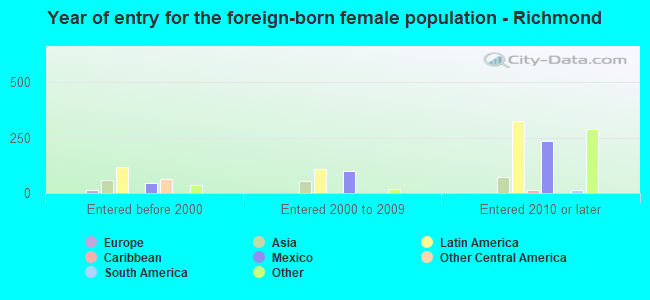
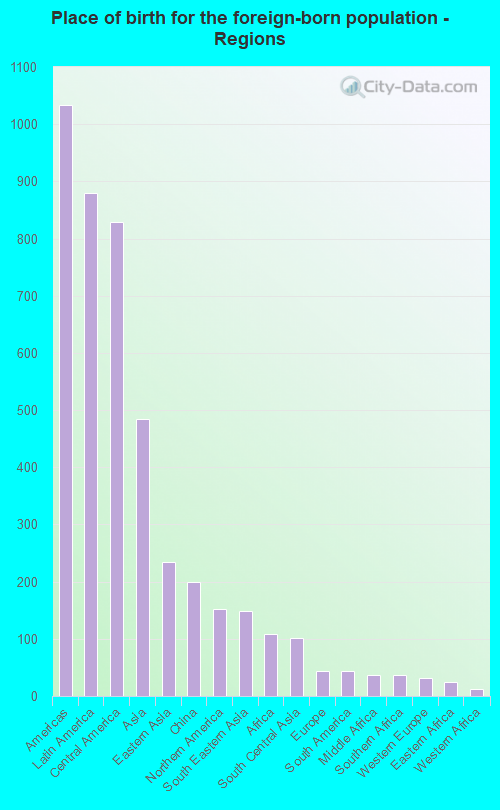
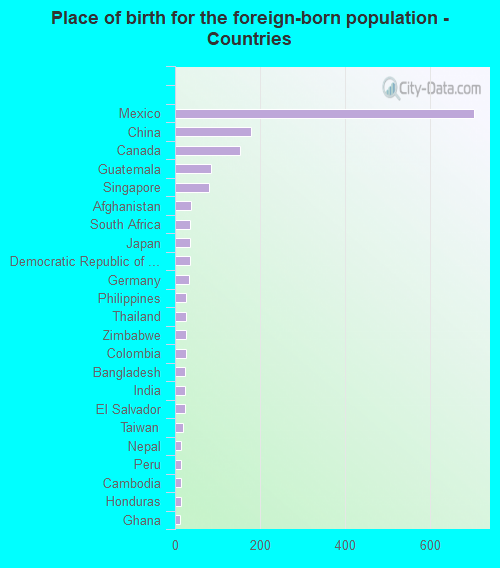
According to 2022 data, the most numerous races in Richmond, IN are White alone (28,277 residents), Black alone (2,255 residents), and Hispanic (1,858 residents). 93.3% of Richmond residents speak English at home. 4.7% of Richmond, IN residents are foreign-born (2.2% born in Latin America, 1.2% born in Asia), which is 27.4% less than the foreign-born rate of 6.0% across the entire state of Indiana.
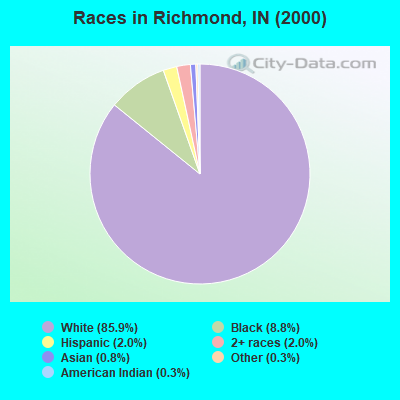
Race distribution in Richmond
2000 2022
5,219,373 85.8% White alone 505,462 8.3% Black alone 214,536 3.5% Hispanic 61,115 1.0% Two or more races 58,424 1.0% Asian alone 13,654 0.2% American Indian alone 6,348 0.1% Other race alone 1,573 0.03% Native Hawaiian and Other
5,192,455 76.0% White alone 628,054 9.2% Black alone 534,528 7.8% Hispanic 263,242 3.9% Two or more races 172,880 2.5% Asian alone 33,467 0.5% Other race alone 5,866 0.09% American Indian alone 2,545 0.04% Native Hawaiian and Other
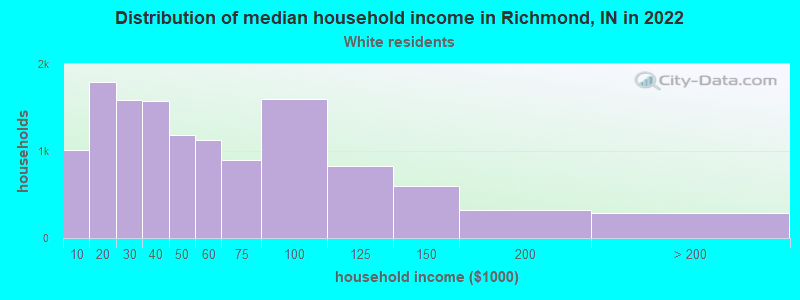
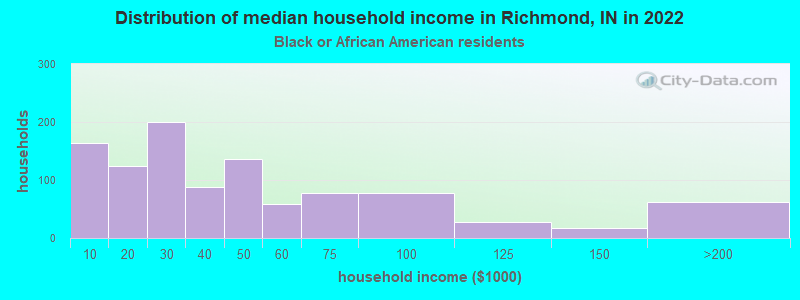
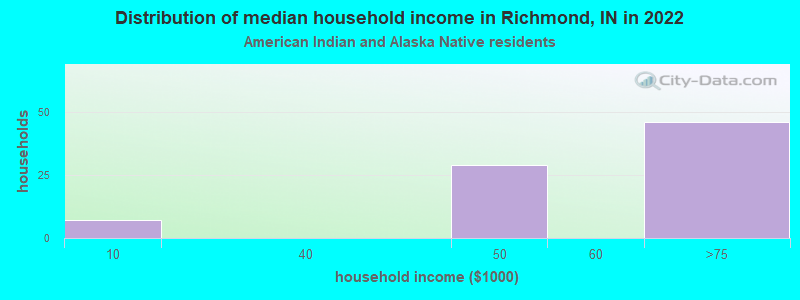
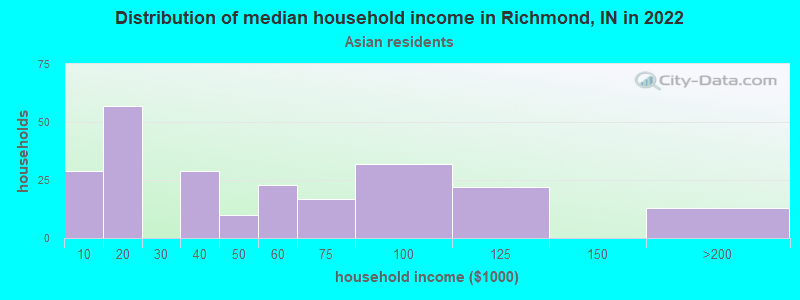
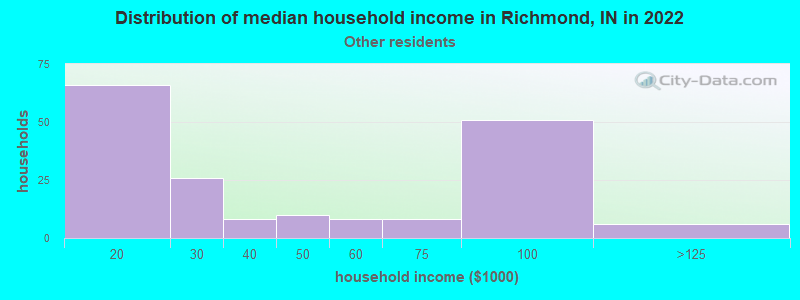
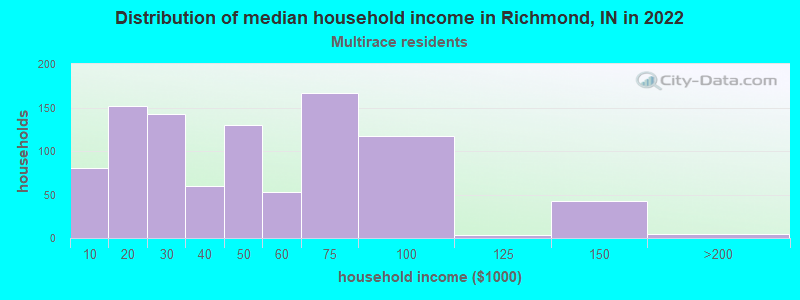
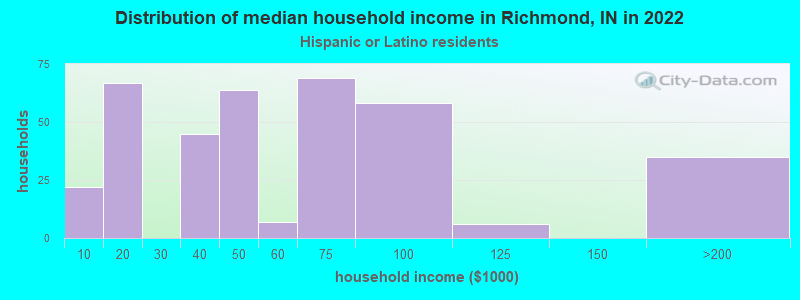
Income and house value in Richmond Median household income in 2022 $44,147 White non-Hispanic householders$32,350 Black householders$58,368 American Indian and Alaska Native householders$52,218 Asian householders$40,715 Two or more races householders$67,985 Hispanic or Latino race householdersMedian 2022 house value $112,603 White Non-Hispanic householders$101,312 Black or African American householders$56,454 American Indian or Alaska Native householders $114,434 Asian householders$82,240 Two or more races householders$84,986 Hispanic or Latino householders
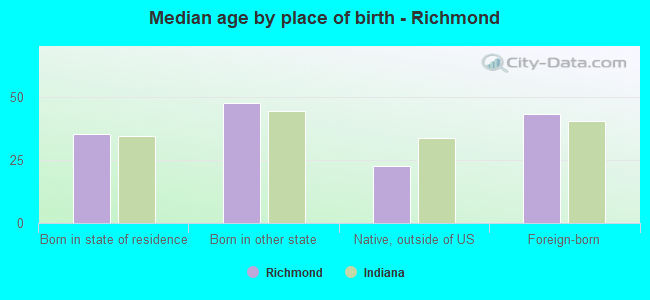
Median age by race in Richmond
40.9 Median age for White residents38.4 43.5 56.7 Median age for Black or African American residents45.2 74.4 8.2 Median age for American Indian / Alaska Native residents47.2 4.7 24.2 Median age for Asian residents59.5 22.9 -666,666,666.0 Median age for Native Hawaiian / Pacific Islander residents-666,666,666.0 -666,666,666.0 36.8 Median age for Other race residents27.9 40.0 20.2 Median age for Two or more races residents23.3 15.7 41.2 Median age for White alone residents38.6 44.0 23.5 Median age for Hispanic or Latino residents22.0 29.7
Owner/renter occupied households by race in Richmond
House owners and renters - White residents 7,646 60.3% Owner occupied5,035 39.7% Renter occupiedHouse owners and renters - Black or African American residents 335 52.2% Owner occupied306 47.8% Renter occupiedHouse owners and renters - American Indian / Alaska Native residents 44 42.0% Owner occupied61 58.0% Renter occupiedHouse owners and renters - Asian residents 141 61.7% Owner occupied87 38.3% Renter occupiedHouse owners and renters - Native Hawaiian / Pacific Islander residents 3 100.0% Renter occupiedHouse owners and renters - Other race residents 157 82.1% Owner occupied34 17.9% Renter occupiedHouse owners and renters - Two or more races residents 337 29.6% Owner occupied799 70.4% Renter occupiedHouse owners and renters - White alone residents 7,608 60.2% Owner occupied5,033 39.8% Renter occupiedHouse owners and renters - Hispanic or Latino residents 284 82.4% Owner occupied61 17.6% Renter occupied
Language usage in Richmond
English speakers - Total 93.3% of residents of Richmond speak English at home.
4.2% of residents speak Spanish at home 510 36.2% Speak English very well900 63.8% Speak English less than very well2.2% of residents speak other language at home 521 68.9% Speak English very well235 31.1% Speak English less than very well
English speakers - Born in the United States 98.0% of residents of Richmond speak English at home.
1.1% of residents speak Spanish at home 65 58.6% Speak English very well46 41.4% Speak English less than very well0.4% of residents speak other language at home 40 100.0% Speak English very well
English speakers - Native, born elsewhere 93.9% of residents of Richmond speak English at home.
7.2% of residents speak other language at home 20 100.0% Speak English very well
English speakers - Foreign-born 13.7% of residents of Richmond speak English at home.
50.7% of residents speak Spanish at home 94 11.0% Speak English very well757 89.0% Speak English less than very well37.3% of residents speak other language at home 420 67.2% Speak English very well205 32.8% Speak English less than very well
White (Caucasian) - Speak only English Native:
99.2% (26,285)Foreign-born:
49.7% (155)
White (Caucasian) - Speak another language Native:
1.0% (265)Foreign-born:
53.3% (167)
Black or African American - Speak another language Native:
0.8% (18)Foreign-born:
100.0% (210)
American Indian / Alaska Native - Speak only English Native:
9.6% (20)Foreign-born:
3.7% (4)
American Indian / Alaska Native - Speak another language Native:
100.0% (206)Foreign-born:
97.6% (101)
Asian - Speak only English Native:
94.8% (60)Foreign-born:
8.0% (37)
Other race - Speak another language Native:
36.0% (174)Foreign-born:
97.7% (377)
Two or more races - Speak another language Native:
4.5% (127)Foreign-born:
99.0% (172)
White alone - Speak only English Native:
99.1% (26,304)Foreign-born:
70.0% (163)
White alone - Speak another language Native:
0.8% (208)Foreign-born:
26.2% (61)
Hispanic or Latino - Speak only English Native:
47.0% (393)Foreign-born:
1.5% (13)
Hispanic or Latino - Speak another language Native:
53.4% (447)Foreign-born:
98.1% (820)
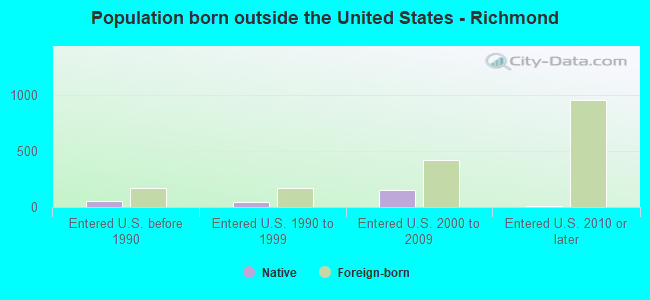
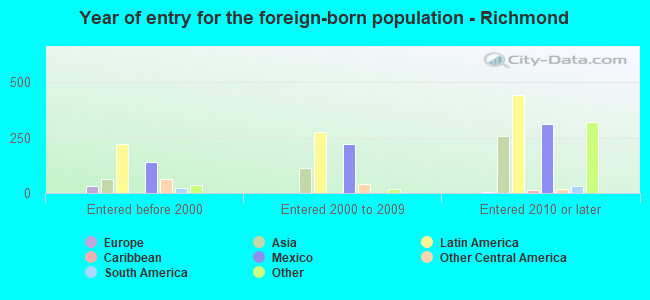
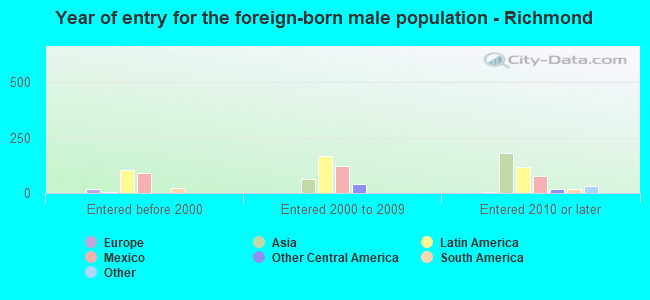
Foreign-born residents in Richmond 1,672 residents are foreign born (2.2% Latin America , 1.2% Asia ).
This city:
4.7%Indiana:
5.6%
Marital status for residents in Richmond Marital status - White (Caucasian) population 15 years and over
Males 33.9% Never married44.9% Now married1.4% Separated3.2% Widowed16.6% DivorcedFemales 30.2% Never married37.3% Now married2.1% Separated12.5% Widowed17.9% DivorcedWomen who gave birth in the past 12 months Now married:
40.2% (237)Unmarried:
59.8% (353)
Women who did not give birth in the past 12 months Now married:
31.1% (1,788)Unmarried:
68.9% (3,959)
Marital status - Black or African American population 15 years and over
Males 58.0% Never married20.8% Now married8.2% Separated0.4% Widowed12.7% DivorcedFemales 47.9% Never married11.8% Now married0.0% Separated19.0% Widowed21.4% DivorcedWomen who gave birth in the past 12 months Now married:
0.0% (0)Unmarried:
100.0% (38)
Women who did not give birth in the past 12 months Now married:
5.9% (26)Unmarried:
94.1% (413)
Marital status - American Indian / Alaska Native population 15 years and over
Males 0.0% Never married52.1% Now married0.0% Separated0.0% Widowed47.9% DivorcedFemales 10.8% Never married75.7% Now married0.0% Separated0.0% Widowed13.5% DivorcedWomen who did not give birth in the past 12 months Now married:
75.7% (66)Unmarried:
24.3% (21)
Marital status - Asian population 15 years and over
Males 51.5% Never married48.5% Now married0.0% Separated0.0% Widowed0.0% DivorcedFemales 54.9% Never married20.5% Now married0.0% Separated24.6% Widowed0.0% DivorcedWomen who did not give birth in the past 12 months Now married:
21.7% (35)Unmarried:
78.3% (128)
Marital status - Other race population 15 years and over
Males 42.6% Never married54.7% Now married0.0% Separated0.0% Widowed2.7% DivorcedFemales 53.4% Never married46.6% Now married0.0% Separated0.0% Widowed0.0% DivorcedWomen who gave birth in the past 12 months Now married:
0.0% (0)Unmarried:
100.0% (6)
Women who did not give birth in the past 12 months Now married:
42.0% (149)Unmarried:
58.0% (206)
Marital status - Two or more races population 15 years and over
Males 65.1% Never married28.5% Now married0.0% Separated0.0% Widowed6.4% DivorcedFemales 51.8% Never married25.3% Now married4.6% Separated7.2% Widowed11.1% DivorcedWomen who did not give birth in the past 12 months Now married:
29.5% (226)Unmarried:
70.5% (540)
Marital status - White alone, not Hispanic / Latino population 15 years and over
Males 33.4% Never married45.4% Now married1.1% Separated3.2% Widowed16.8% DivorcedFemales 29.9% Never married37.7% Now married2.1% Separated12.6% Widowed17.6% DivorcedWomen who gave birth in the past 12 months Now married:
40.2% (241)Unmarried:
59.8% (358)
Women who did not give birth in the past 12 months Now married:
31.8% (1,806)Unmarried:
68.2% (3,870)
Marital status - Hispanic or Latino population 15 years and over
Males 61.4% Never married26.9% Now married5.6% Separated0.0% Widowed6.1% DivorcedFemales 57.1% Never married31.4% Now married0.0% Separated0.0% Widowed11.5% DivorcedWomen who gave birth in the past 12 months Now married:
0.0% (0)Unmarried:
100.0% (5)
Women who did not give birth in the past 12 months Now married:
28.9% (167)Unmarried:
71.1% (412)
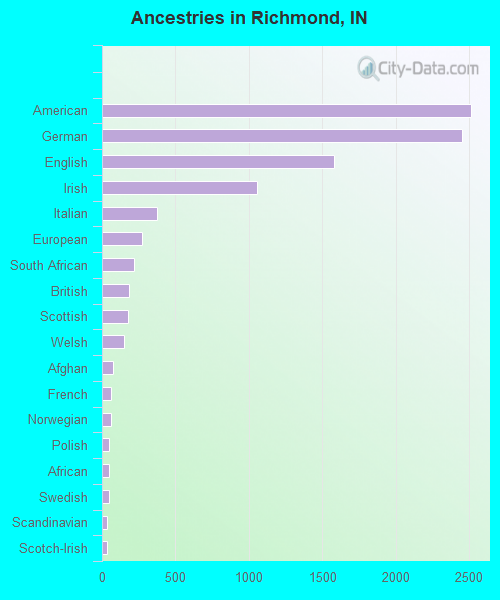
Ancestries in Richmond
2,511 17.2% American2,451 16.7% German1,580 10.8% English1,054 7.2% Irish376 2.6% Italian271 1.9% European217 1.5% South African186 1.3% British176 1.2% Scottish153 1.0% Welsh75 0.5% Afghan63 0.4% French59 0.4% Norwegian49 0.3% Polish46 0.3% African45 0.3% Swedish34 0.2% Scandinavian32 0.2% Scotch-Irish15 0.1% Russian14 0.10% French Canadian13 0.09% Pennsylvania German12 0.08% Zimbabwean12 0.08% Greek12 0.08% Jamaican12 0.08% Eastern European11 0.08% Canadian11 0.08% Dutch10 0.07% Belgian9 0.06% Northern European8 0.05% Croatian5 0.03% Czechoslovakian5 0.03% Hungarian4 0.03% Czech
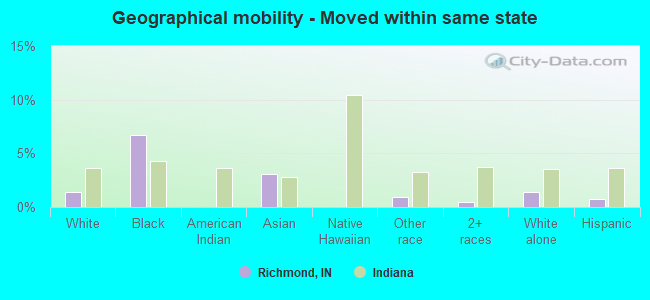
Geographical mobility in Richmond Same house 1 year ago 24,053 85.9% White (Caucasian)1,865 74.4% Black or African American164 32.4% American Indian / Alaska Native528 83.0% Asian603 68.5% Other race3,491 80.7% Two or more races23,885 85.9% White alone, not Hispanic / Latino1,304 71.3% Hispanic or LatinoMoved within same county 2,316 8.3% White / Caucasian347 13.8% Black or African American228 44.9% American Indian / Alaska Native35 5.5% Asian3 94.6% Native Hawaiian / Pacific Islander205 23.3% Other race569 13.1% Two or more races2,332 8.4% White alone, not Hispanic / Latino364 19.9% Hispanic or LatinoMoved within same state 396 1.4% White / Caucasian168 6.7% Black or African American20 3.1% Asian8 0.9% Other race21 0.5% Two or more races399 1.4% White alone, not Hispanic / Latino13 0.7% Hispanic or LatinoMoved from different state 700 2.5% White / Caucasian97 3.9% Black or African American28 3.2% Other race72 1.7% Two or more races627 2.3% White alone, not Hispanic / Latino105 5.8% Hispanic or LatinoMoved from abroad 54 0.2% White11 0.4% Black or African American50 7.9% Asian7 0.8% Other race36 0.8% Two or more races53 0.2% White alone, not Hispanic / Latino37 2.0% Hispanic or Latino
Children Nativity (place of birth) in Richmond
Children under 6 years - Living with two parents Both parents native 975 100.0% NativeBoth parents foreign-born 216 100.0% NativeOne native, one foreign-born parent 6 100.0% NativeChildren under 6 years - Living with one parent Native parent 1,232 100.0% NativeForeign-born parent 58 100.0% NativeChildren 6 to 17 years - Living with two parents Both parents native 2,234 100.0% NativeBoth parents foreign-born 260 100.0% NativeOne native, one foreign-born parent 7 100.0% NativeChildren 6 to 17 years - Living with one parent Native parent 1,974 100.0% NativeForeign-born parent 161 53.5% Native140 46.5% Foreign-born
Grandparents responsible for own grandchildren in Richmond
Grandparents (30 to 59 years) White / Caucasian 109 71.3% Responsible for grandchildren44 28.7% Not responsible for grandchildrenOther race 6 13.8% Responsible for grandchildren37 86.2% Not responsible for grandchildrenTwo or more races 21 100.0% Responsible for grandchildrenWhite alone, not Hispanic / Latino 109 71.3% Responsible for grandchildren44 28.7% Not responsible for grandchildrenHispanic or Latino 5 18.6% Responsible for grandchildren24 81.4% Not responsible for grandchildrenGrandparents (60 years and over) White / Caucasian 672 81.3% Responsible for grandchildren155 18.7% Not responsible for grandchildrenWhite alone, not Hispanic / Latino 672 81.0% Responsible for grandchildren157 19.0% Not responsible for grandchildren