Races in Richmond West, Florida (FL) Detailed Stats
Data:
Races - White alone (%)
Races - White alone (% change since 2000)
Races - Black alone (%)
Races - Black alone (% change since 2000)
Races - American Indian alone (%)
Races - American Indian alone (% change since 2000)
Races - Asian alone (%)
Races - Asian alone (% change since 2000)
Races - Hispanic (%)
Races - Hispanic (% change since 2000)
Races - Native Hawaiian and Other Pacific Islander alone (%)
Races - Native Hawaiian and Other Pacific Islander alone (% change since 2000)
Races - Two or more races(%)
Races - Two or more races(% change since 2000)
Races - Other race alone (%)
Races - Other race alone (% change since 2000)
Racial diversity
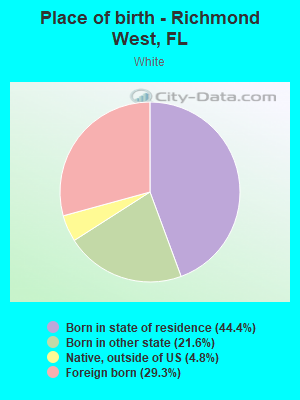
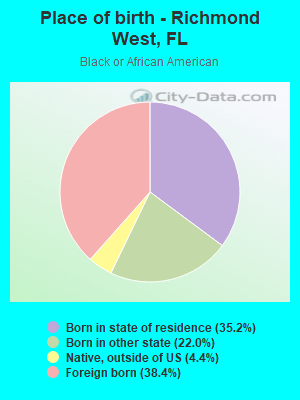
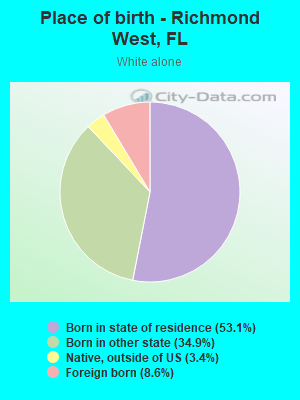
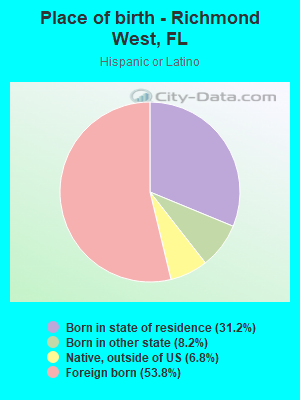
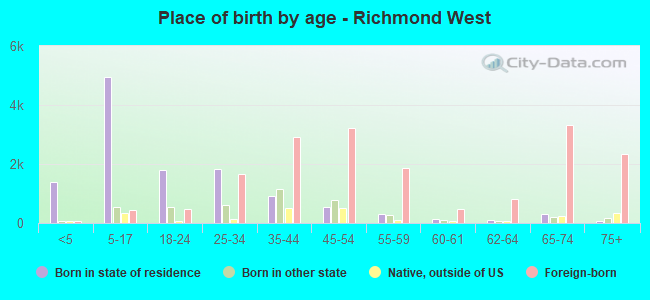
Place of birth - Born in state of residence (%)
Place of birth - Born in state of residence (%) - White
Place of birth - Born in state of residence (%) - Black or African American
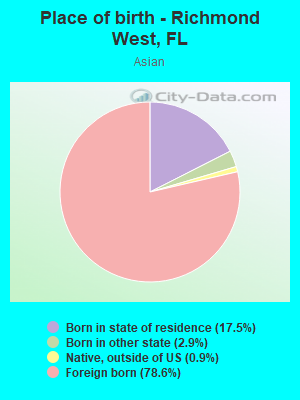
Place of birth - Born in state of residence (%) - Asian
Place of birth - Born in state of residence (%) - Hispanic or Latino
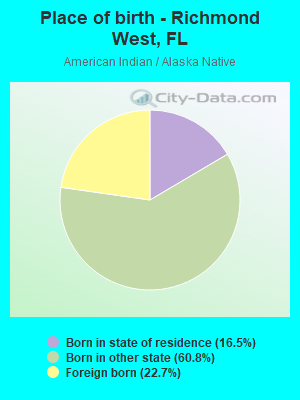
Place of birth - Born in state of residence (%) - American Indian and Alaska Native
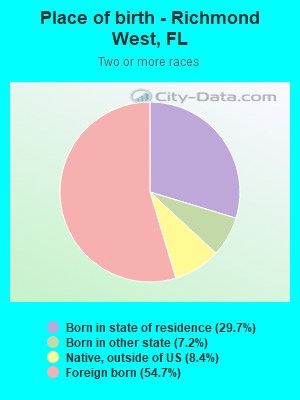
Place of birth - Born in state of residence (%) - Multirace
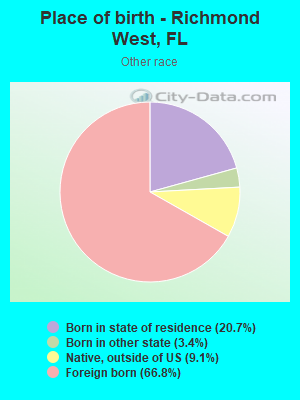
Place of birth - Born in state of residence (%) - Other Race
Place of birth - Born in other state (%)
Place of birth - Born in other state (%) - White
Place of birth - Born in other state (%) - Black or African American
Place of birth - Born in other state (%) - Asian
Place of birth - Born in other state (%) - Hispanic or Latino
Place of birth - Born in other state (%) - American Indian and Alaska Native
Place of birth - Born in other state (%) - Multirace
Place of birth - Born in other state (%) - Other Race
Place of birth - Native, outside of US (%)
Place of birth - Native, outside of US (%) - White
Place of birth - Native, outside of US (%) - Black or African American
Place of birth - Native, outside of US (%) - Asian
Place of birth - Native, outside of US (%) - Hispanic or Latino
Place of birth - Native, outside of US (%) - American Indian and Alaska Native
Place of birth - Native, outside of US (%) - Multirace
Place of birth - Native, outside of US (%) - Other Race
Place of birth - Foreign born (%)
Place of birth - Foreign born (%) - White
Place of birth - Foreign born (%) - Black or African American
Place of birth - Foreign born (%) - Asian
Place of birth - Foreign born (%) - Hispanic or Latino
Place of birth - Foreign born (%) - American Indian and Alaska Native
Place of birth - Foreign born (%) - Multirace
Place of birth - Foreign born (%) - Other Race
Residents speaking English at home (%)
Residents speaking English at home - Born in the United States (%)
Residents speaking English at home - Native, born elsewhere (%)
Residents speaking English at home - Foreign born (%)
Residents speaking Spanish at home (%)
Residents speaking Spanish at home - Born in the United States (%)
Residents speaking Spanish at home - Native, born elsewhere (%)
Residents speaking Spanish at home - Foreign born (%)
Residents speaking other language at home (%)
Residents speaking other language at home - Born in the United States (%)
Residents speaking other language at home - Native, born elsewhere (%)
Residents speaking other language at home - Foreign born (%)
Marital status - Never married (%)
Marital status - Now married (%)
Marital status - Separated (%)
Marital status - Widowed (%)
Marital status - Divorced (%)
Ancestries Reported - Arab (%)
Ancestries Reported - Czech (%)
Ancestries Reported - Danish (%)
Ancestries Reported - Dutch (%)
Ancestries Reported - English (%)
Ancestries Reported - French (%)
Ancestries Reported - French Canadian (%)
Ancestries Reported - German (%)
Ancestries Reported - Greek (%)
Ancestries Reported - Hungarian (%)
Ancestries Reported - Irish (%)
Ancestries Reported - Italian (%)
Ancestries Reported - Lithuanian (%)
Ancestries Reported - Norwegian (%)
Ancestries Reported - Polish (%)
Ancestries Reported - Portuguese (%)
Ancestries Reported - Russian (%)
Ancestries Reported - Scotch-Irish (%)
Ancestries Reported - Scottish (%)
Ancestries Reported - Slovak (%)
Ancestries Reported - Subsaharan African (%)
Ancestries Reported - Swedish (%)
Ancestries Reported - Swiss (%)
Ancestries Reported - Ukrainian (%)
Ancestries Reported - United States (%)
Ancestries Reported - Welsh (%)
Ancestries Reported - West Indian (%)
Ancestries Reported - Other (%)
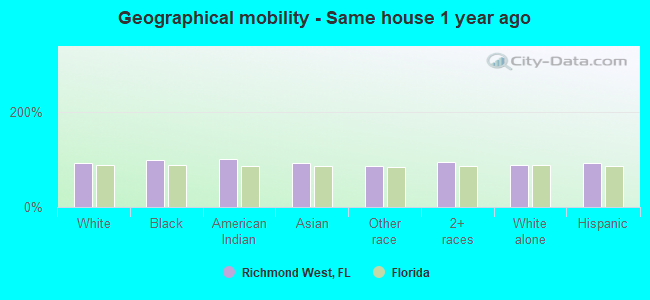
Geographical mobility - Same house 1 year ago (%)
Geographical mobility - Same house 1 year ago (%) - White
Geographical mobility - Same house 1 year ago (%) - Black or African American
Geographical mobility - Same house 1 year ago (%) - Asian
Geographical mobility - Same house 1 year ago (%) - Hispanic or Latino
Geographical mobility - Same house 1 year ago (%) - American Indian and Alaska Native
Geographical mobility - Same house 1 year ago (%) - Multirace
Geographical mobility - Same house 1 year ago (%) - Other Race
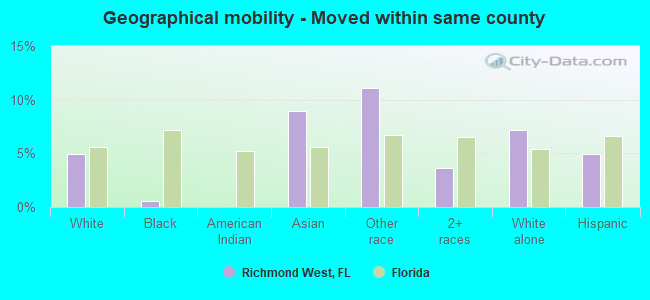
Geographical mobility - Moved within same county (%)
Geographical mobility - Moved within same county (%) - White
Geographical mobility - Moved within same county (%) - Black or African American
Geographical mobility - Moved within same county (%) - Asian
Geographical mobility - Moved within same county (%) - Hispanic or Latino
Geographical mobility - Moved within same county (%) - American Indian and Alaska Native
Geographical mobility - Moved within same county (%) - Multirace
Geographical mobility - Moved within same county (%) - Other Race
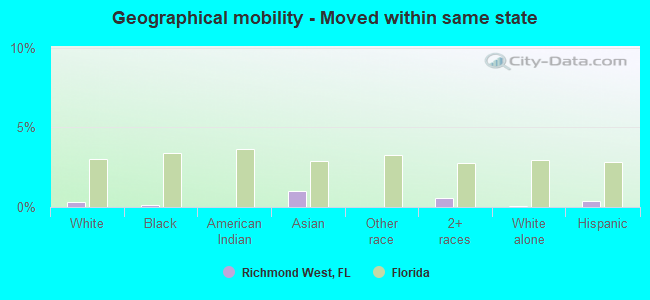
Geographical mobility - Moved from different county within same state (%)
Geographical mobility - Moved from different county within same state (%) - White
Geographical mobility - Moved from different county within same state (%) - Black or African American
Geographical mobility - Moved from different county within same state (%) - Asian
Geographical mobility - Moved from different county within same state (%) - Hispanic or Latino
Geographical mobility - Moved from different county within same state (%) - American Indian and Alaska Native
Geographical mobility - Moved from different county within same state (%) - Multirace
Geographical mobility - Moved from different county within same state (%) - Other Race
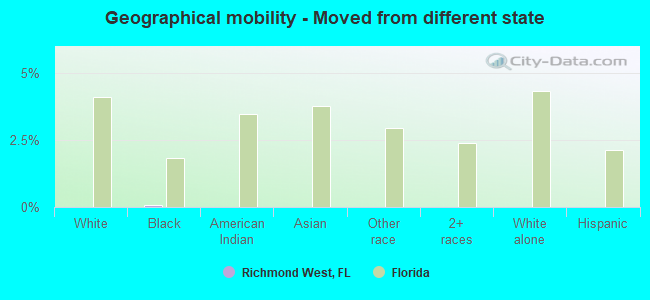
Geographical mobility - Moved from different state (%)
Geographical mobility - Moved from different state (%) - White
Geographical mobility - Moved from different state (%) - Black or African American
Geographical mobility - Moved from different state (%) - Asian
Geographical mobility - Moved from different state (%) - Hispanic or Latino
Geographical mobility - Moved from different state (%) - American Indian and Alaska Native
Geographical mobility - Moved from different state (%) - Multirace
Geographical mobility - Moved from different state (%) - Other Race
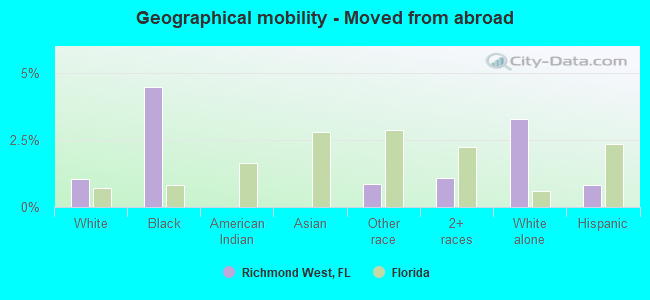
Geographical mobility - Moved from abroad (%)
Geographical mobility - Moved from abroad (%) - White
Geographical mobility - Moved from abroad (%) - Black or African American
Geographical mobility - Moved from abroad (%) - Asian
Geographical mobility - Moved from abroad (%) - Hispanic or Latino
Geographical mobility - Moved from abroad (%) - American Indian and Alaska Native
Geographical mobility - Moved from abroad (%) - Multirace
Geographical mobility - Moved from abroad (%) - Other Race
Place of birth for the foreign-born population - Ireland (%)
Place of birth for the foreign-born population - Denmark (%)
Place of birth for the foreign-born population - Norway (%)
Place of birth for the foreign-born population - Sweden (%)
Place of birth for the foreign-born population - United Kingdom (%)
Place of birth for the foreign-born population - England (%)
Place of birth for the foreign-born population - Scotland (%)
Place of birth for the foreign-born population - Other Northern Europe (%)
Place of birth for the foreign-born population - Austria (%)
Place of birth for the foreign-born population - Belgium (%)
Place of birth for the foreign-born population - France (%)
Place of birth for the foreign-born population - Germany (%)
Place of birth for the foreign-born population - Netherlands (%)
Place of birth for the foreign-born population - Switzerland (%)
Place of birth for the foreign-born population - Other Western Europe (%)
Place of birth for the foreign-born population - Greece (%)
Place of birth for the foreign-born population - Italy (%)
Place of birth for the foreign-born population - Portugal (%)
Place of birth for the foreign-born population - Spain (%)
Place of birth for the foreign-born population - Other Southern Europe (%)
Place of birth for the foreign-born population - Albania (%)
Place of birth for the foreign-born population - Belarus (%)
Place of birth for the foreign-born population - Bosnia and Herzegovina (%)
Place of birth for the foreign-born population - Bulgaria (%)
Place of birth for the foreign-born population - Croatia (%)
Place of birth for the foreign-born population - Czechoslovakia (%)
Place of birth for the foreign-born population - Hungary (%)
Place of birth for the foreign-born population - Latvia (%)
Place of birth for the foreign-born population - Lithuania (%)
Place of birth for the foreign-born population - North Macedonia (Macedonia) (%)
Place of birth for the foreign-born population - Moldova (%)
Place of birth for the foreign-born population - Poland (%)
Place of birth for the foreign-born population - Romania (%)
Place of birth for the foreign-born population - Russia (%)
Place of birth for the foreign-born population - Serbia (%)
Place of birth for the foreign-born population - Ukraine (%)
Place of birth for the foreign-born population - Other Eastern Europe (%)
Place of birth for the foreign-born population - China (%)
Place of birth for the foreign-born population - Hong Kong (%)
Place of birth for the foreign-born population - Taiwan (%)
Place of birth for the foreign-born population - Japan (%)
Place of birth for the foreign-born population - Korea (%)
Place of birth for the foreign-born population - Other Eastern Asia (%)
Place of birth for the foreign-born population - Afghanistan (%)
Place of birth for the foreign-born population - Bangladesh (%)
Place of birth for the foreign-born population - India (%)
Place of birth for the foreign-born population - Iran (%)
Place of birth for the foreign-born population - Kazakhstan (%)
Place of birth for the foreign-born population - Nepal (%)
Place of birth for the foreign-born population - Pakistan (%)
Place of birth for the foreign-born population - Sri Lanka (%)
Place of birth for the foreign-born population - Uzbekistan (%)
Place of birth for the foreign-born population - Other South Central Asia (%)
Place of birth for the foreign-born population - Burma (%)
Place of birth for the foreign-born population - Cambodia (%)
Place of birth for the foreign-born population - Indonesia (%)
Place of birth for the foreign-born population - Laos (%)
Place of birth for the foreign-born population - Malaysia (%)
Place of birth for the foreign-born population - Philippines (%)
Place of birth for the foreign-born population - Singapore (%)
Place of birth for the foreign-born population - Thailand (%)
Place of birth for the foreign-born population - Vietnam (%)
Place of birth for the foreign-born population - Other South Eastern Asia (%)
Place of birth for the foreign-born population - Armenia (%)
Place of birth for the foreign-born population - Iraq (%)
Place of birth for the foreign-born population - Israel (%)
Place of birth for the foreign-born population - Jordan (%)
Place of birth for the foreign-born population - Kuwait (%)
Place of birth for the foreign-born population - Lebanon (%)
Place of birth for the foreign-born population - Saudi Arabia (%)
Place of birth for the foreign-born population - Syria (%)
Place of birth for the foreign-born population - Turkey (%)
Place of birth for the foreign-born population - Yemen (%)
Place of birth for the foreign-born population - Other Western Asia (%)
Place of birth for the foreign-born population - Eritrea (%)
Place of birth for the foreign-born population - Ethiopia (%)
Place of birth for the foreign-born population - Kenya (%)
Place of birth for the foreign-born population - Somalia (%)
Place of birth for the foreign-born population - Uganda (%)
Place of birth for the foreign-born population - Zimbabwe (%)
Place of birth for the foreign-born population - Other Eastern Africa (%)
Place of birth for the foreign-born population - Cameroon (%)
Place of birth for the foreign-born population - Congo (%)
Place of birth for the foreign-born population - Democratic Republic of Congo (Zaire) (%)
Place of birth for the foreign-born population - Other Middle Africa (%)
Place of birth for the foreign-born population - Egypt (%)
Place of birth for the foreign-born population - Morocco (%)
Place of birth for the foreign-born population - Sudan (%)
Place of birth for the foreign-born population - Other Northern Africa (%)
Place of birth for the foreign-born population - South Africa (%)
Place of birth for the foreign-born population - Other Southern Africa (%)
Place of birth for the foreign-born population - Cabo Verde (%)
Place of birth for the foreign-born population - Ghana (%)
Place of birth for the foreign-born population - Liberia (%)
Place of birth for the foreign-born population - Nigeria (%)
Place of birth for the foreign-born population - Senegal (%)
Place of birth for the foreign-born population - Sierra Leone (%)
Place of birth for the foreign-born population - Other Western Africa (%)
Place of birth for the foreign-born population - Australia (%)
Place of birth for the foreign-born population - New Zealand (%)
Place of birth for the foreign-born population - Fiji (%)
Place of birth for the foreign-born population - Micronesia (%)
Place of birth for the foreign-born population - Bahamas (%)
Place of birth for the foreign-born population - Barbados (%)
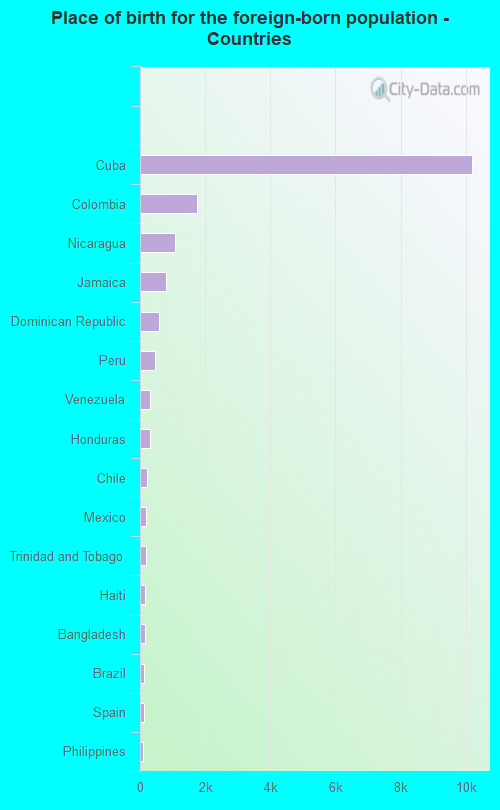
Place of birth for the foreign-born population - Cuba (%)
Place of birth for the foreign-born population - Dominica (%)
Place of birth for the foreign-born population - Dominican Republic (%)
Place of birth for the foreign-born population - Grenada (%)
Place of birth for the foreign-born population - Haiti (%)
Place of birth for the foreign-born population - Jamaica (%)
Place of birth for the foreign-born population - St. Vincent and the Grenadines (%)
Place of birth for the foreign-born population - Trinidad and Tobago (%)
Place of birth for the foreign-born population - West Indies (%)
Place of birth for the foreign-born population - Other Caribbean (%)
Place of birth for the foreign-born population - Belize (%)
Place of birth for the foreign-born population - Costa Rica (%)
Place of birth for the foreign-born population - El Salvador (%)
Place of birth for the foreign-born population - Guatemala (%)
Place of birth for the foreign-born population - Honduras (%)
Place of birth for the foreign-born population - Mexico (%)
Place of birth for the foreign-born population - Nicaragua (%)
Place of birth for the foreign-born population - Panama (%)
Place of birth for the foreign-born population - Other Central America (%)
Place of birth for the foreign-born population - Argentina (%)
Place of birth for the foreign-born population - Bolivia (%)
Place of birth for the foreign-born population - Brazil (%)
Place of birth for the foreign-born population - Chile (%)
Place of birth for the foreign-born population - Colombia (%)
Place of birth for the foreign-born population - Ecuador (%)
Place of birth for the foreign-born population - Guyana (%)
Place of birth for the foreign-born population - Peru (%)
Place of birth for the foreign-born population - Uruguay (%)
Place of birth for the foreign-born population - Venezuela (%)
Place of birth for the foreign-born population - Other South America (%)
Place of birth for the foreign-born population - Canada (%)
Place of birth for the foreign-born population - Other Northern America (%)
Place of birth for the foreign-born population - Other (%)
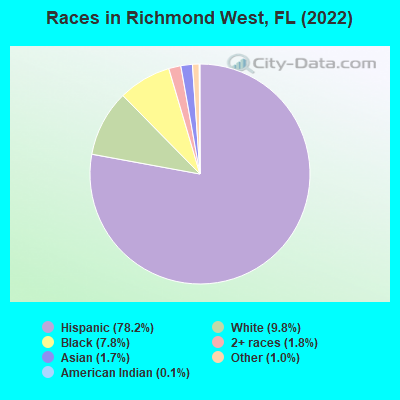
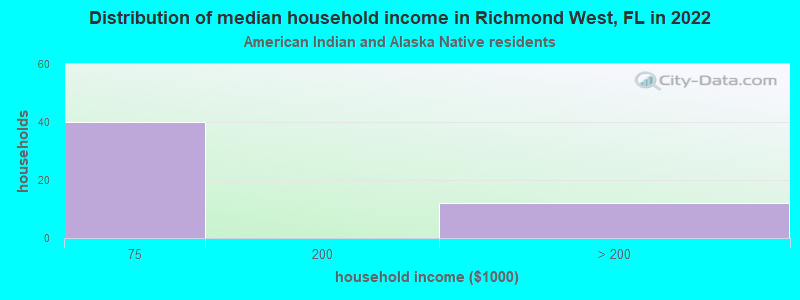
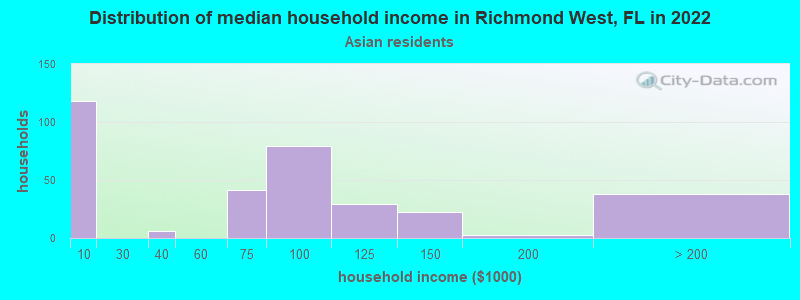
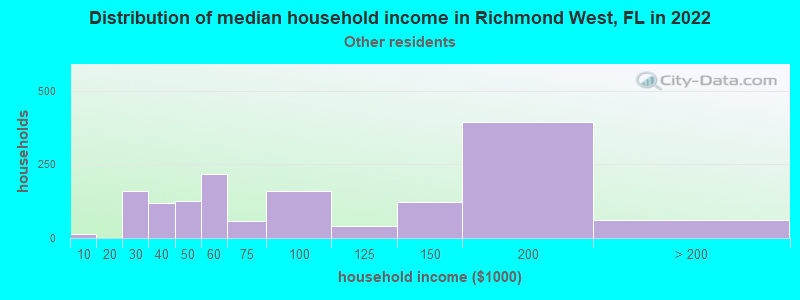
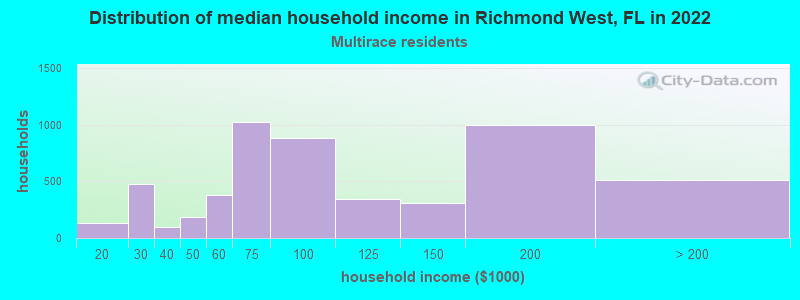
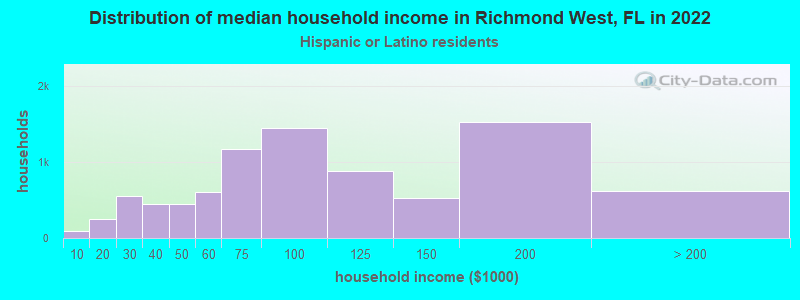
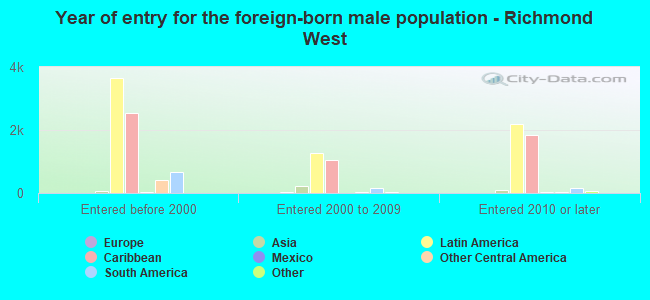
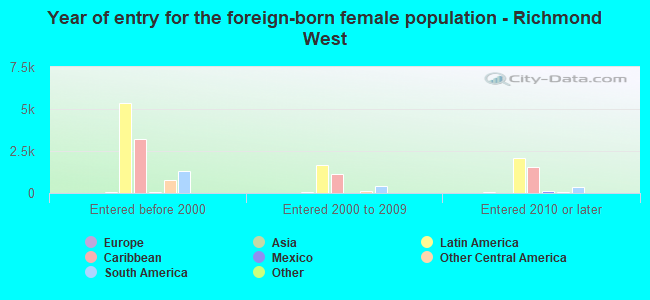
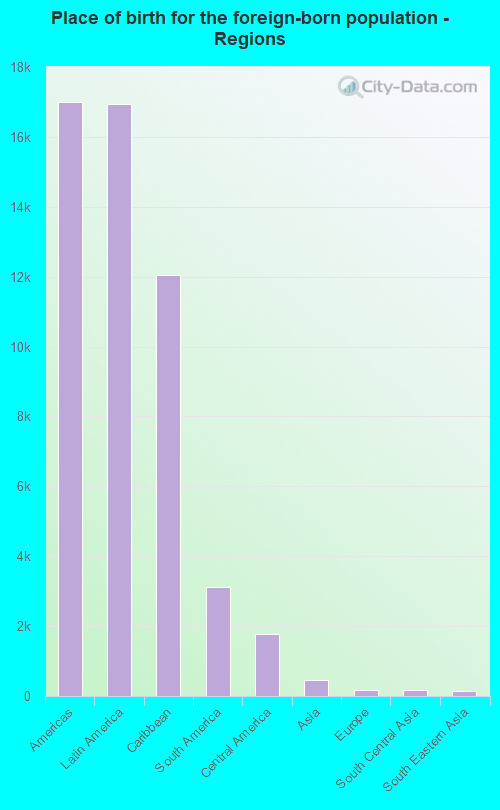
According to 2022 data, the most numerous races in Richmond West, FL are White alone (3,603 residents), Hispanic (28,750 residents), and Black alone (2,867 residents). 21.9% of Richmond West residents speak English at home. 48.0% of Richmond West, FL residents are foreign-born (45.9% born in Latin America), which is 56.3% greater than the foreign-born rate of 21.0% across the entire state of Florida.
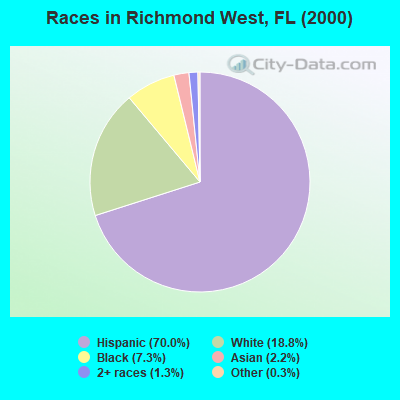
Race distribution in Richmond West
2000 2022
10,458,509 65.4% White alone 2,682,715 16.8% Hispanic 2,264,268 14.2% Black alone 261,693 1.6% Asian alone 236,954 1.5% Two or more races 42,358 0.3% American Indian alone 28,994 0.2% Other race alone 6,887 0.04% Native Hawaiian and Other
11,309,403 50.8% White alone 6,025,039 27.1% Hispanic 3,241,015 14.6% Black alone 861,630 3.9% Two or more races 623,692 2.8% Asian alone 152,054 0.7% Other race alone 22,504 0.1% American Indian alone 9,486 0.04% Native Hawaiian and Other
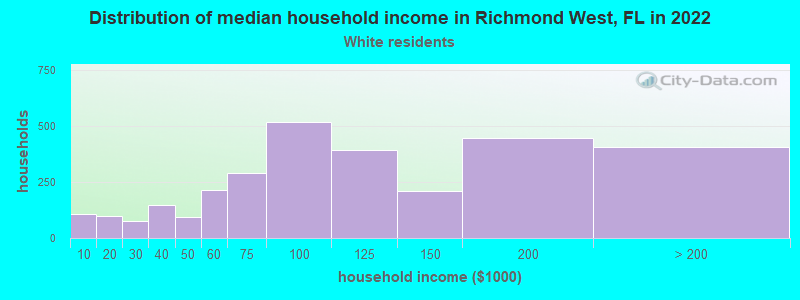
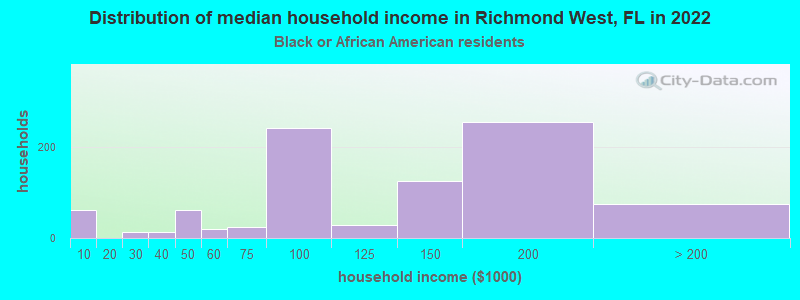
Income and house value in Richmond West Median household income in 2022 $136,861 White non-Hispanic householders$100,983 Black householders$82,301 Some other race householders$86,703 Two or more races householders$89,592 Hispanic or Latino race householdersMedian 2022 house value $508,132 White Non-Hispanic householders$460,366 Black or African American householders$517,159 American Indian or Alaska Native householders $529,571 Asian householders$423,130 Native Hawaiian and other Pacific Islander householders$481,428 Some other race householders$516,031 Two or more races householders$484,813 Hispanic or Latino householders
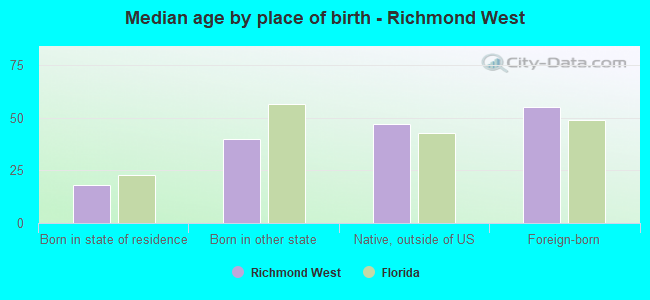
Median age by race in Richmond West
34.5 Median age for White residents29.3 37.1 44.3 Median age for Black or African American residents38.0 52.4 26.0 Median age for American Indian / Alaska Native residents44.4 -762,696,213.5 50.2 Median age for Asian residents33.9 55.7 -679,849,340.2 Median age for Native Hawaiian / Pacific Islander residents-858,307,848.3 -443,298,968.6 66.8 Median age for Other race residents56.0 69.2 41.8 Median age for Two or more races residents39.9 43.3 23.2 Median age for White alone residents20.9 33.9 42.7 Median age for Hispanic or Latino residents39.7 46.0
Owner/renter occupied households by race in Richmond West
House owners and renters - White residents 2,376 79.0% Owner occupied631 21.0% Renter occupiedHouse owners and renters - Black or African American residents 752 91.4% Owner occupied71 8.6% Renter occupiedHouse owners and renters - American Indian / Alaska Native residents 37 100.0% Owner occupiedHouse owners and renters - Asian residents 164 48.3% Owner occupied175 51.7% Renter occupiedHouse owners and renters - Other race residents 1,316 89.3% Owner occupied157 10.7% Renter occupiedHouse owners and renters - Two or more races residents 4,691 87.0% Owner occupied700 13.0% Renter occupiedHouse owners and renters - White alone residents 741 82.4% Owner occupied158 17.6% Renter occupiedHouse owners and renters - Hispanic or Latino residents 6,988 82.1% Owner occupied1,524 17.9% Renter occupied
Language usage in Richmond West
English speakers - Total 21.9% of residents of Richmond West speak English at home.
74.5% of residents speak Spanish at home 16,204 61.7% Speak English very well10,054 38.3% Speak English less than very well3.3% of residents speak other language at home 782 67.9% Speak English very well369 32.1% Speak English less than very well
English speakers - Born in the United States 46.2% of residents of Richmond West speak English at home.
51.2% of residents speak Spanish at home 1,977 87.5% Speak English very well283 12.5% Speak English less than very well2.0% of residents speak other language at home 72 82.8% Speak English very well15 17.2% Speak English less than very well
English speakers - Native, born elsewhere 17.7% of residents of Richmond West speak English at home.
80.5% of residents speak Spanish at home 1,291 69.6% Speak English very well564 30.4% Speak English less than very well
English speakers - Foreign-born 9.1% of residents of Richmond West speak English at home.
85.4% of residents speak Spanish at home 6,252 41.6% Speak English very well8,785 58.4% Speak English less than very well5.3% of residents speak other language at home 588 62.8% Speak English very well348 37.2% Speak English less than very well
White (Caucasian) - Speak only English Native:
47.1% (3,445)Foreign-born:
5.3% (169)
White (Caucasian) - Speak another language Native:
50.1% (3,660)Foreign-born:
93.1% (2,949)
Black or African American - Speak only English Native:
81.4% (1,565)Foreign-born:
72.3% (849)
Black or African American - Speak another language Native:
18.6% (357)Foreign-born:
32.3% (379)
American Indian / Alaska Native - Speak another language Native:
38.8% (41)Foreign-born:
98.3% (31)
Asian - Speak only English Native:
51.9% (79)Foreign-born:
9.3% (50)
Asian - Speak another language Native:
47.8% (73)Foreign-born:
92.6% (503)
Other race - Speak only English Native:
22.3% (347)Foreign-born:
5.1% (169)
Other race - Speak another language Native:
77.7% (1,207)Foreign-born:
94.9% (3,131)
Two or more races - Speak only English Native:
8.6% (612)Foreign-born:
4.6% (445)
Two or more races - Speak another language Native:
91.7% (6,490)Foreign-born:
95.4% (9,200)
White alone - Speak only English Native:
74.6% (2,267)Foreign-born:
7.7% (24)
White alone - Speak another language Native:
25.4% (771)Foreign-born:
87.7% (269)
Hispanic or Latino - Speak only English Native:
15.8% (1,932)Foreign-born:
2.8% (431)
Hispanic or Latino - Speak another language Native:
84.1% (10,262)Foreign-born:
97.1% (15,000)
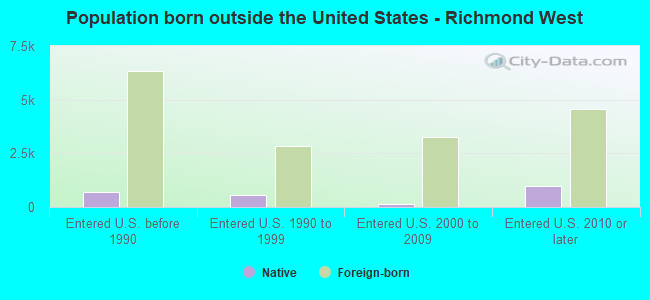
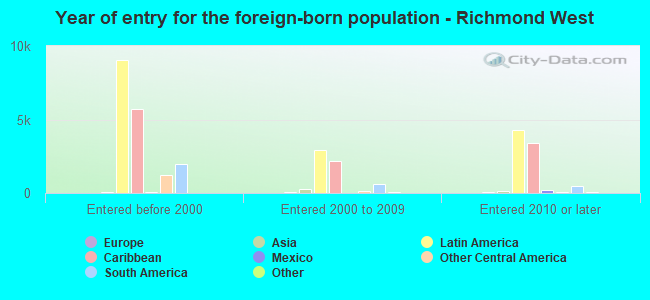
Foreign-born residents in Richmond West 17,662 residents are foreign born (45.9% Latin America ).
This city:
48.0%Florida:
21.1%
Marital status for residents in Richmond West Marital status - White (Caucasian) population 15 years and over
Males 38.0% Never married52.9% Now married0.4% Separated3.9% Widowed4.8% DivorcedFemales 21.7% Never married49.0% Now married3.7% Separated7.3% Widowed18.3% DivorcedWomen who gave birth in the past 12 months Now married:
57.5% (109)Unmarried:
42.5% (81)
Women who did not give birth in the past 12 months Now married:
46.4% (989)Unmarried:
53.6% (1,143)
Marital status - Black or African American population 15 years and over
Males 49.6% Never married42.7% Now married0.9% Separated0.0% Widowed6.8% DivorcedFemales 37.3% Never married30.4% Now married1.3% Separated12.0% Widowed19.0% DivorcedWomen who did not give birth in the past 12 months Now married:
17.0% (114)Unmarried:
83.0% (559)
Marital status - American Indian / Alaska Native population 15 years and over
Males 41.1% Never married17.9% Now married17.9% Separated23.2% Widowed0.0% DivorcedFemales 76.2% Never married23.8% Now married0.0% Separated0.0% Widowed0.0% DivorcedWomen who did not give birth in the past 12 months Now married:
0.0% (0)Unmarried:
100.0% (51)
Marital status - Asian population 15 years and over
Males 50.6% Never married30.8% Now married0.0% Separated9.9% Widowed8.7% DivorcedFemales 19.0% Never married68.7% Now married0.0% Separated12.3% Widowed0.0% DivorcedWomen who gave birth in the past 12 months Now married:
100.0% (8)Unmarried:
0.0% (0)
Women who did not give birth in the past 12 months Now married:
71.4% (26)Unmarried:
28.6% (10)
Marital status - Other race population 15 years and over
Males 40.3% Never married44.0% Now married0.8% Separated2.2% Widowed12.8% DivorcedFemales 26.0% Never married37.8% Now married1.2% Separated26.8% Widowed8.2% DivorcedWomen who gave birth in the past 12 months Now married:
100.0% (38)Unmarried:
0.0% (0)
Women who did not give birth in the past 12 months Now married:
33.5% (233)Unmarried:
66.5% (463)
Marital status - Two or more races population 15 years and over
Males 26.1% Never married61.8% Now married0.8% Separated2.3% Widowed9.0% DivorcedFemales 21.0% Never married54.1% Now married5.6% Separated8.9% Widowed10.4% DivorcedWomen who gave birth in the past 12 months Now married:
25.4% (56)Unmarried:
74.6% (164)
Women who did not give birth in the past 12 months Now married:
57.6% (2,470)Unmarried:
42.4% (1,822)
Marital status - White alone, not Hispanic / Latino population 15 years and over
Males 51.9% Never married44.7% Now married0.0% Separated0.5% Widowed2.9% DivorcedFemales 28.3% Never married43.6% Now married1.6% Separated10.3% Widowed16.1% DivorcedWomen who gave birth in the past 12 months Now married:
100.0% (8)Unmarried:
0.0% (0)
Women who did not give birth in the past 12 months Now married:
45.2% (309)Unmarried:
54.8% (375)
Marital status - Hispanic or Latino population 15 years and over
Males 32.6% Never married55.6% Now married0.6% Separated3.6% Widowed7.7% DivorcedFemales 20.9% Never married49.8% Now married4.2% Separated10.7% Widowed14.5% DivorcedWomen who gave birth in the past 12 months Now married:
49.2% (236)Unmarried:
50.8% (244)
Women who did not give birth in the past 12 months Now married:
51.0% (3,108)Unmarried:
49.0% (2,982)
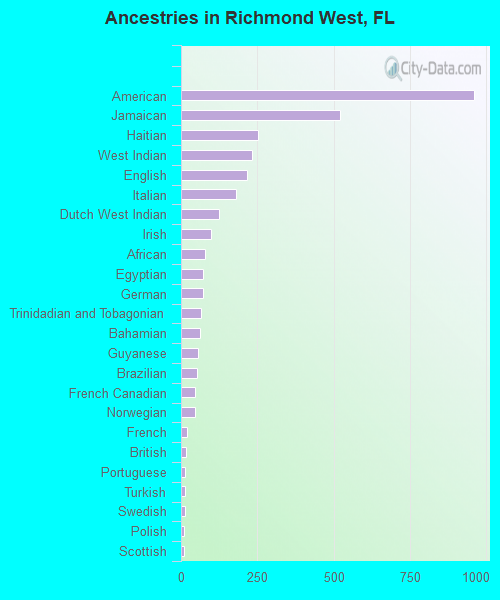
Ancestries in Richmond West
961 3.9% American522 2.1% Jamaican253 1.0% Haitian231 0.9% West Indian216 0.9% English180 0.7% Italian124 0.5% Dutch West Indian98 0.4% Irish77 0.3% African72 0.3% Egyptian72 0.3% German66 0.3% Trinidadian and Tobagonian63 0.3% Bahamian56 0.2% Guyanese51 0.2% Brazilian47 0.2% French Canadian47 0.2% Norwegian20 0.08% French16 0.07% British14 0.06% Portuguese14 0.06% Turkish12 0.05% Swedish11 0.05% Polish10 0.04% Scottish8 0.03% Dutch6 0.02% Scotch-Irish5 0.02% U.S. Virgin Islander
Geographical mobility in Richmond West Same house 1 year ago 9,423 91.8% White (Caucasian)3,027 97.7% Black or African American155 100.0% American Indian / Alaska Native648 92.5% Asian4,272 85.8% Other race16,564 94.5% Two or more races3,150 88.1% White alone, not Hispanic / Latino26,529 93.2% Hispanic or LatinoMoved within same county 508 5.0% White / Caucasian16 0.5% Black or African American63 9.0% Asian554 11.1% Other race637 3.6% Two or more races255 7.1% White alone, not Hispanic / Latino1,398 4.9% Hispanic or LatinoMoved within same state 33 0.3% White / Caucasian4 0.1% Black or African American7 1.0% Asian99 0.6% Two or more races3 0.1% White alone, not Hispanic / Latino102 0.4% Hispanic or LatinoMoved from different state 3 0.1% Black or African AmericanMoved from abroad 107 1.0% White139 4.5% Black or African American42 0.9% Other race190 1.1% Two or more races117 3.3% White alone, not Hispanic / Latino237 0.8% Hispanic or Latino
Children Nativity (place of birth) in Richmond West
Children under 6 years - Living with two parents Both parents native 460 100.0% NativeBoth parents foreign-born 263 95.9% Native11 4.1% Foreign-bornOne native, one foreign-born parent 234 100.0% NativeChildren under 6 years - Living with one parent Native parent 331 99.5% Native2 0.5% Foreign-bornForeign-born parent 510 93.0% Native38 7.0% Foreign-bornChildren 6 to 17 years - Living with two parents Both parents native 1,086 100.0% NativeBoth parents foreign-born 952 78.6% Native259 21.4% Foreign-bornOne native, one foreign-born parent 826 90.2% Native89 9.8% Foreign-bornChildren 6 to 17 years - Living with one parent Native parent 1,758 100.0% NativeForeign-born parent 749 53.8% Native644 46.2% Foreign-born
Grandparents responsible for own grandchildren in Richmond West
Grandparents (30 to 59 years) White / Caucasian 203 100.0% Not responsible for grandchildrenOther race 82 100.0% Not responsible for grandchildrenTwo or more races 734 100.0% Not responsible for grandchildrenWhite alone, not Hispanic / Latino 26 100.0% Not responsible for grandchildrenHispanic or Latino 732 100.0% Not responsible for grandchildrenGrandparents (60 years and over) White / Caucasian 7 1.8% Responsible for grandchildren372 98.2% Not responsible for grandchildrenOther race 7 1.7% Responsible for grandchildren435 98.3% Not responsible for grandchildrenTwo or more races 107 11.0% Responsible for grandchildren867 89.0% Not responsible for grandchildrenWhite alone, not Hispanic / Latino 132 100.0% Not responsible for grandchildrenHispanic or Latino 95 6.9% Responsible for grandchildren1,285 93.1% Not responsible for grandchildren